NIFTY FOR TOMMOROW - 18 June 2021Nifty opened gap down today, it tried to fill the gap it created today, but couldn't sustain at higher levels and closed almost where it opened today.
If you see the today's candle formation, its like a inverted hammer candle, but the structure of the candle is of lower low and formed after gap, hence not very important for support purposes.
Now what for tomorrow ??
If we see the previous price action, prices did close at the critical support , it is the area from where the price bounces various times, so we need to be careful while creating new short positions.
So for tomorrow, considering today's closing , I am expecting nifty might open flat or gap down and if opened as per expectation, and sustains below 15700 - 15750 it might test support zone of 15630-15580 and only decisive close below this level could exaggerate selling in the index and could move uptill 15400 levels.
Supply zone : 15700-15750
Demand zone : 15630-15580
Niftyindia

BANKNIFTY KRA BUY NEW HIGH 9872412530NOW NIFTYBANK TURN NEW HIGH...... BEFORE BUY SELL MUST CONFIRM WE HOLD OR PROFIT BOOK
MORE INFO 9872412530

Adani ENT Possible Short AdaniEnt is in strong uptrend. We have seen almost 30% move last week when it broke out from 1350 towards 1700.
At this point, there are no signs of bearishness on any timeframes. However, I see a harmonic pattern and I am explaining it below. Pl note that this is a monthly chart on the log scale.
Harmonic inherently does not support log scale therefore we have to manually project X-A, ABC Leg and B to C leg and look for major FIB Levels. FIB retracement and Trend based FIB extension tool on trading view supports FIB levels based on the log scale. I have mentioned levels in the chart only and therefore I am not repeating it here.
Additionally, I have used pitchfork took. Pitchfork is used to project long term price cycles based on the trendlines drawn from FIB levels and identify swings. There are variations of the tool namely standard pitchfork (aka Andrew Pitchfork), modified pitchfork etc. For this, I have used standard pitchfork tool. Explaining the pitchfork in the idea not recommended but you can find relevant materials on Investopedia and YouTube. Pl see that 0.618 FIB line on the pitchfork acts as a resistance. I am not using it regularly but I do know about its usefulness and limitations.
Again these are all possible zones from where we can see swing high formation and should see a correction but that does not mean we short it immediately. Let Price action show a bearishness with RSI weakness. negative divergence or some sort of bearish candlestick patterns. We will need to carefully wait and see how price structure develops from here and take a call accordingly. But Again, these are just possible zones from where market may reverse but nothing guaranteed.

NEOWAVE DIAMETRIC CORRECTION IN NIFTYplease study NEO WAVE'S diametric correction (Glen neely) ,I tried in NIFTY weekly clossing which is perfectly matching.
BUT he says intraday price levels are important, however I tried in daily, weekly clossing values which are predominant for more than a day.
'g' wave ending this week as per time cycle of 'a' wave , if it crosses 15687 (daily clossing), then 'g' wave will exend, otherwise pattern completed

nifty all time high nifty is forming rising wedge pattran and waiting for breakout for up side and we can bullish pin bar candle which show nifty is can move high

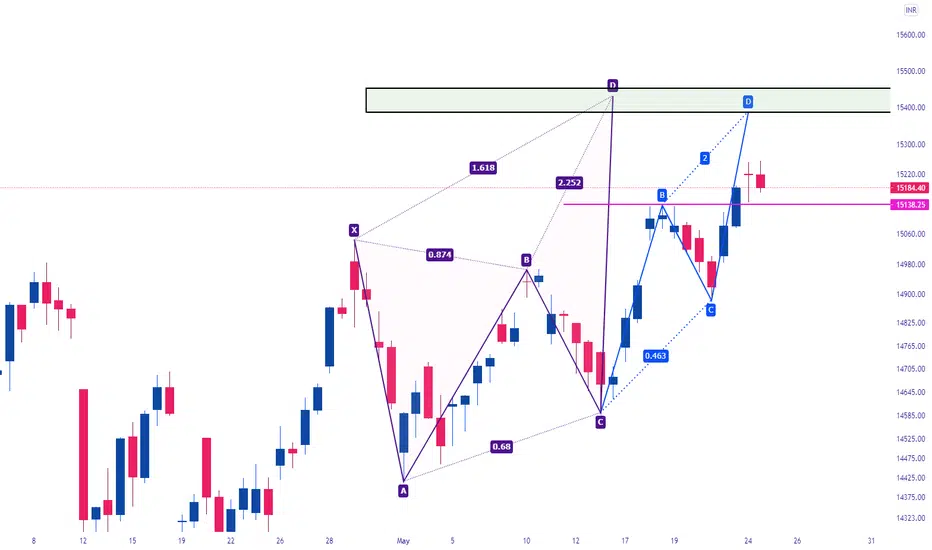
Nifty Deep Crab Harmonic PatternNifty is forming Deep Crab in 1 Hour and 2 Hour and pattern is confirmed.
It is still not bearish at the moment therefore, please wait for some signs of weakness.
Per Scott Carney (Harmonic Trader) , SL for Deep crab should be around FIb level 2 of XA Leg.
Other possible levels are 2.618 FIB Extension of BC Leg and 1.618 FIB derived from trend based FIB from ABC Swing. (Pl note that this 1.618 FIB is not prescribed level per harmonic trader books and strategies. This is based on my experience and learning.
Again, right now it is not at all weak, Let is show some signs of weakness, like RSI sliding down, Bearish Div. on RSI, bearish candlestick pattern, bearish price action patterns etc.

Nifty Intraday for 29th June and view for Next weekHello Everyone,
Hope you guys have done well in the monthly expiry and made enough bread now let's talk about today intraday and for the Next week as well. you have seen that how Harmonic patterns work and can count every and each swing. You Just need to understand the momentum and the Market structure.
Nifty is Trading on their resistance as per Harmonic ABCD pattern and a correction is Possible from 15,400-15,440 but a trend line is holding the trend so do not rush to open a short Position and its also against the mid and long term trend so I would not suggest to short until 15,270 breaks. We are getting 180 Point range for today and for next week as well.
Good Luck

Nifty : At Huge resistanceNifty may correct from the current 15400 levels to 14200 levels in the coming days due to strong resistance in 15400 levels.The previous weak correction followed by a weak bounce back doesn't encourage the nifty to go up furhter.

Nifty 50 Intraday Trade Setup for 26th May 2021Good morning Traders,
The index is trading on a crucial and narrow range, You must be careful today because today is the last day before the Monthly Expiry. High Probability is Writers Play their game and manage the premiums in today's trading session. The problem is we are getting a very big Range in the Intraday 15,100 to 15,300 which is quite big for Intraday. Try to Understand the Range 200 Points Index has space to move 200 points Intraday before the breakout or Breakdown which is a sign for a volatile market so Be careful and trade according to the level.
Good Luck
Virendra Pandey

Nifty 50 Intraday Trade Setup for 25th May 2021The index went a narrow range after last week's rally. There is Multiple resistance now 15,380 to 15,400 the whole area is a supply zone as per our Harmonic XABCD & ABCD pattern and support is 15,100 now. SO we are getting only 300 point range for this week which is very low for Intraday.
you guys must know why Intraday is a bit risky if Index trading in a narrow range. I repeat very little room on both sides so set up your trade according to it .
Intraday range is 15,130 to 15,260

Nifty Future Nifty Future looking bullish
One can go Long now or in dips with stoploss of 14990
All the key levels are mentioned in chart with Stop-loss and Targets
Key Levels
Upper Bollinger
Macd in daily positive
Macd in hourly positive
Adx in daily positive
ADX in hourly positive
Rsi in daily above 60
Rsi in hourly above 60
Disclaimer
I am not sebi registered analyst
My studies are Educational purpose only
Please consult with your Financial advisor before trading or investing

NIFTY 50 - Probable path moving ForwardNifty opens gap up today, followed by a good move, now sustaining above 14950, it could initially move towards 15220 and also towards 15430 levels in the coming trading sessions


NIFTY LEVELS FOR 18 MAY 2021LONG NIFTY AT OPEN TGT1 15120
IF NIFTY CLOSE ABOVE 15120 THEN IT WILL BREAK LIFETIME HIGH THIS WEEK

#NiftyPharma Long?It is make or break at this point, I am obviously bullish and excited to see what happens next!

NIFTY LEVELS FOR 17 MAY 2021LONG NIFTY ABOVE 14710 TGT1 14780 TGT2 14880 SL 14650
SHORT NIFTY BELOW 14650 TGT1 14580 TGT2 14510 SL 14710

bullish above black line -- bearish below blue line, NIFTY 50NIFTY 50 moved in down channel, may be break this channel if go above black line....
now its in consolidation in 1 Hour chart... but if sustain above black line it will give big move upper side,
if sustain below blue line,, then it will continue bearish mode.....
write below if you have question!!

Nifty Future Nifty looking to start a new impulse
All the key levels are mentioned in chart with Stop-loss and Targets
Disclaimer
I am not sebi registered analyst
My studies are Educational purpose only
Please consult with your Financial advisor before trading or investing


Tata Steel Long term investment pick
Positional Buy
All key levels are mentioned in chart
Disclaimer
I am not sebi registered analyst
My studies are Educational purpose only
Please consult with your Financial advisor before trading or investing

CONCOR : NEAR BREAKOUT LEVELS CONCOR is Trading near Breakout....once It's break it will Expected to test 850 levels in 2 months
