15th Feb ’23-60 seconds Live Day Trading View Nifty BankNifty 15th Feb ’23-Looking to buy nifty if conditions in the video meet
Niftyintraday

8th Feb ’23-Day 60 seconds Live Day Trading View Nifty8th Feb ’23-Day 60 seconds Live Day Trading View Nifty

Nifty Intraday for 16th Jan 2023#Nifty has bounced multiple times from their support (17,760) and created a possible bottom that could signal the hourly trend reversal, but we need confirmation. Friday's closing was the most important because it was the week's last session, and we have seen a favourable ending. Let's see if the market sentiment continues.
2 Hour TF
=========
1- Bottom valid since Dec 26'th
2- Hourly swing high break(17,880) on the Friday session and managed to close above
3-Trend line resistance holds the current downtrend (18,005) in the hourly time frame.
4- Intraday Range is 17,880 to 18,005
Trade Accordingly!

Nifty Trade setup Idea - 15 september 2022Nifty looks a little weaker compared to Banknifty, based on the fall in price towards the end of the trading day yesterday.
We will wait for a day to trade Nifty, so that nifty breaks the range of 18060-17020. The market might mostly be trading within this range today.
I would skip Nifty if it is within this range today and just trade banknifty.

Nifty Levels & Strategy for 09/09/2022Dear traders, I have identified chart levels based on my analysis, major support, and resistance levels. Please note that I am not a SEBI registered member. Information shared here for educational purpose. Please don’t trust me or anyone for trading/investment purpose. Focus on learning how to fish, trust your own skills and please do consult your financial advisor before trading.
NIFTY
Nifty is up by 174 points. Steller performance by Nifty. PCR shifted up from 0.92 (bearish zone) to 1.17 (bullish zone). Nifty performed beyond expectation and hit all the targets. Option writers also made good money as most of them timely close CE leg and PE writing continued through the trading session. Today we had a very nice trending day and retail traders could make good money based on their huge overnight buy position in F&O contracts. Support Zone in Nifty is shifted up. Resistance Levels became New Support Levels.
Highest open interest on call side at 18000 (Remained at same level)
Highest open interest on put side at 17500 (Shifted up from 17000 to 17500)
BANK NIFTY
Bank Nifty is up by 753 points. Extra ordinary performance by bulls lifted up Bank Nifty beyond the major resistance zone. It will be interesting to watch whether breakout will sustain amid global issues and after ECB hike by 75 to 100 basis points today or it will get back into previous trading range.
Highest open interest on call side at 41000 (Shifted up from 40000 to 41000)
Highest open interest on put side at 39000 (Shifted up from 39000 to 39500)
Will Break out in Nifty sustain amid global issues? Is Nifty getting ready to touch new life time high ?
Shall we continue look for buy on dips opportunities near major support levels?
My view is neutral with positive bias. However let us see how global markets reacts overnight after ECB hike. Please do review & analyze EOD closing data for preparing tomorrow's trade plans.
Please do share your comments. Have a very happy, healthy & profitable day ahead!

Nifty Intraday View 14th July 2022Long above 16052, Keep trailing profits on the drawn resistances, SL 15980
Short below 15985, Keep trailing profits on the drawn support, SL 16055
You can do scalping on the mentioned lines.

NIFTY- Possible Trade for Today -13-06-2022NIFTY could not hold on to the gains made last week and closed below 16100 yesterday. With the CPI data coming in a bit lower than the last period, there can be some sentiment positive in the market. However the fact that the CPI is still above 7 percent is a cause of worry for the markets, especially for the banking space. We may see an opening with a positive bias but need to be cautious about NIFTY if it is not able to sustain 16100 levels which is an important zone from an FnO data perspective. If NIFTY starts trading below 16100, we can see the index moving to lower levels.
Important levels for the day are mentioned below
Bullish Above 16120
Possible Upside Targets -16160/16210/16280
Bearish Below 16100
Possible Downside Targets - 16040/16000/15980/15940 levels.
Disclaimer:
The analysis provided is for educational purpose and the author does not assume any responsibility for the trades initiated based on the analysis. Consult your financial advisor before making any trades.

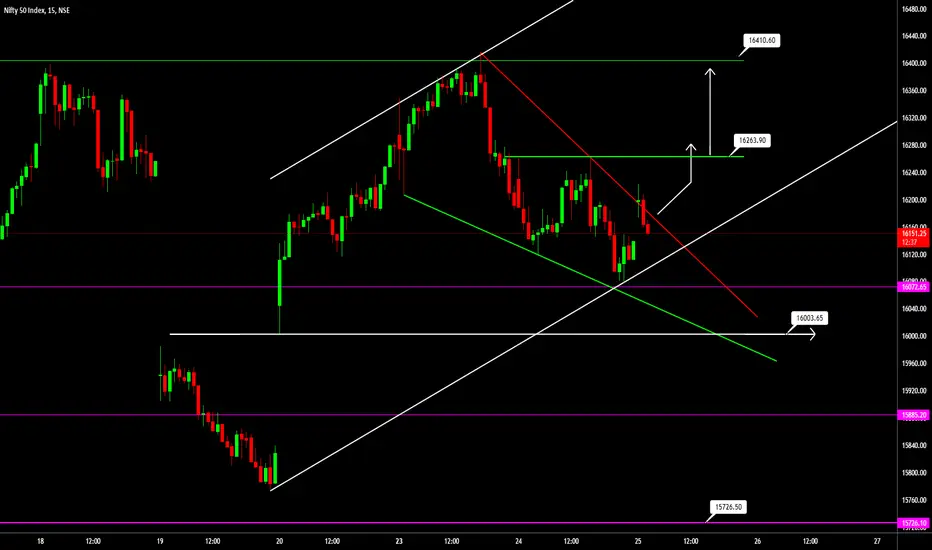
Nifty price action chart Pattern - Falling wedge
Pattern type - bullish
Immediate resistance 16260
Target after resistance - 16400
Important support - 16000
Simple Trade Setup | NIFTY | 21-04-2022 [INTRADAY]NSE:NIFTY
Observations:
1) On 15min time frame, if we ignore yesterday's last fall, then we can see today NIFTY was sustaining low of 18th April 2022 and made it as a good support. Range of 17065-17075 will work as immediate support.
Please refer below chart : 15min time frame.
Also on 15min time frame, we can see short term resistance trendline.
Please refer below chart : 15min time frame.
-------------------------------------
Trade Setup for 21-04-2022
1) Don't Jump in to trade at the beginning of the market. Let it get settle for 15-20min first and judge the price action.
2) Everything is mentioned on the chart. I hope it is easy to understand.
3) All the levels will work as support, resistance, entry and exit w.r.t price action near that level.
4) Avoid gap up or gap down chase. Wait and trade between levels.
Please refer below chart for levels.
Hope I made it easy to understand it.
Do comment your doubt or suggestion.
Note: Trade with Strict SL. It may or may not hit all the levels. So one can book profit / loss at respective level considering how price action works near that level.

Nifty Important levels for expiryIntraday strong support is places at 17722
Breaking below the support target will be 17650.
Closing below 17722 will be a sign of weakness and that will take nifty will 17370

nifty intraday 11 FEB 20221. Trade as per the levels
2,It will consolidate before making a big move
3. VIX IS DOWN AFTER RBI POLICY , KEEPING RATE CONNSTANT IS BOOST FOR MARKET IN NEAR TERM
+++++++++++++++++++++++++
LIKE IF YOU AGREE WITH THE ANALYSIS
+++++++++++++++++++++++++

NIFTYINTRADAY 10 Feb 20221. If open above the support zone will move up toward 17600
2. If it breaks below the Support zone , The it will bounce from the Support one as indicated
Trade as per levles
+++++++========
LIKE IF YOU AGREE
=============+++

NIFTY INTRADAY LEVELS 1. All depends on the opening if it opens near the support level will bounce back to reach target 3
============
Like if you agree
==============

NIFTY Intraday BUDGET Special 1 Feb 20221. Buy Call above the Zone
2. Sell Put Below the Zone
If vix goes down Do Short Strangle
AS per SGX Nifty it will open 50+ Gap Up

NIFTY INTRADAY 2 feb 20221. Massive PE writing at below 17700 .
2 Major support at 18000 , profit booking may come when it touches 18000 will bounc back after touching buying zone of 17700
Trade as per level shown in the chart
==============================
LIKE IF YOU AGREE
=============================

NIFTY INTRADAY 2 Feb 20221. Levels are marked , Nifty behaved exactly whats predicted since the budget was neither + nor -
2. If FII cmes for selling then it may consolidate a it
3. Lot of PE selling was done for weekly and Monthly options at 17500 Indicating , market is bullish biased for this month
4. NIFTY 50 stocks have shwon good results and will treflect in NIFTY index moves in coming period for the remaining month
====================
LIKE IF YOU AGREE
====================

NIFTY INTRADAY 110120221. NIFTY SGX trading at -50 points down , So NIFTY too will open at around 40 Points Gap Down adn WIll recover to the Resistance of the todays High .
2. If it Opens Gap Up will reach at Targe 15 above and some profit booking will be done and will fal back to the base level
3. Lot of PE writings done in this weeks expiry 17800 17900 , and CE writing was less as compared to Pe writing , Short covering was done in CEs , FOr this expiry the Range wil be 17900 to 18100 .
HDFC twins are seen in action so probability of Bull run is not ruled out , NIFTY ready to bounce back to Highs
-------------------------------------------
LIKE IF you AGree with the Analysis
-------------------------------------------

NIFTY INYTRADAY 10012022 1. Go long at the supports , and short on the resiaitce
2. NIFTY is bullis till it remains above 17500
3. Will open 60 Points Gap Up tomorrow , selling willbe seen adn will back to previous days high .
4. this week expiry lot od calls are sold at levels 18000 an 18200 levels so it will remain below that levels only
trade as per targets shown and entry and exit as per the levels at Lower TF
LIKE IF YOU AGREE if the TRADE GOES AS PLANNED .

NIFTY INTRADAY 100120221. Trade as per the levels ans the targets
2. NIFTY if Opens GAP up will move toward the 18000 Mark
3. NIFY will GAP up around 60 Points and will hower around 17900 , ANd will fall back o Target 13
4. 13th Week NIFTY xpiry lot of CE writing is being done at 18000 ans 18100 levels , week will not break 18000 levels
TRADE AS PER THE TARGET
LIKE IF YOU AGREE

NIFTY INTRADAY 070120221. MArker will trent in the Zone as shown by the Support and resistance zone
2. Selling was done by FII today if the selling is continued , Clear trend will come in the downward side
3. Lot of CE selling at the 18000 and above levels , till 13th January market will be a bit resistant to move up
4. IF DII is not buying then Clear down ward trend till the next Support level
------
TRADE IN THE ZONE , Short strangle at 9:20 exit at 1:30
-----
Long only on DIPS
Like if you agree

INTRADAY NIFTY 28.12.20211. NIFTY is bullish compared to Banknifty
2. SGX Nifty trading 100 Points above , so Gap up is expected by 80 points , Will see some selling at 17200 levels
3. Will bounce again to 17200 levels , Lot of Lon unwinding done at 17100 , 17200 and 17300 levels another major resistance at 17500
4. Trade as per the levels indicated n lower TF 3mnts and observe the chart in 5 mnts time frame .
5. trade based on confirmation candles
6. Buy At the money calls if trading this month with strict Stop Loss .
7. Like if You agree

Nifty intraday 30 December 20211. Selling pressure in last 30 minutes at the end
2.its respecting the level
3. Trade as per levels if its opens gap up as chance is less , it will head to target 2 . If breaks down will bounce from target 3
4. Tomorrow will b trending market , it will bounce from 17000 levels as huge demand coming up there.

NIFTY Intraday 16.12.20211. Expiry will be volatile , big move up an down
2. Can take benefit both ways , Observe the levels and keep target tight , trade in 3m Time frame , keep watching 5 min TF
3. So Far levels are damn accurate , Observe the Supply and demand Zone , which are in confluence with the NIfty 50 Big weitage stocks like reliance , HDFC twins
4. Volume profile supports the levels , Donot short if the level breaks , Fake Break up and Down , Take trade only after confirmation candle in 5 Mnts TF .
5. Enjoy , Like if You agree with the Levels and the Targets
