Nifty Intraday Trade Setup | 10th DecemberNifty opened with gap-down near our buy level 24640 but gave a sharp bounce towards 24705 and then started falling. Nifty broke our sell level 24640 and hit 1st target on sell side at 24590. After that it was trading in a range.
For tomorrow, we will look for the sell opportunity either from 24700 - 24690 or if breaks 24580 for the targets of 24530 and below marked level on the chart.
Expectations: Trending day
Intraday Levels:
Buy Above - Sell on rise
Sell Below - 24580
To motivate us, Please like the idea If you agree with the analysis.
Happy Trading!
InvestPro India
Niftyintradaysetup

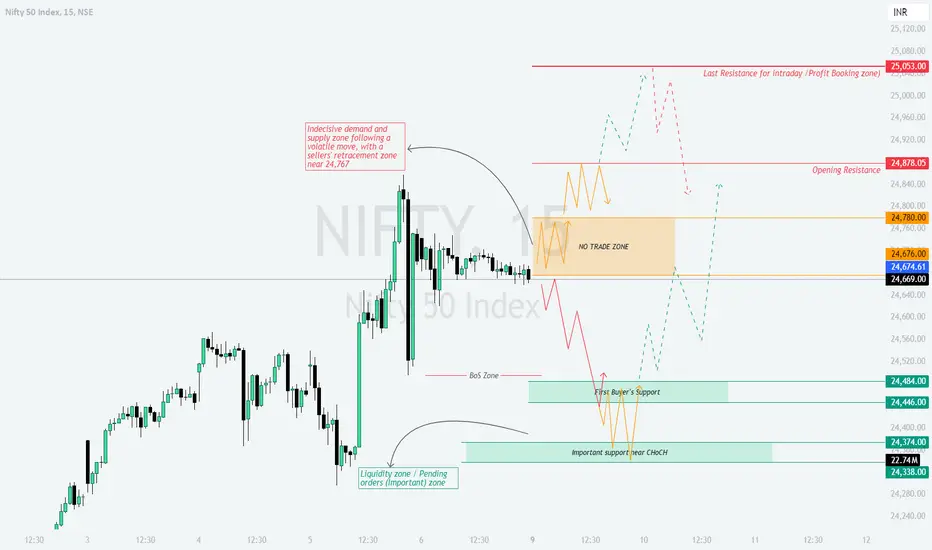
NIFTY : Trading Levels and Plan for 10-Dec-2024Trading Plan for Nifty 50 – 10-Dec-2024
Intro:
On the previous trading day, Nifty witnessed a mix of consolidation and momentum shifts. The Liquidity Zone around 24,767 acted as a crucial resistance level, while support near 24,541.65 helped stabilize the index. The chart shows a No Trade Zone between 24,626.60 and 24,652.35, indicating indecisiveness. A clear trend above or below this range will dictate the next move. Yellow signifies sideways movement, green shows bullish potential, and red highlights bearish breakdowns.
Opening Scenarios:
Gap-Up Opening (+100 Points):
If Nifty opens near 24,767 or higher, it will test the Opening Resistance . This level aligns with the Liquidity Zone observed previously.
Action Plan:
A breakout above 24,767 could push the index toward the Profit Booking Zone at 25,053. Enter long positions only if the first 15-minute candle closes above 24,767, with a stop loss at 24,652.35.
If rejection occurs at 24,767, expect a pullback toward 24,652.35. Short positions can be considered below 24,767, targeting the No Trade Zone.
Risk Management Tip: Avoid aggressive positions at key resistance zones. Use limited-risk strategies like debit spreads to manage exposure.
Flat Opening:
If Nifty opens near 24,652.35, it enters the No Trade Zone . This is a neutral region, and waiting for a clear breakout or breakdown is recommended.
Action Plan:
A breakout above 24,652.35 can lead to a bullish move toward 24,767. Initiate long positions with tight stop losses at 24,541.65.
A breakdown below 24,626.60 could trigger bearish momentum, targeting 24,541.65. Consider short trades in this scenario, with stop losses at 24,652.35.
Risk Management Tip: Avoid overtrading in consolidation zones. Use trailing stop losses to secure profits during volatile phases.
Gap-Down Opening (-100 Points or More):
If Nifty opens near 24,541.65 or lower, it will test the Opening Support or even the Buyer's Strong Support near 24,338.
Action Plan:
Watch for a bullish reversal near 24,338. If the price sustains above this level, initiate long positions targeting 24,541.65. Use 24,300 as a stop loss.
A breakdown below 24,338 could lead to a bearish continuation toward 24,200. Short positions can be initiated in such cases, with stop losses above 24,338.
Risk Management Tip: In gap-down scenarios, prioritize hedged strategies like iron condors to mitigate large swings.
Summary & Conclusion:
Resistance Levels: 24,767 , 25,053
Support Levels: 24,541.65 , 24,338 , 24,200
A breakout or breakdown from the No Trade Zone will set the directional bias for the day. Traders should remain cautious and avoid emotional trading.
Disclaimer:
This analysis is for educational purposes only. I am not a SEBI-registered analyst. Please consult your financial advisor or conduct independent research before trading.

Nifty Intraday Trade Setup | 9th DecemberNifty opened flat as because of RBI Policy we saw some volatility in first hour but then Nifty traded in a small range whole day and it was more of a options sellers day.
For tomorrow, if Nifty sustains above 24755 you can consider buying for 27800 and above marked level. On the other side, if Nifty sustains below 24640 you can consider taking a sell trade for the target of 24590 and below marked level on the chart.
Expectations: Volatile movement.
Intraday Levels:
Buy Above - 24755
Sell Below - 24640
To motivate us, Please like the idea If you agree with the analysis.
Happy Trading!
InvestPro India

Riding the Correction: Unlocking NIFTY’s Next Chapter!Dear Traders,
I hope this message finds you well in your trading endeavors and personal pursuits. I am excited to share a compelling opportunity with you through a new NIFTY analysis that sheds light on the continuation of the market shift. The recent upward movement & the following correction in the market have unfolded as anticipated. Over the past two months, my analysis has consistently pointed to an expected correction due to market overvaluation and distinct completion patterns.
Technical Analysis Overview:
There are three potential scenarios for the ongoing trend, ranked based on their likelihood of occurring.
Scenario I:
The move initiated from 20 MAR’23 – 27 SEPT’24 (16,828.35 – 26277.35) has spanned over 80 weeks (18M) and indicates a significant completion of wave patterns, suggesting an imminent correction. See the visual representation of the trend lines and corresponding fib retracement levels here:
The correlation between static supports can be observed around 23,893.70 and 21,181.45. This correction is expected to be visible within a 3-month timeframe.
Potential support levels include
S – I: 24,893 ~ 24,753 ~ 24,430 levels,
S – II: 24,050 ~24,000 levels and
S – III: 23,683 levels.
*These values are not actual but just levels
The correction might extend to deeper levels (22,664 & 21,550) as the market progresses.
Time resistances are anticipated on 09th OCT, 17th OCT, and 30th OCT for all probable scenarios.
---------------
Scenario II:
The move from 26 OCT’23 – 27 SEPT’24 (18,837.85 – 26,277.35) has completed mid-way and is expected to continue after this correction, potentially reaching unprecedented levels. Find the visual representation of this move with trend lines & fib retracements here:
The range of this move is limited to the monthly timeframe, indicating the completion of 1 year from the start of this sub-trend.
Potential support levels include,
S – I: 24,525 ~ 24,378 levels,
S – II: 23,900 ~ 23,893.70 levels and
S – III: 23,450 levels.
---------------
Scenario III:
The move from 04 JUN’24 – 27 SEPT’24 (21,121.45 – 26,277.35) has almost completed its half journey and is facing a correction before extending its uptrend by a few more waves. While this scenario has the lowest probability compared to the others, it is essential to consider its potential impact on the current trend.
The pictorial representation can be seen here:
Further details are not added as the market actions till now does not validate this probability.
---------------
Other Influential Factors:
Geo-political tensions and concerns regarding escalation have historically preceded corrections prior to the US presidential elections, indicating a prevailing bearish sentiment. Tensions in the Middle East have also contributed to the market plunge, albeit not solely responsible for it. Additionally, the FED's likely rate cuts have been influenced by the upcoming US elections, and SEBI's regulatory actions aim to curb over-optimism and maintain market neutrality.
Important Dates to Remember:
Mark your calendars for OCT 9th (RBI interest rate decision @ 10AM) and OCT 10th (US inflation reports).
---------------
Final Verdict:
While the scenarios are meticulously laid out, the selection of the valid scenario remains a work in progress. We are eagerly awaiting further cues from the market and will provide updates as they unfold. However, one thing remains certain – the current trend has reversed (at least for the mentioned time frames). Therefore, adopting a bearish stance could prove to be profitable.
---------------
Strategy:
Considering the current market conditions, adopting a bearish stance seems prudent, especially levels around 24,450 ~ 24,000 are to be tested. Keep a close watch on the market and stay informed for potential opportunities.
Disclaimer:
Before concluding, I must underscore that the insights shared are based on my analysis. It is imperative for you to conduct your research and, if necessary, consult with a financial advisor before making any trading decisions. The dynamic nature of financial markets necessitates that your strategies align with your financial goals and risk tolerance.
Fellow Traders,
Countless hours of dedication and effort have gone into creating this valuable analytical resource. If you find it useful, I humbly ask for your support by boosting the idea and following me (updates will be made via this post, new post & through minds) . Your comments and thoughts on this idea are highly valued, and I am committed to engaging with each one personally.
Thank you for investing your time in reading this article,
Your readership is greatly appreciated.
Wishing you profitable and joyful trading!!!

NIFTY : Trading Plan and Levels for 09-Dec-2024Nifty Trading Plan for 09-Dec-2024
Previous Day's Chart Pattern:
On 08-Dec-2024, Nifty displayed a range-bound movement within the No Trade Zone (24,674 – 24,780) , with intermittent attempts to break out on both sides. Buyers showed interest near the liquidity zone around 24,484 , but resistance at 24,780 capped upward momentum. The yellow zone signified consolidation, green highlighted bullish efforts, and red depicted bearish dominance. This creates a balanced yet cautious outlook for the next trading session.
Trading Plan for 09-Dec-2024:
Gap-Up Opening (+100 points or more above 24,780):
If Nifty opens above 24,780:
The immediate target will be 24,878 . A sustained move above this level may lead to a test of the profit-booking zone at 25,053 .
Enter long positions above 24,780 with a stop loss at 24,730 . Watch for rejection patterns near 24,878 for partial profit booking.
In case of a sharp reversal from 24,878, the index could retrace toward 24,780. Avoid aggressive longs if rejection occurs at higher levels.
Risk Management Tip: Opt for slightly OTM call options in small quantities. Use trailing stops to secure profits near resistance zones.
Flat Opening (Within the No Trade Zone 24,674 – 24,780):
A flat opening within the No Trade Zone requires patience:
If Nifty breaks above 24,780, initiate longs with targets of 24,878 and 25,053 .
On the downside, a fall below 24,674 can lead to a retest of the first buyer’s support at 24,484 . Initiate shorts cautiously with a stop loss above 24,700.
Risk Management Tip: Avoid overtrading in a sideways zone. Wait for clear breakouts before taking positions. Avoid weekly options in choppy zones.
Gap-Down Opening (-100 points or more below 24,674):
If Nifty opens below 24,674:
First support lies at 24,484 . If this zone holds, we may witness a reversal toward 24,674. Look for bullish candles to confirm long entries.
A break below 24,484 will likely test the liquidity zone at 24,446 or deeper support at 24,374 – 24,338 . Enter shorts below 24,484 with a stop loss near 24,500.
Risk Management Tip: For gap-down scenarios, consider put options with a spread strategy to limit losses. Avoid chasing price movements without confirmation.
Summary and Conclusion:
Nifty's key levels to monitor are 24,674 – 24,780 (No Trade Zone), 24,878 (Opening Resistance), and 25,053 (Profit Booking Zone).
The green zones represent bullish trends, yellow highlights consolidation, and red indicates bearish zones.
Focus on executing trades only after confirmation and manage risks with disciplined stop-loss placements.
Disclaimer: This analysis is for educational purposes only. I am not a SEBI-registered analyst. Traders are advised to do their research or consult a financial advisor before trading.
NIFTY Surges 900+ Points: Massive Gains Unlocked!NIFTY on the 1-hour timeframe displayed an exceptional bullish momentum, achieving 900+ points in profit so far. This long trade setup, captured using the Risological Swing Trading Indicator , has already hit TP1 and TP2, with the remaining targets likely to be reached soon.
NIFTY Key Levels:
TP1: 24204.50 ✅
TP2: 24786.30 ✅
TP3: 25368.10 🔄
TP4: 25727.65 🔄
NIFTY Technical Analysis:
The trade initiated at 23844.95 with a stop-loss at 23554.05, providing an excellent risk-to-reward ratio.
The price consistently respected the Risological trend line, confirming the strength of the uptrend. Both TP1 and TP2 have been achieved, showcasing the precision of the system.
The breakout above key resistance levels hints at a continuation towards the upper targets.
This setup reflects how effectively the Risological Swing Trading Indicator identifies profitable opportunities with minimal risk.
Namaste!

NIFTY : Trading Plan and levels for 06-Dec-2024Trading Plan for Nifty – 06-Dec-2024
Intro to the Previous Day's Chart Pattern:
On 05-Dec-2024, Nifty exhibited a volatile session but from the level (excatly where I mentioned in yesterday's trade pan) a significant rally towards the Wave C completion zone but a huge volatility in the prices seen in the last trading hour, . A sharp rejection from this zone reinforced bearish pressure, driving the index back to the Opening Support/Resistance zone at ₹24,697 . The chart highlighted three critical zones:
Red Trend: Bearish resistance around Wave C completion ( ₹25,050 ).
Yellow Trend: Sideways consolidation in the Opening Resistance Zone (₹24,882–₹24,697) .
Green Trend: Bullish momentum originating from the Initial Support Zone (₹24,412) .
Trading Plan for 06-Dec-2024
Gap Up Opening (+100 Points):
If Nifty opens above ₹24,882 , it will likely face immediate resistance at the Wave C completion zone (₹25,050) .
Action Plan:
Look for bearish rejections or reversal candlestick patterns near ₹25,050 . A failure to sustain above this level indicates a shorting opportunity, targeting ₹24,697 and ₹24,412 .
If Nifty sustains above ₹25,050 for at least two 15-minute candles, it signals a breakout. Go long, aiming for ₹25,300 and ₹25,450 .
Risk Management Tip:
Use a trailing stop-loss once the trade moves in your favor. For options, consider selling OTM puts below ₹24,700 to benefit from time decay.
Flat Opening (Near ₹24,697):
A flat opening will test the Opening Support/Resistance zone (₹24,697) .
Action Plan:
If Nifty holds above ₹24,697 , expect a bullish move towards ₹24,882 . Breakout above this level can lead to ₹25,050 .
Failure to sustain ₹24,697 could drag Nifty towards the Initial Support Zone (₹24,412) . Monitor for price rejection at ₹24,412 for potential long entries.
Risk Management Tip:
For flat openings, avoid aggressive entries. Let the first 30 minutes establish the trend, then act accordingly. Use spreads (e.g., bull call spreads) to cap your risk in options.
Gap Down Opening (-100 Points):
A gap-down opening near ₹24,412 or below will test key supports.
Action Plan:
If Nifty finds support at ₹24,412 , look for bullish price action. Enter long positions targeting ₹24,697 and ₹24,882 .
If Nifty breaks ₹24,412 , the next critical zone lies at ₹24,224–₹24,142 . Watch for signs of demand in this deep retracement zone for potential reversals.
Risk Management Tip:
In case of high volatility, trade with reduced position sizes. Use iron condors or straddles to take advantage of elevated option premiums during gap-down scenarios.
Summary and Conclusion:
Resistance Levels: ₹24,882, ₹25,050
Support Levels: ₹24,697, ₹24,412, ₹24,224
Key levels to watch: A breakout above ₹25,050 or a breakdown below ₹24,412 will dictate intraday momentum.
Use proper risk management strategies like trailing stop-losses and avoid over-leveraging in volatile markets.
Disclaimer:
The above analysis is for educational purposes only . I am not a SEBI-registered analyst. Please perform your own research or consult a financial advisor before making any trading decisions. Markets involve risk; trade responsibly.

Nifty Intraday Trade Setup | 5th DecemberNifty opened with a gap-up and gave more up-move in morning, our buy level triggered and Nifty went near 24575 but then we saw a knee jerk reaction and Nifty lost more than 200 points from day high so as per setup SL was taken out.
For tomorrow, if Nifty sustains above 24540 you can consider buying for 24600 and above marked level but keep small quantity on buying side. On the other side, if Nifty sustains below 24410 you can consider taking a sell trade for the target of 24360 and below marked level on the chart.
Expectations: Volatile movement.
Intraday Levels:
Buy Above - 24540
Sell Below - 24410
To motivate us, Please like the idea If you agree with the analysis.
Happy Trading!
InvestPro India

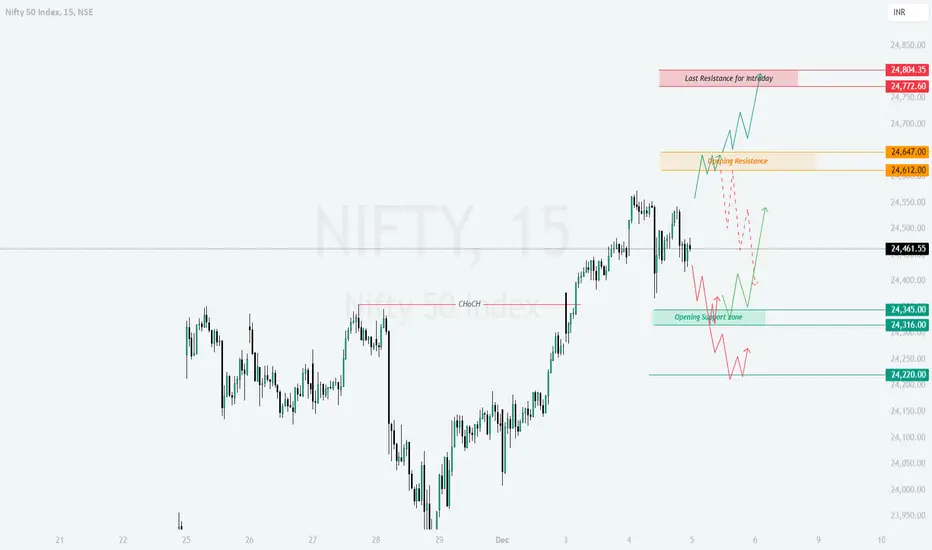
NIFTY : Trading levels and Plan for 05-Dec-2024Trading Plan for Nifty – 05-Dec-2024
Intro: Previous Day's Chart Pattern
Nifty on 04-Dec-2024 displayed mixed momentum, with a clear rejection from the upper resistance zone near ₹24,550 - 24,570. The Yellow trend highlighted a consolidation phase, the Green trend signaled bullish potential during upward retracements, and the Red trend indicated bearish pressure around resistance levels. Key levels such as ₹24,345 acted as support, while the intraday resistance remained prominent at ₹24,772.
Plan for Different Opening Scenarios:
1. Gap-Up Opening (Above ₹24,647 by 100+ points)
If Nifty opens significantly above ₹24,647:
Key Resistance Levels: ₹24,772 and ₹24,804 will be the major zones to watch for profit booking and potential reversals.
Action Plan: Allow the first 15–30 minutes for price discovery. Look for pullbacks near ₹24,647 for entry into long positions, with a stop loss below ₹24,612. Targets will be ₹24,772 and ₹24,804.
Failure to Sustain Above ₹24,647: If prices fail to hold above ₹24,647, avoid longs and observe price action near ₹24,612 for re-entry possibilities.
Risk Management: Tighten stop losses when approaching the resistance zone to secure profits. Avoid aggressive long positions unless the bullish trend sustains.
2. Flat Opening (Within ₹24,316 to ₹24,461)
If Nifty opens near its previous close:
Key Support and Resistance Levels: ₹24,345 serves as opening support, while ₹24,461 and ₹24,647 are the immediate resistance zones.
Action Plan: Wait for a clear breakout or breakdown.
Long positions can be initiated above ₹24,461, targeting ₹24,647 and ₹24,772, with a stop loss below ₹24,345.
Short positions should be considered if the index breaks below ₹24,345, targeting ₹24,316 and ₹24,220, with a stop loss above ₹24,461.
Risk Management: Trade cautiously within this range as the price may exhibit false breakouts. Use smaller position sizes during consolidation phases.
3. Gap-Down Opening (Below ₹24,345 by 100+ points)
If Nifty opens below ₹24,316:
Critical Support Levels: ₹24,220 will act as a critical support. Failure to sustain this level could lead to extended selling towards ₹24,100.
Action Plan:
Monitor the first 15–30 minutes. If prices rebound from ₹24,220, consider long positions for targets of ₹24,316 and ₹24,345, with a stop loss below ₹24,200.
If prices sustain below ₹24,220, initiate short positions for targets of ₹24,100 and ₹23,950, with a stop loss above ₹24,316.
Risk Management: Avoid catching falling prices; confirm reversals before entering trades. Keep positions light in volatile conditions.
Tips for Risk Management in Options Trading:
Time Decay Awareness: Avoid holding out-of-the-money options close to expiry as premium erosion accelerates.
Defined Risk Strategies: Use options spreads like bull call or bear put spreads to cap risk.
Avoid Overleveraging: Limit position sizes to avoid large losses during sudden market movements.
Monitor Volatility: Consider implied volatility before entering positions; high volatility may lead to expensive premiums.
Summary and Conclusion:
Nifty’s price action for 05-Dec-2024 revolves around key levels of ₹24,647 on the upside and ₹24,220 on the downside. Traders should focus on these zones for clear directional movements. Proper risk management and a disciplined approach are essential, especially during volatile market conditions. Always confirm the trend before initiating trades and avoid overexposure to options positions.
Disclaimer:
I am not a SEBI-registered analyst. This analysis is purely for educational purposes and should not be treated as financial advice. Consult your financial advisor before making trading decisions.
NIFTY Trade Setup for Wednesday (04-Dec-2024)NSE:NIFTY
Key Notes:
NIFTY FUTURES OI Data is Bullish Bias.
Previous day, Price closed at Demand (M15) zone.
Price is looking for Buy Stops at the premium zone.
There are cluster of Institutional bearish reference levels to hold the price.
If there is a gap up opening today, price must break the bearish reference level.
If price fails to break even with gap up, Price will like to take U turn from bearish levels.

Nifty Intraday Trade Setup | 3rd DecemberNifty opened flat and after initial decline towards 24000 odd levels, we saw good recovery from lower levels and Nifty made a high at 24301.
For tomorrow, buy Nifty if sustains above 24340 we expect to see an up-move towards 24390 and above levels. On the other side, if Nifty breaks 24200 on the downside we may see 24150 and lower levels marked the chart.
Expectations: Range-bound movement.
Intraday Levels:
Buy Above - 24340
Sell Below - 24200
To motivate us, Please like the idea If you agree with the analysis.
Happy Trading!
InvestPro India

Nifty Intraday Trade Setup | 4th DecemberNifty opened with a gap-up and after giving an opening fall towards 24280, we saw a bounce and Nifty made a high around 24480. As per trade setup posted for today, buy trade triggered above 24340 and both the targets 24390 and 24430 successfully done.
For tomorrow, 24500 - 24525 will be crucial zone to watch. Buy Nifty if sustains above 24540 we expect to see an up-move towards 24600 and above levels. On the other side, if Nifty breaks 24380 on the downside we may see 24330 and lower levels marked the chart.
Expectations: Volatile movement.
Intraday Levels:
Buy Above - 24540
Sell Below - 24380
To motivate us, Please like the idea If you agree with the analysis.
Happy Trading!
InvestPro India

NIFTY : Trading levels and Plan for 04-Dec-2024Before I begin, I kindly ask you to hit boost or like if you enjoy my analysis. Your support keeps me motivated to dedicate my time to creating these charts for you, completely free!
Nifty Trading Plan for 04-Dec-2024 📈
On the previous trading day, Nifty witnessed a significant rally towards the completion zone of Wave C, form the the Opening important range for buyer's and Sellers (mentioned in yesterday's Plan. For upcoming trading session, the structure also highlighted a Change of Character (ChoCH) near ₹24,483, which now acts as an opening support/resistance level. Key levels such as ₹24,355 (opening resistance) and ₹24,189 (last intraday/swing support) indicate pivotal areas for monitoring price action. Yellow indicates a sideways trend, green represents bullish momentum, and red marks bearish trends.
Here’s a structured trading plan for all opening scenarios:
Gap Up Opening (+100 points or more above ₹24,445)
Profit Booking Zone (₹24,650-₹24,692): A gap-up opening near or within this zone could face sideways consolidation or immediate rejection, as it aligns with the first target of Wave C completion.
Action Plan:
Entry: Short near ₹24,692 after observing bearish reversal patterns like shooting stars or bearish engulfing.
Target: ₹24,483 (opening support/resistance zone) and ₹24,413.
Stop Loss: Above ₹24,730 to avoid false breakout risks.
Breakout Potential Above ₹24,692: Sustained buying above ₹24,692 with strong momentum could trigger bullish continuation.
Action Plan:
Entry: Long above ₹24,692 after a 15-minute candle closes above this level.
Target: ₹24,800-₹24,850.
Stop Loss: Below ₹24,600 to safeguard against pullbacks.
Flat Opening (Near ₹24,445)
Opening Support/Resistance Zone (₹24,413-₹24,483): Flat openings indicate indecision. If Nifty sustains above ₹24,483, it may show bullish strength; otherwise, a fall back to ₹24,413 is likely.
Action Plan for Bullish Scenario:
Entry: Long above ₹24,483 with strong buying pressure.
Target: ₹24,650-₹24,692.
Stop Loss: Below ₹24,413 for risk management.
Action Plan for Bearish Scenario:
Entry: Short below ₹24,413 after confirming selling pressure.
Target: ₹24,355 and ₹24,300.
Stop Loss: Above ₹24,483 to limit losses.
Retracement Monitoring at ₹24,355: If the price consolidates near ₹24,355, observe breakout patterns for direction.
Gap Down Opening (-100 points or more below ₹24,445)
Testing Swing Support (₹24,189): A gap-down opening below ₹24,300 will test the last intraday/swing support around ₹24,189. Failure to hold this level may result in further downside momentum.
Action Plan:
Entry: Short below ₹24,189 after confirming a bearish breakdown.
Target: ₹24,100 and ₹24,050 (extended downside levels).
Stop Loss: Above ₹24,250 to reduce risk.
Reversal Potential at ₹24,189: Watch for bullish reversal signals such as hammer candles or bullish engulfing near ₹24,189.
Action Plan:
Entry: Long near ₹24,189 with a confirmed reversal signal.
Target: ₹24,300 and ₹24,355.
Stop Loss: Below ₹24,150 to manage risk.
Risk Management Tips for Options Trading
Trade with limited risk strategies like vertical spreads or butterfly spreads to minimize premium losses.
Monitor implied volatility and avoid buying options in high IV environments to prevent premium erosion.
Always hedge directional trades, especially near pivotal resistance or support zones.
Avoid over-trading; focus on quality setups rather than quantity.
Keep risk per trade within 1-2% of your capital to preserve equity.
Summary and Conclusion
Nifty is approaching critical zones, with ₹24,650-₹24,692 as the profit booking/supply area and ₹24,189 acting as the last swing support. Adherence to key levels and disciplined execution will be critical for navigating intraday moves. Let price action confirm the direction before entering trades.
Disclaimer:
I am not a SEBI-registered analyst. This analysis is for educational purposes only. Kindly perform your research or consult a financial advisor before making trading decisions.

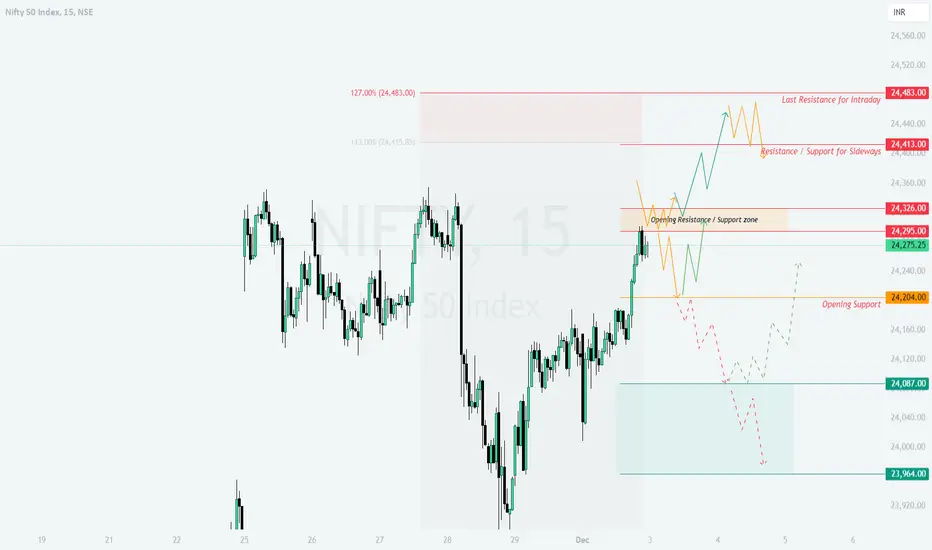
NIFTY : Levels and Plan for 03-Dec-2024Trading Plan for Nifty - 03-Dec-2024
Previous Day’s Chart Pattern Analysis:
On 02-Dec-2024, Nifty witnessed significant volatility after finding support from the mentioned support level and could manage to close near high. The index seeing resistance at 24,413, indicating profit booking near this level, while support was observed at 24,204, suggesting buyer accumulation. The yellow trend in the chart reflects sideways consolidation, green lines represent bullish moves, and red lines indicate bearish patterns. For today, the key zones from the chart will play a crucial role in determining market sentiment.
Opening Scenarios for 03-Dec-2024:
Scenario 1: Gap Up Opening (100+ Points Above 24,275)
If Nifty opens with a significant gap up above 24,375, monitor whether it sustains above the 24,413 Resistance/Support for Sideways.
- Action Plan:
- If the price stays above 24,413, look for bullish momentum towards the 24,483 Last Resistance for Intraday. Enter long positions with a target of 24,483, maintaining a stop-loss at 24,326.
- If Nifty fails to sustain above 24,413, a pullback towards 24,326 Opening Resistance/Support Zone is possible. Observe price action here before taking new trades.
- Risk Management Tip: Avoid chasing the market if the gap up is too steep, as it might lead to profit booking. Opt for spreads or hedge your positions with options.
Scenario 2: Flat Opening (Near 24,275)
In case of a flat opening around 24,275, focus on the Opening Resistance/Support Zone at 24,326.
- Action Plan:
- If Nifty breaks above 24,326 with strong volume, initiate long trades targeting 24,413, and then 24,483. Keep a stop-loss at 24,204 Opening Support.
- Conversely, if the price struggles to break 24,326 and slides below 24,275, a test of 24,204 is likely. In such a case, short positions can be considered with a target of 24,087, keeping a stop-loss at 24,326.
- Risk Management Tip: Allow the first 15-30 minutes for market stability to avoid false breakouts. Use options to trade breakouts conservatively.
Scenario 3: Gap Down Opening (100+ Points Below 24,275)
A gap-down opening below 24,175 would bring 24,087 Support Zone into focus.
- Action Plan:
- If the index holds above 24,087, expect a bounce towards 24,204 Opening Support. This could be an ideal point to go long with a stop-loss at 23,964.
- If Nifty breaches 24,087, further downside towards 23,964 is probable. In this case, short positions can be initiated with targets of 23,964, maintaining a stop-loss at 24,204.
- Risk Management Tip: In a bearish scenario, avoid aggressive trades and use protective puts to limit downside risk.
Risk Management Tips for Options Trading:/b]
Position size should be limited to 2% of your capital per trade.
Use options strategies like Iron Condors or Bull Put Spreads to manage risk in volatile conditions.
Always hedge directional trades with protective options to avoid heavy losses during sudden reversals.
Summary and Conclusion:
Today's trade revolves around key levels at 24,413, 24,326, and 24,204.
Bullish scenario: Sustained trades above 24,413 could lead to higher targets of 24,483.
Bearish scenario: A breakdown below 24,087 may open the door for further weakness towards 23,964.
Sideways scenario: Consolidation is likely between 24,204 and 24,326, requiring patience for a breakout.
Disclaimer:
I am not a SEBI-registered analyst. This analysis is for educational purposes only. Traders are advised to conduct their research or consult a financial advisor before making trading decisions.
The Nifty spot intraday forecast for December 03, 2024Nifty intraday trend for December 03, 2024 is bullish. Intraday Turning points are approximate. The price is not part of the forecast since calculations relate Time. Intraday levels may vary based on the price gaps on the either side.
Technical confirmation for entries and exits is a must and do not trade with stop-loss.
The information provided is only for the educational purposes.

Nifty Intraday Trade Setup | 2nd DecemberNifty opened with a gap-up on Friday, took support after filling gap and we seen a good rally.
For today, buy Nifty if sustains above 24190 we expect to see an up-move towards 24240 and above levels. On the other side, if Nifty breaks 24050 on the downside we may see 24000 and lower levels marked the chart.
Expectations: Volatile movement.
Intraday Levels:
Buy Above - 24190
Sell Below - 24050
To motivate us, Please like the idea If you agree with the analysis.
Happy Trading!
InvestPro India

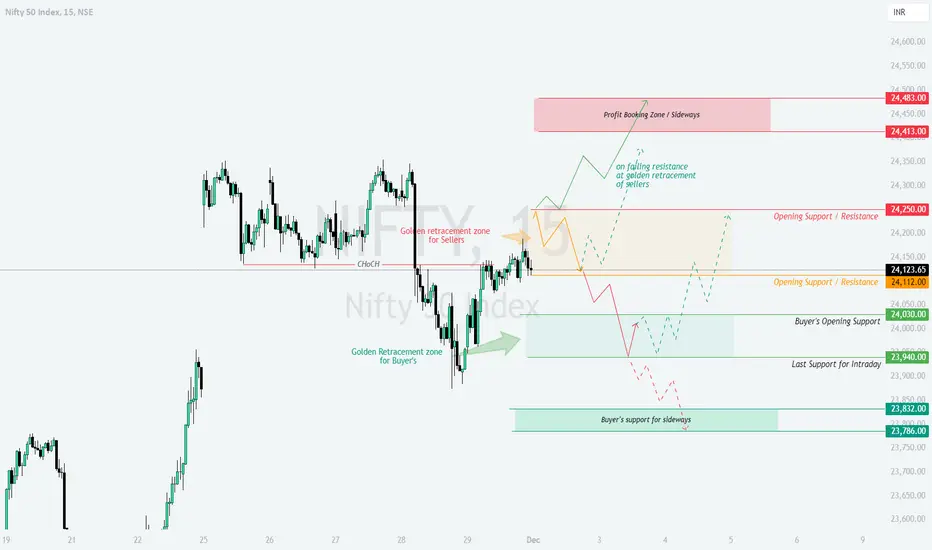
NIFTY : Levels and Plan for 02-Dec-2024Nifty 50 Trading Plan for 02-Dec-2024
On 01-Dec-2024, Nifty traded in a well-defined structure, oscillating between the Golden Retracement Zones for buyers and sellers. The market displayed a Change of Character (CHoCH), with price initially retesting the buyer's support zone near 23,786 before reversing toward the seller's resistance zone at 24,413. Key levels such as 24,250 and 24,112 acted as dynamic Opening Support/Resistance levels. The chart also highlighted a Yellow Zone for sideways movements, Green Zones for bullish trends, and Red Zones for bearish scenarios.
Detailed Trading Plan for 02-Dec-2024
Gap-Up Opening (Above 24,250, up to 100+ points)
If Nifty opens with a gap-up beyond 24,250, it will enter the Opening Resistance Zone. In this scenario:
Watch for rejection near 24,413 or higher. If rejection is confirmed, initiate short positions targeting 24,250 as the first support and 24,112 for extended profits.
For sustained bullishness, monitor an hourly candle close above 24,413. If this occurs, consider long positions with a target at the Profit Booking Zone around 24,483.
Avoid chasing trades immediately after the gap-up. Allow prices to stabilize for 15–30 minutes to validate the trend.
Flat Opening (Near 24,112 to 24,130 range)
In case of a flat opening, the Opening Support/Resistance at 24,112 will be critical:
If prices sustain above 24,112 with strong buying, consider initiating long positions, targeting 24,250 and 24,413.
If Nifty fails to hold 24,112, expect a test of 24,030 (Buyer's Opening Support) and potentially 23,940 (Last Support for Intraday).
Use tight stop losses when trading near the flat opening zone due to potential whipsaws.
Gap-Down Opening (Below 24,030, down to 100+ points)
A gap-down opening near or below 24,030 would signal bearish sentiment:
Observe buyer activity near 23,940. If support holds, initiate longs with targets of 24,030 and 24,112.
If 23,940 is breached, expect further downside toward 23,832 or even 23,786, the Buyer's Support for sideways action.
Manage risk effectively by waiting for hourly candle confirmation in case of volatile downward moves.
Risk Management Tips for Options Traders
Trade options with a defined stop loss and avoid overleveraging.
Use spreads (e.g., Bull Call Spread or Bear Put Spread) to reduce premium outflows and limit risk.
Monitor implied volatility (IV) levels, as sudden changes can impact option premiums significantly.
Summary and Conclusion
Nifty's key levels for 02-Dec-2024 include 24,413 (Profit Booking Zone), 24,250/24,112 (Critical Opening Support/Resistance), and 23,940/23,786 (Key Buyer Support Zones).
Focus on hourly candle confirmations for validating breakouts or breakdowns.
Stay cautious during initial market volatility and align trades with the prevailing trend as highlighted by the Yellow (sideways), Green (bullish), and Red (bearish) zones.
Disclaimer
I am not a SEBI-registered analyst. This analysis is for educational purposes only. Please consult your financial advisor before making trading decisions.
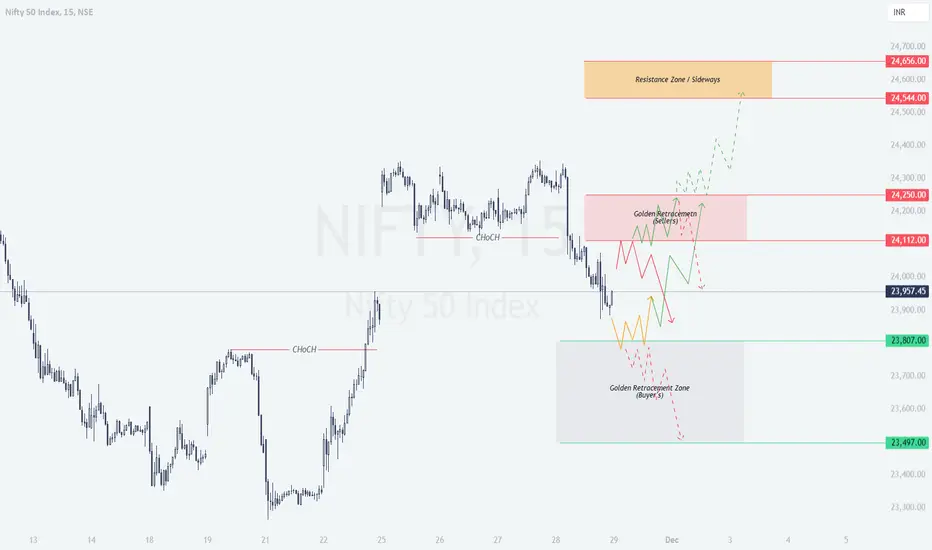
NIFTY : Analysis and Levels for 29-Nov-2024
On the previous trading day, Nifty exhibited a significant shift in momentum. A Change of Character (ChoCH) was observed, indicating a possible transition between bullish and bearish phases. The index traded near the golden retracement zones, showing both buyer and seller activity. The yellow trend represents a sideways market, green signals a bullish trend, and red indicates bearish sentiment.
After a consolidation, NIFTY has shown a significant trending move on last trading session, so most probably nifty can trade sideways or in a range on Friday, but based on the chart, I have prepared trading plans for three possible opening scenarios: Gap Up, Flat, and Gap Down openings.
Gap Up Opening (+100 points or more above ₹23,957)
Resistance Focus (₹24,112-₹24,250): If Nifty opens above ₹24,057, it will directly test the golden retracement zone for sellers. Watch for bearish patterns, such as shooting stars or evening stars, in this area. If selling pressure emerges, initiate a short position.
Action Plan:
Entry: Short below ₹24,200 after confirmation of rejection.
Target: ₹23,957 (the current close) and ₹23,807 (demand zone).
Stop Loss: Above ₹24,300 to manage risk.
Breakout Potential (₹24,250+): If Nifty breaks above ₹24,250 with strong volumes, it may head toward the Resistance Zone (₹24,544-₹24,656). Consider a long trade upon breakout confirmation.
Action Plan:
Entry: Long above ₹24,250 after a 15-minute candle close.
Target: ₹24,544 and ₹24,656.
Stop Loss: Below ₹24,100 to safeguard against false breakouts.
Flat Opening (Near ₹23,957)
Golden Retracement (₹24,112): If the market consolidates around ₹23,957, wait for a decisive move. The immediate focus will be the golden retracement zone at ₹24,112.
Action Plan:
Entry: Long above ₹24,112 if the price breaks this level with volume.
Target: ₹24,250 and ₹24,544.
Stop Loss: Below ₹23,900 to minimize risk.
Demand Zone (₹23,807): If Nifty fails to sustain above ₹23,957, it could test the Golden Retracement Zone for Buyers (₹23,807-₹23,497). Look for bullish reversal patterns in this zone for long entry.
Action Plan:
Entry: Long near ₹23,807 if bullish candles like hammers form.
Target: ₹23,957 and ₹24,112.
Stop Loss: Below ₹23,497 to protect against breakdowns.
Gap Down Opening (-100 points or more below ₹23,957)
Demand Zone Test (₹23,807-₹23,497): If Nifty gaps down and opens near or below ₹23,807, focus on the demand zone. This zone is critical for potential reversals.
Action Plan:
Entry: Long near ₹23,807-₹23,497 after confirming bullish patterns.
Target: ₹23,957 and ₹24,112.
Stop Loss: Below ₹23,497 to limit losses.
Breakdown Scenario (Below ₹23,497): A breakdown below ₹23,497 signals strong bearish momentum. Short positions can be taken if confirmed by volume and candle patterns.
Action Plan:
Entry: Short below ₹23,497 after confirmation.
Target: ₹23,300-₹23,100.
Stop Loss: Above ₹23,600 to avoid unnecessary risks.
Risk Management Tips for Options Trading
Limit your position size to ensure no single trade risks more than 2% of your capital.
Use hedging strategies, such as buying protective puts or selling covered calls, to offset potential losses.
Avoid trading during the first 15-30 minutes of market opening, as this period is highly volatile.
Monitor implied volatility (IV) for options and select contracts with reasonable premiums to avoid overpaying.
Summary and Conclusion
This trading plan is designed to cater to multiple scenarios, ensuring you're prepared regardless of the market's direction. The key lies in observing critical levels like ₹24,112 and ₹23,807 and waiting for confirmation before entering trades.
Remember: Yellow trends indicate sideways movement, green signals bullish momentum, and red shows bearish sentiment. Stick to the plan, respect stop losses, and prioritize capital preservation.
Disclaimer:
I am not a SEBI-registered analyst. This trading plan is for educational purposes only. Please consult with your financial advisor or conduct your analysis before making any trading decisions.
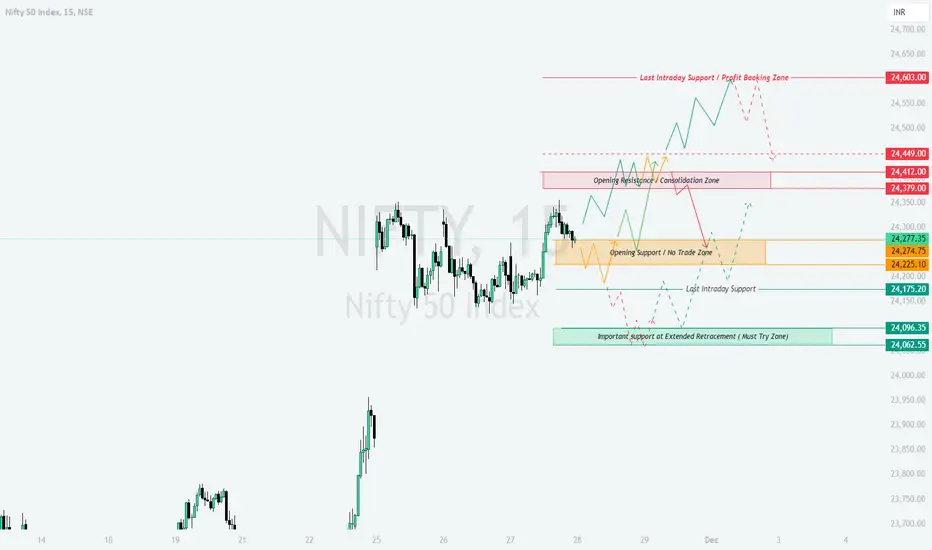
NIFTY : Trading levels and Plan for 28-Nov-2024Trading Plan for Nifty - 28th November 2024
Introduction:
On 27th November 2024, Nifty remained range-bound within the Opening Support / No Trade Zone (24,225–24,277), marked by the Yellow Trend, indicating indecision. Attempts to breach the "Opening Resistance Zone" near 24,379 were met with rejection, suggesting the need for stronger momentum to push prices higher. The Last Intraday Support (24,175) held well, showing signs of bullish activity, while the zone 24,096–24,062 acted as a critical reversal area for deeper corrections. The chart also highlights Green Zones for bullish trends and Red Zones for bearish momentum.
Plan for Different Opening Scenarios:
Gap-Up Opening (100+ Points Above Close):
If Nifty opens between 24,379–24,449, the focus should be on price action around the Opening Resistance / Consolidation Zone. A breakout above 24,449 could push Nifty towards the Last Intraday Resistance (24,603), which serves as a key Profit Booking Zone.
Rejection near 24,449 can result in a pullback to 24,379. A failure to hold this level could bring prices back to the "Opening Support Zone" (24,277–24,225).
If Nifty opens directly above 24,449, avoid immediate longs. Wait for retests or pullbacks to 24,449 or 24,379 before entering fresh positions.
Risk Management Tip: Use call spreads (e.g., 24,400 CE - 24,500 CE) to hedge risks and reduce premium exposure.
Flat Opening (Near Previous Close at 24,277):
A flat opening near 24,277 requires patience. Avoid trades within the "No Trade Zone" (24,225–24,277) to prevent getting trapped in sideways movements.
A sustained move above 24,277 can trigger long opportunities targeting 24,379 and 24,449. A breakout above 24,449 can lead to a bullish extension towards 24,603.
On the downside, if Nifty breaks below 24,225, short trades can be considered, targeting 24,175 and 24,096, provided there is an hourly close below these levels.
Risk Management Tip: Deploy straddles or strangles to benefit from potential volatility after a flat opening.
Gap-Down Opening (100+ Points Below Close):
A gap-down opening between 24,175–24,096 requires careful observation for bullish reversal patterns. A strong bounce from the Green Zone (24,096–24,062) can lead to a recovery targeting 24,225 and 24,277.
A breakdown below 24,062 could accelerate selling pressure towards 23,950, opening opportunities for put options or short trades.
Avoid chasing shorts near 24,096 unless there is decisive volume confirming bearish momentum.
Risk Management Tip: Use put spreads (e.g., 24,100 PE - 24,000 PE) to control risk and leverage potential downside moves.
Tips for Risk Management in Options Trading:
Avoid overleveraging in options trading, especially during volatile market conditions.
Use defined stop losses based on hourly candle closures to minimize losses.
Deploy hedging strategies (like spreads) to manage risk and reduce time decay.
Gradually scale into positions to confirm market direction before committing full capital.
Avoid trading against strong momentum; wait for confirmed levels to act.
Summary and Conclusion:
For 28th November 2024, the following levels are critical:
Bullish Trend: Sustained move above 24,277, with targets at 24,379, 24,449, and 24,603.
Bearish Trend: Breakdown below 24,225, with targets at 24,175, 24,096, and potentially lower.
Respect the "No Trade Zone" (24,225–24,277) to avoid false breakouts or choppy movements.
Patience and disciplined execution of the plan will help navigate the market confidently.
Disclaimer:
I am not a SEBI-registered analyst. The above analysis is for educational purposes only. Please conduct your own research or consult with a financial advisor before making trading decisions.
The Nifty Spot Intraday forecast for November 28, 2024Technically, on November 28, 2024, the Nifty spot intraday trend looks bearish. The Nifty spot resistance is at 24330 and support is at 24070 with a stop-loss at 24365. It is better to avoid intraday buy signals for tomorrow that is on November 28, 2024 and focus on the sell signals.

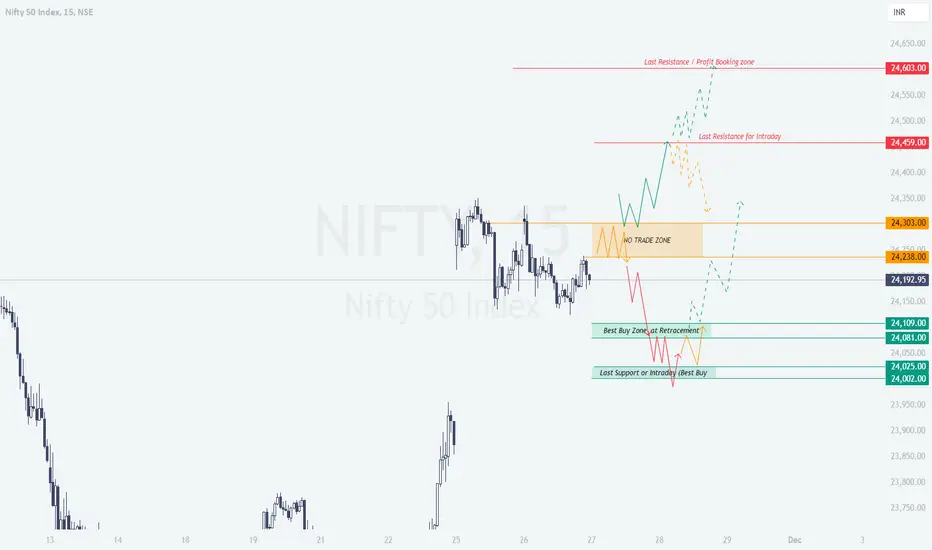
NIFTY : Trading Levels and Plan for 27-Nov-2024Trading Plan for Nifty - 27th November 2024
Introduction:
On 26th November 2024, Nifty traded within a defined range, with price movements largely respecting key levels. The chart revealed a consolidation phase highlighted by the "No Trade Zone" (Yellow Trend) around 24,238–24,303, indicating indecision among market participants. Bullish momentum (Green Trend) was observed above 24,459, while bearish pressure (Red Trend) dominated below 24,109. The market continues to exhibit structural clarity, with specific levels marking key support and resistance zones.
Plan for Different Opening Scenarios:
Gap-Up Opening (100+ Points Above Close):
If Nifty opens above 24,303 but below 24,459, wait for price action confirmation. A breakout above 24,459 with an hourly candle close suggests bullish momentum towards the Last Resistance for Intraday at 24,603, where profit booking is advisable.
If Nifty opens directly near or above 24,459, avoid immediate entry. Wait for retracement near 24,303–24,459 for a better risk-reward setup.
Monitor bearish rejection candles near 24,459, as this could signal a reversal towards the "No Trade Zone."
Risk Management Tip: For options, consider buying 24,600 CE with strict stop loss based on the hourly close below 24,303.
Flat Opening (Near Previous Close at 24,192):
If the market opens flat, avoid trading immediately within the No Trade Zone (24,238–24,303). Allow the price to break out or break down from this range.
A breakout above 24,303 targets 24,459, while a breakdown below 24,238 may lead to bearish momentum toward 24,109.
Monitor price reaction around 24,109 (Best Buy Zone), where retracement buyers might step in for a potential reversal.
Risk Management Tip: Utilize strategies like selling Iron Condors to capitalize on the consolidation phase while staying protected.
Gap-Down Opening (100+ Points Below Close):
If Nifty opens below 24,109, watch for support around 24,025–24,002. This zone represents the Last Support and is ideal for reversal trades if bullish price action appears.
Avoid chasing shorts immediately after a gap-down. A pullback towards 24,109 could offer safer entry points for bearish trades.
Below 24,002, bearish momentum strengthens, and traders can target 23,900 with appropriate position sizing.
Risk Management Tip: For bearish plays, consider buying 24,000 PE with a stop loss above 24,109.
Tips for Risk Management in Options Trading:
Avoid over-leveraging; use position sizing strategies to manage risk effectively.
Trade liquid contracts to minimize slippage.
Use hedging strategies like spreads to limit maximum losses.
Exit positions early if the market invalidates your levels, rather than holding onto losing trades.
Always base your entries on confirmations such as candlestick patterns, volume, or hourly close signals.
Summary and Conclusion:
For 27th November 2024, the chart suggests a clear game plan with pivotal levels to watch:
Bullish above 24,303, targeting 24,459 and 24,603.
Bearish below 24,109, targeting 24,025 and 24,002.
Avoid trading within the "No Trade Zone" (24,238–24,303) unless a decisive breakout occurs.
By adhering to the plan and practicing disciplined risk management, traders can navigate Nifty's movements effectively.
Disclaimer:
I am not a SEBI-registered analyst. The above analysis is for educational purposes only. Please conduct your research or consult with a financial advisor before taking any trades.
NIFTY : Trading Levels and Plan for 26-Nov-2024Trading Plan for NIFTY - 26th November 2024
Previous Day's Chart Analysis:
NIFTY showed a volatile movement after hitting day high at 25351, and closed near resistance zone that I had already highlighted in yesterdays plan. (highlighted in Yellow ) within the "No Trade Zone," respecting the resistance at 24,432 and support near 24,243 . Bullish momentum ( Green ) was seen towards the upper resistance zones, while bearish ( Red ) price action retraced near the support zones. The key levels of 24,609 (Profit Booking Zone) and 24,041 (Best Buy Zone at Retracement) acted as crucial points for traders.
Trading Plan for 26th November 2024:
Gap-Up Opening (Above 24,432):
If NIFTY opens with a Gap-Up above the critical resistance of 24,432 , it is crucial to observe the price behavior near 24,609 .
A sustained breakout above 24,609 indicates bullish continuation, targeting higher levels.
However, if rejection is observed near 24,609 , a pullback towards 24,432 is likely, which could act as support. Wait for a retest before entering long positions.
Flat Opening (Near 24,250):
A flat opening within the "No Trade Zone" requires patience.
A breakout above 24,325 (upper range of the zone) signals bullish momentum, with targets of 24,432 and beyond.
Conversely, a breakdown below 24,243 could lead to bearish moves targeting 24,105.95 and 24,041 . Avoid trading within the zone to minimize false signals.
Gap-Down Opening (Below 24,243):
A Gap-Down opening below 24,243 will turn the focus to key support levels.
If prices stabilize near 24,105.95 or 24,064.15 , look for signs of recovery to enter long trades.
Failure to hold these supports could trigger further bearish moves towards 23,899 . Aggressive traders can short with tight stop losses.
Risk Management Tips for Options Trading:
Avoid aggressive positions during the first 30 minutes of opening to let the trend settle.
Use strict stop losses and avoid over-leveraging.
Monitor the option's premium decay and implied volatility if the price remains within the "No Trade Zone."
Diversify between directional and non-directional strategies depending on market conditions.
Summary & Conclusion:
The key to successful trading lies in patience and discipline. Focus on the levels discussed ( 24,609 , 24,432 , 24,041 ) for directional trades, and avoid trading within the "No Trade Zone" ( 24,325–24,243 ) to prevent unnecessary risks. Both bullish ( Green ) and bearish ( Red ) scenarios offer opportunities, provided traders respect the levels and manage their risks effectively.
Disclaimer:
I am not a SEBI-registered analyst. The above analysis is for educational purposes only. Please consult with your financial advisor before making any trading decisions.

NIFTY : Trading Levels for 25-Nov-2024Nifty Trading Plan for 25-Nov-2024
Introduction:
In the previous session, Nifty displayed a recovery after testing lower support levels mentioned in plan and closed near day high, with buyers stepping in near the retracement zone ( Green ). The index faced resistance in the 23,873–23,920 range ( Yellow ), leading to sideways movement. For today, the market behavior will depend on how Nifty reacts to key levels, with breakout potential to 24,261 or breakdown risks toward 23,411 .
Trading Scenarios for 25-Nov-2024:
Gap-Up Opening (100+ points):
If Nifty opens above 23,920 , the focus will be on the immediate resistance level at 24,261 :
A breakout above 24,261 could lead to a strong bullish trend, with potential targets at 24,350 and beyond. Look for price consolidation above 24,261 before entering long trades.
Failure to sustain above 24,261 may result in a pullback toward 23,873 , offering a short-term reversal opportunity.
Wait for confirmation of the breakout before entering trades to avoid whipsaws.
Flat Opening:
A flat opening near 23,873 will bring the "Opening Support / Resistance Zone" ( 23,845–23,920 ) into focus:
A bullish breakout above 23,920 could target 24,261 as the next resistance.
A bearish breakdown below 23,845 may trigger selling pressure toward 23,759 or 23,684 .
Avoid trading within the range ( 23,845–23,920 ) until the trend direction becomes clear.
Gap-Down Opening (100+ points):
If Nifty opens below 23,759 , the immediate support lies at 23,684 , followed by 23,605 :
A breakdown below 23,605 may lead to accelerated selling, targeting 23,411 . Monitor volume and price action for confirmation.
A bounce from 23,684 or 23,605 could indicate a recovery, with potential upside back to 23,759 and 23,845 .
Be cautious, as a gap-down opening may lead to heightened volatility.
Risk Management Tips for Options Trading:
Use strike prices close to the spot price for better liquidity and responsiveness.
Implement strict stop-losses based on support and resistance zones.
Avoid trading during the initial 15-30 minutes after market opening, as volatility may produce false signals.
Limit your position size to manage risk effectively during uncertain market conditions.
Summary and Conclusion:
Nifty is at a critical juncture with key levels at 23,920 and 23,845 acting as immediate resistance and support. A breakout above 23,920 could drive bullish momentum, while a breakdown below 23,845 may lead to bearish continuation. Follow the trading plan and avoid impulsive trades. Always prioritize risk management to safeguard capital.
Disclaimer: I am not a SEBI-registered analyst. The analysis shared is for educational purposes only. Please consult your financial advisor before making any trading decisions.
