Nifty Analysis EOD – July 25, 2025 – Friday🟢 Nifty Analysis EOD – July 25, 2025 – Friday 🔴
"When the tide goes out, you discover who’s been swimming naked." – Warren Buffett
Nifty GapDowns Below Key Support and Slips Further
The market opened with a sharp GapDown, breaching the previous day's low and instantly shedding 150 points within the first hour. Nifty attempted to find footing near the crucial 21st July low zone of 24,850–24,880, but the support gave way, slipping an additional 50 points.
The day mostly drifted around these lower levels with bearish dominance. Though bulls made an effort to recover late in the session, it lacked strength. The index finally settled at 24,837, decisively closing below the 21st July low — signalling a deeper structural breakdown.
📉 Trend & Zone Update
Resistance Zone Shifted To: 25,144 ~ 25,155
Support Zone Shifted To: 24,729 ~ 24,755
📊 What If Plans – 28th July Outlook
🅰️ Plan A (Contra Long Setup)
If market opens inside the previous day range and finds support at 24,815 ~ 24,850
Then potential targets are 24,920, 24,965, and 25,020
🅱️ Plan B (Trend is Friend – Short Continuation)
If market opens inside range and faces resistance around 24,965 ~ 24,995
Then aim for 24,850, 24,815, 24,780, and 24,730
⏸️ On-the-Go Plan
If market Gaps Up/Down outside previous day’s range
Then wait for the Initial Balance (IB) to form and act based on structure and S/R levels.
🕯 Daily Time Frame Chart with Intraday Levels
🕯 Daily Candle Breakdown
Open: 25,010.35
High: 25,010.35
Low: 24,806.35
Close: 24,837.00
Candle Structure
Body: Strong red candle (−173.35 pts)
Upper Wick: None (open = high)
Lower Wick: 30.65 pts
Interpretation:
A textbook bearish Marubozu — shows sellers had control throughout.
Bears stepped in immediately from open, preventing any bullish response.
Minimal lower wick implies limited buyer defense even at the session low.
Key Insight:
Bears are in command; bulls must reclaim 25,000+ quickly to prevent further downside.
If 24,800–24,820 breaks, eyes shift to 24,700–24,750 zone next.
🛡 5 Min Intraday Chart
⚔️ Gladiator Strategy Update
ATR: 192.95
IB Range: 87.4 → Medium
Market Structure: Imbalanced
Trades Triggered:
🕙 10:10 AM – Short Entry → 🎯 Target Hit (1:2.4 R:R)
🧭 Support & Resistance Levels
Resistance Zones
24,920
24,965
24,995 ~ 25,018
25,080
25,140 ~ 25,155
Support Zones
24,780
24,755 ~ 24,729
24,640
📌 Final Thoughts
When strong candles appear back-to-back with no meaningful recovery in between, it’s not just a correction — it’s a statement. In this market phase, reacting to price structure rather than assumptions will keep you on the right side. Stay nimble, stay prepared.
✏️ Disclaimer
This is just my personal viewpoint. Always consult your financial advisor before taking any action.
Niftyintradaytradesetup

Nifty in Volatile Range#NIFTY FUT– 25,508.0
S1 – 25,395.0
S2 – 25,348.0
R1 – 25,658.0
R2 – 25,718.0
Doji formation has seen post Red
candle with inline volume,
indicates consolidation on daily
chart. Nifty has closed above 7, 14
and 21 DMA that seen at 25487,
25337 and 25222 levels. Nifty
future has resistance at 25658
levels while support seen at 25395
level..
More support and Resistance Show in chart...
All information Education Purpose only

Nifty Analysis EOD – June 20, 2025 – Friday🟢 Nifty Analysis EOD – June 20, 2025 – Friday 🔴
🚀 Bull Run Out of the Blue 🚀 – A Masterclass in Price Action
Nifty kicked off the session with a +56-point gap-up — surprising many, especially since Gift Nifty hinted flat to negative and yesterday’s close was weak. The real jolt came when, in the very first minute, price broke above the Previous Day High (PDH) and opened directly above the CPR zone — a rare occurrence when geopolitical tensions are peaking.
As I often say:
📌 “Market rarely follows the obvious. It thrives in the unexpected.”
Today was a textbook example of that.
Luckily, we were prepped. In yesterday’s note, I mentioned the bullish trigger above 24,862 — and right from the open, Nifty respected every level, offering "hope-on" and "hope-off" trades. What seemed like a 25K test turned into a blast to 25,136, with 100 points added in the last 30 minutes, leaving even seasoned traders awestruck.
The intraday close at 25,079.75 and the adjusted close at 25,112.40 — both above the 15th May closing levels — give a bullish vibe heading into the weekend. 🤞
💬 Personal Note:
Today was special — I sat with my elder daughter, helping her understand real-time market behavior. And what a day it was! From trend reversals, cup & handle, head & shoulders, wedges, shallow pullbacks, to aggressive one-way rallies — everything aligned perfectly to make this a live-action lesson in intraday trading.
🕯 5 Min Time Frame Chart with Levels
🕯 Daily Time Frame Chart
🕯 Daily Candle Breakdown
Open: 24,787.65
High: 25,136.20
Low: 24,783.65
Close: 25,112.40
Change: +319.15 (+1.29%)
📊 Candle Structure Breakdown
Real Body: 324.75 pts → ✅ Strong Green Candle
Upper Wick: 23.80 pts
Lower Wick: 4.00 pts
🔍 Interpretation
Opened flat and never looked back.
Minimal wicks = clear directional strength.
Buyers in full control from open to close.
🕯 Candle Type
📈 Bullish Marubozu-like — One of the strongest bullish signals. A powerful sign of trend continuation or breakout momentum.
📌 Key Insight
Today’s candle reinforces bullish strength.
Holding above 25,100 is key going forward.
A move above 25,136 could invite fresh upside targets — possibly 25,180+ and beyond.
🛡 5 Min Intraday Chart
⚔️ Gladiator Strategy Update
ATR: 251.32
IB Range: 116.6 → Medium IB
Market Structure: 📈 ImBalanced
Trades Triggered:
🔹 9:41 AM – Long Trade → Target Achieved (Trailing Exit, R:R 1:4.79)
🔹 12:18 PM – Short Contra Trade → Target Achieved (R:R 1:2)
🔹 1:07 PM – Long Trade → Target Achieved (Trailing Exit, R:R 1:2.62)
📌 Support & Resistance Zones
Resistance Levels
25,125 ~ 25,150
25,180 ~ 25,212
25,285
Support Levels
25,080 ~ 25,060
25,000 ~ 24,980
24,965
24,894 ~ 24,882
💭 Final Thoughts
The market surprised today — not just in movement but in clarity.The clean break, follow-through strength, and intraday structure hint at momentum continuation — but weekends can bring surprise news.
📌 Watch 25,100 as line in the sand on Monday.
🧠 “Markets are teachers. Today’s lesson? Expect the unexpected, but prepare like it’s already here.”
✏️ Disclaimer
This is just my personal viewpoint. Always consult your financial advisor before taking any action.

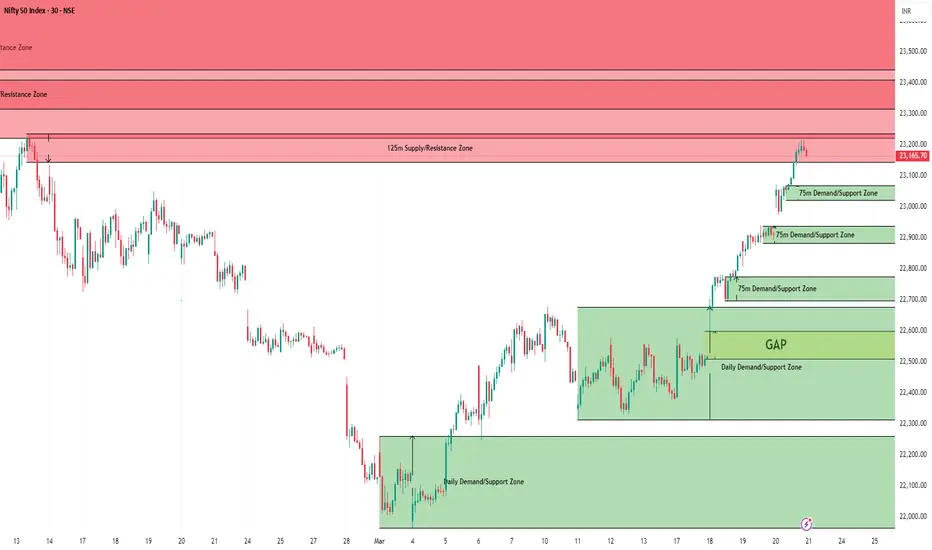
Nifty Intraday Support & Resistance Levels for 21.03.2025🔎 Market Recap:
On Thursday, Nifty opened gap-up, dipped to a low of 22,973.95, and surged to a high of 23,216.70, entering the 125m Supply Zone (23,144.05 - 23,235.50). It closed strong at 23,190.65, gaining 283 points from the previous close.
📉 Trend Analysis:
Weekly Trend (50 SMA): Negative
Daily Trend (50 SMA): Sideways
📉 Demand/Support Zones:
Near Demand/Support Zone (75m): 23,021.60 - 23,068.25
Far Demand/Support Zone (75m): 22,882.80 - 22,937.70
Far Demand/Support Zone (75m): 22,697.75 - 22,774.35
Far Demand/Support Zone (Daily): 22,314.70 - 22,676.75
Far Demand/Support Zone (Daily): 21,964.60 - 22,261.55
Far Support: 21,281.45 (Low of 4th June 2024)
Far Demand/Support Zone (Daily): 20,769.50 - 20,950.00
📈 Supply/Resistance Zones:
Near Supply/Resistance Zone (125m): 23,144.05 - 23,235.50 (Tested)
Near Supply/Resistance Zone (Weekly): 23,222 - 23,807.30
Far Supply/Resistance Zone (125m): 23,316.30 - 23,409.65 (Inside Weekly Supply)
Far Supply/Resistance Zone (Daily): 23,443.20 - 23,807.30 (Inside Weekly Supply)
Far Supply/Resistance Zone (Daily): 23,976 - 24,196.45
Far Supply/Resistance Zone (Daily): 24,601.75 - 24,781.25
📊 Outlook & Strategy:
Nifty continued its bullish momentum, respecting lower demand zones and pushing higher into the 125m Supply Zone.
🔹 Short-term Trend: Bullish but overbought
🔹 Key Watch: If Nifty sustains above 23,144, we could see an extension towards 23,443 - 23,807 in the coming sessions. However, profit booking is possible from these supply zones.
🔹 Caution: 23,222 - 23,807 (Weekly Supply Zone) could act as a strong resistance, leading to a pullback towards 23,021 - 22,882 if rejection is observed.
📢 Disclaimer:
This analysis is for educational and informational purposes only and should not be considered as financial advice. Trading and investing in the stock market involve risk, and past performance does not guarantee future results. Always conduct your own research and consult with a certified financial advisor before making any trading decisions. The author is not responsible for any financial losses incurred based on this analysis.
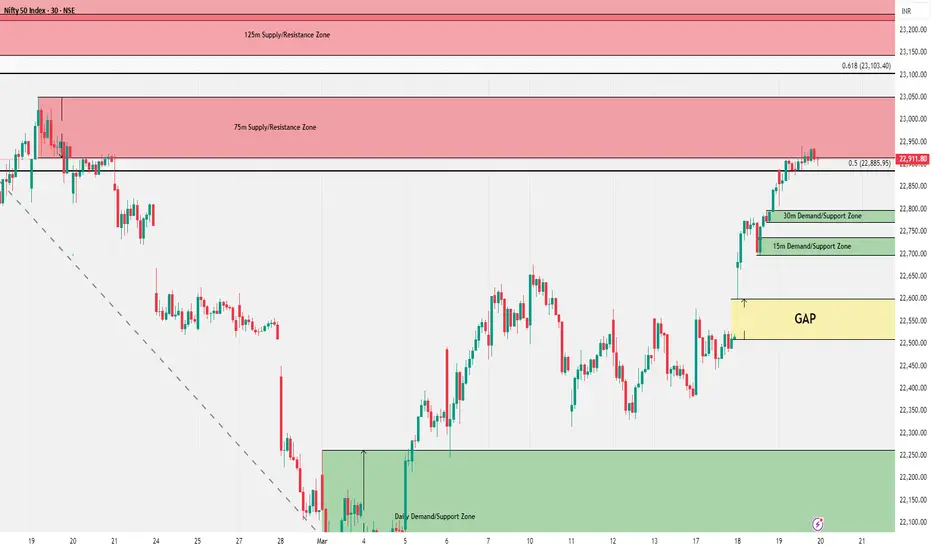
Nifty Intraday Support & Resistance Levels for 20.03.2025Market Recap:
On Wednesday, Nifty opened gap-up, dipped to a low of 22,807.95, and then rallied to a high of 22,940.70, entering the 75m Supply Zone (22,915.30 - 23,049.95). It closed at 22,907.60, gaining 73 points over the previous close. The Weekly Trend (50 SMA) remains negative, while the Daily Trend (50 SMA) has turned sideways from negative.
Demand/Support Zones
Near Demand/Support Zone (30m): 22,770.35 - 22,798.30
Near Demand/Support Zone (15m): 22,697.75 - 22,736.30
Far Demand/Support Zone (Daily): 21,964.60 - 22,261.55
Far Support: 21,281.45 (Low of 4th June 2024)
Far Demand/Support Zone (Daily): 20,769.50 - 20,950
Supply/Resistance Zones
Near Supply/Resistance Zone (75m): 22,915.30 - 23,049.95 (Tested)
Far Supply/Resistance Zone (125m): 23,144.05 - 23,235.50
Far Supply/Resistance Zone (125m): 23,316.30 - 23,409.65
Far Supply/Resistance Zone (Weekly): 23,222 - 23,807.30
Outlook
As expected, Nifty held the Daily Demand Zone and rallied past the 50% retracement level (22,885.95). The short-term trend remains bullish, and if the momentum sustains, Nifty could extend the rally towards 23,103 or even the Weekly Supply Zone at 23,222 in the coming days.
🚨 However, caution is advised as Nifty has touched the 75m Supply Zone today, which may lead to some selling pressure.
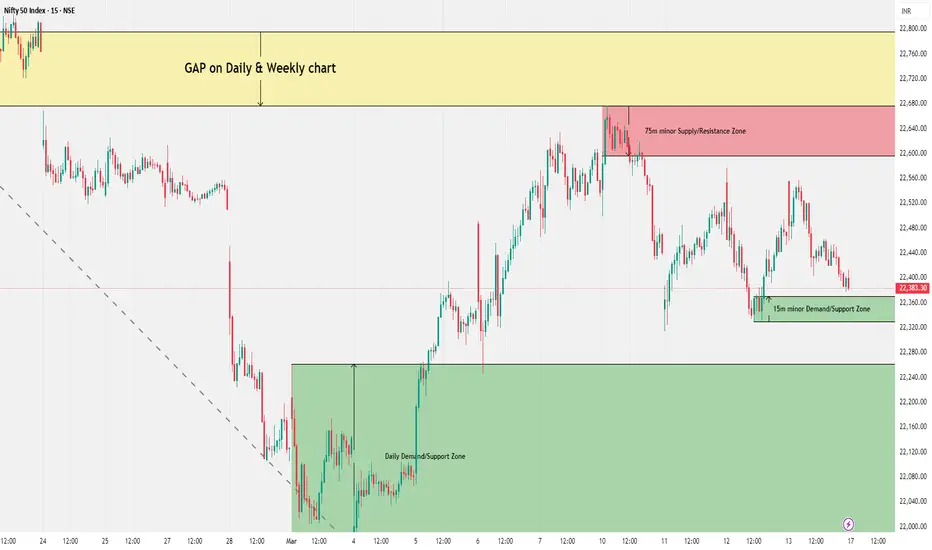
Nifty Intraday Support & Resistance Levels for 17.03.2025Thursday’s session saw Nifty opening with a gap-up, touching a high of 22,558.05, but it couldn’t sustain the momentum and dropped to a low of 22,377.35 by the end of the day. It closed at 22,397.20, losing 73 points from the previous close. Both the Weekly and Daily Trends (50 SMA) remain negative.
Demand/Support Zones
Near Minor Demand/Support Zone (15m): 22,329.55 - 22,370.20
Near Demand/Support Zone (Daily): 21,964.60 - 22,261.55
Far Support: 21,281.45 (Low of 4th June 2024)
Far Demand/Support Zone (Daily): 20,769.50 - 20,950
Supply/Resistance Zones
Near Minor Supply/Resistance Zone (75m): 22,595.90 - 22,676.75
Far Supply/Resistance Zone (Weekly): 23,222 - 23,807.30
Outlook
The outlook remains unchanged from the previous update—if the Daily Demand Zone support holds, we might see Nifty testing 22,885 or even 23,100 in the coming days. However, continued selling pressure at resistance zones could keep the index range-bound.
Nifty Intraday Support & Resistance Levels for 12.03.2025Tuesday’s session saw Nifty opening gap-down due to negative global cues, hitting a low of 22,314.70 before gradually recovering to a high of 22,522.10 by the end of the day. It closed at 22,497.90, gaining 37 points over the previous close. The Weekly Trend (50 SMA) remains negative, while the Daily Trend (50 SMA) has turned negative from oversold levels.
Demand/Support Zones
Near Demand/Support Zone (Daily): 21,964.60 - 22,261.55
Far Support: 21,281.45 (Low of 4th June 2024)
Far Demand/Support Zone (Daily): 20,769.50 - 20,950
Supply/Resistance Zones
Near Minor Supply/Resistance Zone (75m): 22,595.90 - 22,676.75
Far Supply/Resistance Zone (Weekly): 23,222 - 23,807.30
Outlook
After making a recent high of 22,676.75 on Monday, Nifty faced selling pressure but managed to recover from 22,314.70 on Tuesday, closing near 22,500, showing some bullish strength. However, the index has not retraced much from its fall between 23,807.30 to 21,964.60. If the Daily Demand Zone support holds, we could see a potential move towards 22,885 or even 23,100 in the coming days.

Nifty Intraday Support & Resistance Levels for 04.03.2025Monday’s session started on a positive note with a gap-up, as Nifty touched a high of 22,261.55 but failed to sustain and dropped to 22,004.70. It later recovered slightly, closing at 22,119.30, losing just 5 points from the previous close. The Weekly Trend (50 SMA) remains negative, while the Daily Trend (50 SMA) is now in oversold territory.
Demand/Support Zones
Near Support: 21,281.45 (Low of 4th June 2024)
Far Demand/Support Zone (Daily): 20,769.50 - 20,950
Supply/Resistance Zones
Near Supply/Resistance Zone (Daily): 22,508.40 - 22,625.30
Far Supply/Resistance Zone (Weekly): 22,720.30 - 23,049.95
Far Supply/Resistance Zone (Weekly): 23,222 - 23,807.30
Outlook
Nifty has declined 4,272 points (16%) in the last 5 months from its All-Time High of 26,277. The Daily 50 SMA is now oversold, which could lead to some buying near the 22,000 psychological level. However, multiple gaps and fresh supply zones on the Daily and Weekly charts indicate that any upside move is likely to face selling pressure at higher levels. A Sell-on-Rise strategy remains favorable until a strong reversal is confirmed.

Nifty Intraday Support & Resistance Levels for 25.02.2025Monday’s session saw Nifty opening with a massive gap-down of over 185 points at 22,609.35, attempting a minor recovery to 22,668.05, but eventually slipping to a low of 22,518.80. It closed at 22,553.35, losing 242 points from the previous close. Both the Weekly (50 SMA) and Daily Trend (50 SMA) are now negative, signaling weak market sentiment.
Demand/Support Zones
Near Support: 21,281.45 (Low of 4th June 2024)
Far Demand/Support Zone (Daily): 20,769.50 - 20,950
Supply/Resistance Zones
Near Minor Supply/Resistance Zone (5m): 22,605.55 - 22,617.80
Near Supply/Resistance Zone (15m): 22,763.20 - 22,812.20
Near Supply/Resistance Zone (75m): 23,176.15 - 23,235.50
Far Supply/Resistance Zone (75m): 23,248.45 - 23,301.75
Far Supply/Resistance Zone (125m): 23,316.30 - 23,409.65
Outlook
With Nifty breaking and closing below the key 22,600 - 22,800 support zone, bulls are struggling to hold ground. This breakdown confirms a Lower High - Lower Low pattern, reinforcing a Sell-on-Rise strategy. Unless Nifty reclaims 22,800 decisively, expect further downside pressure.

Nifty Intraday Support & Resistance Levels for 20.02.2025Wednesday’s session saw Nifty opening gap-down, touching a low of 22,814.85, before staging a sharp recovery to 23,049.95. However, selling pressure kicked in at higher levels, leading to a close at 22,932.90, down 12 points from the previous close. The Weekly and Daily Trends (50 SMA) remain sideways, reflecting market indecision.
Demand/Support Zones
Near Demand/Support Zone (Daily): 22,620.35 - 22,910.15 (Tested multiple times)
Far Support Level: 21,281.45 (Low of 4th June 2024)
Far Demand/Support Zone (Daily): 20,769.50 - 20,950
Supply/Resistance Zones
Near Supply/Resistance Zone (75m): 23,176.15 - 23,235.50
Far Supply/Resistance Zone (75m): 23,248.45 - 23,301.75
Far Supply/Resistance Zone (125m): 23,316.30 - 23,409.65
Far Supply/Resistance Zone (Daily): 23,443.20 - 23,807.30
Far Supply/Resistance Zone (Daily): 23,976 - 24,196.45
Far Supply/Resistance Zone (Weekly): 24,180.80 - 24,792.30
Outlook
For the last four trading sessions, Nifty has been finding support near 22,700 - 22,800, but struggling to close above 23,000. If it crosses 23,000 - 23,050, we may see an up move toward 23,200. However, multiple supply zones between 23,176 - 23,400 could act as resistance, leading to renewed selling pressure.

Nifty Intraday Support & Resistance Levels for 17.02.2025Friday’s session saw Nifty opening with a gap-up, but it failed to sustain the momentum. After hitting a high of 23,133.70, it reversed sharply, making a low of 22,774.85, testing the Daily Demand Zone (22,642.60 - 22,910.15) for the third time. A partial recovery followed, but Nifty still closed at 22,929.25, losing 102 points from the previous close. The Weekly Trend (50 SMA) and Daily Trend (50 SMA) remain sideways, signaling indecision.
Demand/Support Zones
Near Demand/Support Zone (Daily): 22,642.60 - 22,910.15 (Tested multiple times)
Far Support Level: 21,281.45 (Low of 4th June 2024)
Far Demand/Support Zone (Daily): 20,769.50 - 20,950
Supply/Resistance Zones
Near Supply/Resistance Zone (75m): 23,248.45 - 23,301.75
Near Supply/Resistance Zone (125m): 23,316.30 - 23,409.65
Near Supply/Resistance Zone (Daily): 23,443.20 - 23,807.30
Far Supply/Resistance Zone (Daily): 23,976 - 24,196.45
Far Supply/Resistance Zone (Weekly): 24,180.80 - 24,792.30
Outlook
Nifty’s repeated tests of the daily demand zone suggest that buyers are still active, but a break below 22,640 - 22,600 could trigger further downside toward 21,281. On the upside, a move above 23,250 - 23,300 could open the door for a push toward 23,800 - 24,000.

Nifty Intraday Support & Resistance Levels for 12.02.2025Tuesday’s session saw Nifty opening flat, made high of 23,390.05, it failed to hold near demand zones and plunged to a low of 22,986.65. It closed at 23,071.80, losing 310 points from the previous close. The Weekly and Daily Trends (50 SMA) remain sideways, indicating a lack of clear direction.
Demand/Support Zones
Near Demand/Support Zone (Daily): 22,642.60 - 22,910.15 (Tested)
Near Minor Demand/Support Zone (30m): 22,786.90 - 22,843.30
Far Support Level: 21,281.45 (Low of 4th June 2024)
Far Demand/Support Zone (Daily): 20,769.50 - 20,950
Supply/Resistance Zones
Near Supply/Resistance Zone (75m): 23,248.45 - 23,301.75
Near Supply/Resistance Zone (125m): 23,316.30 - 23,409.65
Near Supply/Resistance Zone (Daily): 23,443.20 - 23,807.30
Far Supply/Resistance Zone (Daily): 23,976 - 24,196.45
Far Supply/Resistance Zone (Weekly): 24,180.80 - 24,792.30
Outlook
Nifty’s sharp decline below 23,100 suggests increased bearish momentum. The next key support lies around 22,642 - 22,900, and a break below this zone could push it further down. On the upside, 23,250 - 23,400 remains the immediate resistance.

Nifty Intraday Support & Resistance Levels for 11.02.2025Monday’s session saw Nifty opening negative, making an initial high of 23,568.60, but gradually sliding down into the 75-minute Demand Zone (23,327 - 23,381.60). It touched a day low of 23,316.30 before closing at 23,381.60, marking a 178-point loss from the previous close. The Weekly and Daily Trends (50 SMA) remain sideways, indicating indecisiveness in the market.
Demand/Support Zones
Near Minor Demand/Support Zone (15m): 23,141 - 23,205.70
Far Demand/Support Zone (30m): 22,786.90 - 22,843.30
Far Demand/Support Zone (Daily): 21,791.95 - 22,910.15 (Tested)
Far Support Level: 21,281.45 (Low of 4th June 2024)
Far Demand/Support Zone (Daily): 20,769.50 - 20,950
Supply/Resistance Zones
Near Supply/Resistance Zone (15m): 23,557.80 - 23,591.25
Far Supply/Resistance Zone (15m): 23,644.10 - 23,694.50
Near Supply/Resistance Zone (Daily): 23,976 - 24,196.45
Far Supply/Resistance Zone (Daily): 24,601.75 - 24,782.15
Far Supply/Resistance Zone (Weekly): 24,180.80 - 24,792.30
Outlook
Nifty is struggling to hold key support levels, with the 23,300 zone acting as a crucial demand area. If this level fails, we could see a deeper correction towards 23,100 - 23,000. On the upside, 23,600 - 23,700 remains a strong resistance zone. A sustained move above 23,700 may indicate bullish momentum, while a break below 23,300 could trigger further downside.

Nifty Intraday Support & Resistance Levels for 10.02.2025Friday’s session was highly volatile, with Nifty opening positive and making an initial high of 23,683.90 before dropping to 23,493.60. It then rallied again to a day high of 23,694.50, entering the 5-minute Supply Zone, only to reverse sharply to a low of 23,443.20, taking support at the 15-minute Demand Zone. A partial recovery followed, and Nifty closed at 23,559.95, losing 43 points over the previous close. Both the Weekly & Daily Trends (50 SMA) remain sideways.
Demand/Support Zones
Near Demand/Support Zone (75m): 23,327 - 23,381.60
Far Minor Demand/Support Zone (15m): 23,141 - 23,205.70
Far Demand/Support Zone (30m): 22,786.90 - 22,843.30
Far Demand/Support Zone (Daily): 21,791.95 - 22,910.15 (Tested)
Far Support Level: 21,281.45 (Low of 4th June 2024)
Far Demand/Support Zone (Daily): 20,769.50 - 20,950
Supply/Resistance Zones
Near Supply/Resistance Zone (15m): 23,644.10 - 23,694.50
Near Supply/Resistance Zone (Daily): 23,976 - 24,196.45
Far Supply/Resistance Zone (Daily): 24,601.75 - 24,782.15
Far Supply/Resistance Zone (Weekly): 24,180.80 - 24,792.30
Outlook
Nifty remains range-bound, facing resistance near 23,700 while finding support at 23,450. A break above 23,700 may lead to a move towards 24,000, while failing to hold above 23,450 could trigger further downside. Stay cautious in this sideways market!

Nifty Intraday Support & Resistance Levels for 05.02.2025Tuesday’s session was strong for Nifty, as it opened with a 149-point gap-up, made a low of 23,423.15, and surged to a high of 23,762.75, entering deep into the Daily Supply Zone. It finally closed at 23,739.25, gaining 378 points over the previous close. The Weekly & Daily Trend (50 SMA) remain sideways.
Demand/Support Zones
Near Demand/Support Zone (75m): 23,327 - 23,381.60
Near Demand/Support Zone (15m): 23,141 - 23,205.70
Far Demand/Support Zone (30m): 22,786.90 - 22,843.30
Far Demand/Support Zone (Daily): 21,791.95 - 22,910.15 (Tested)
Far Support Level: 21,281.45 (Low of 4th June 2024)
Supply/Resistance Zones
Near Supply/Resistance Zone (Daily): 23,496.15 - 23,795.20 (Current price is deep inside the zone)
Near Supply/Resistance Zone (Daily): 23,976 - 24,196.45
Far Supply/Resistance Zone (Daily): 24,601.75 - 24,782.15
Far Supply/Resistance Zone (Weekly): 24,180.80 - 24,792.30
Outlook
After taking support at the Daily Demand Zone on 27th January, Nifty has already rallied 975 points (22,857 to 23,762). However, the Weekly & Daily Trend (50 SMA) remains sideways. To break the lower high - lower low structure, Nifty must sustain above 24,250 in the coming days.

Nifty Intraday Support & Resistance Levels for 03.02.2025Saturday’s special trading session saw Nifty opening flat and rallying to 23,632.45, just missing the 75m Supply/Resistance Zone (23,645.05 - 23,726.85) before facing selling pressure and dropping to a day low of 23,318.30. It later recovered slightly, closing at 23,482.15, down 26 points from the previous close. Both Weekly and Daily Trends (50 SMA) remain sideways, indicating a consolidating market.
Demand/Support Zones
Near Demand/Support Zone (15m): 23,141 - 23,205.70
Near Demand/Support Zone (30m): 22,786.90 - 22,843.30
Far Demand/Support Zone (Daily): 21,791.95 - 22,910.15 (Tested)
Far Support Level: 21,281.45 (Low from 4th June 2024)
Supply/Resistance Zones
Near Supply/Resistance Zone (Daily): 23,496.15 - 23,795.20 (Tested)
Far Supply/Resistance Zone (75m): 23,645.05 - 23,726.85
Far Supply/Resistance Zone (Daily): 23,976 - 24,196.45
Far Supply/Resistance Zone (Daily): 24,601.75 - 24,782.15
Far Supply/Resistance Zone (Weekly): 24,180.80 - 24,792.30
Outlook
With Nifty hovering near key resistance levels, watch for breakouts or reversals in the coming sessions. A move above the 75m Supply Zone (23,645 - 23,726) could trigger further upside, while a failure to sustain may lead to a retest of lower support zones.

Nifty Support & Resistance Levels for Budget Day 01.02.2025Friday’s session saw strong bullish momentum, with Nifty opening positive, making a day low of 23,277.40, and rallying to a high of 23,546.80 by the end of the session, entering the Daily Supply/Resistance Zone (23,496.15 - 23,795.20). The index closed at 23,508.40, gaining 259 points over the previous close. The Weekly and Daily Trends (50 SMA) are now sideways, indicating a potential shift in market sentiment.
Demand/Support Zones
Near Demand/Support Zone (15m): 23,141 - 23,205.70
Near Demand/Support Zone (30m): 22,786.90 - 22,843.30
Far Demand/Support Zone (Daily): 21,791.95 - 22,910.15 (Tested)
Far Support Level: 21,281.45 (Low from 4th June 2024)
Supply/Resistance Zones
Near Supply/Resistance Zone (Daily): 23,496.15 - 23,795.20
Far Supply/Resistance Zone (75m): 23,645.05 - 23,726.85
Far Supply/Resistance Zone (Daily): 23,976 - 24,196.45
Far Supply/Resistance Zone (Daily): 24,601.75 - 24,782.15
Far Supply/Resistance Zone (Weekly): 24,180.80 - 24,792.30
Outlook
With the Union Budget 2025 being presented in Parliament, expect heightened volatility during Saturday’s special trading session on 1st February. For intraday trading, focus on higher time frame zones (75m, Daily, Weekly) rather than lower time frames (30m, 15m, 5m) for better clarity and reduced noise.

Nifty Intraday Support & Resistance Levels for 31.01.2025Thursday’s session was marked by high volatility, with Nifty opening flat and making an initial low of 23,139.40. A strong rally took it to 23,311.15, where it entered the 15m Supply Zone (23,288.75 - 23,331.30), but selling pressure dragged it back to 23,141. The index then rebounded to a day high of 23,322.05 before closing at 23,249.50, gaining 86 points over the previous close. Both the Weekly Trend (50 SMA) is Negative to sideways and Daily Trend (50 SMA) remain Negative, indicating a cautious outlook.
Demand/Support Zones
Near Demand/Support Zone (15m): 23,141 - 23,205.70
Near Demand/Support Zone (30m): 22,786.90 - 22,843.30
Far Demand/Support Zone (Daily): 21,791.95 - 22,910.15
Far Support Level: 21,281.45 (Low from 4th June 2024)
Supply/Resistance Zones
Near Supply/Resistance Zone (5m): 23,349.20 - 23,421.25
Near Supply/Resistance Zone (Daily): 23,496.15 - 23,795.20
Far Supply/Resistance Zone (75m): 23,645.05 - 23,726.85
Far Supply/Resistance Zone (Daily): 23,976 - 24,196.45
Far Supply/Resistance Zone (Daily): 24,601.75 - 24,782.15
Far Supply/Resistance Zone (Weekly): 24,180.80 - 24,792.30
Outlook
Nifty is testing critical resistance levels while facing persistent selling pressure at higher zones. A break above 23,350 could push it towards 23,500+, while failure to hold support at 23,141 may lead to a retest of lower levels.

Nifty Intraday Support & Resistance Levels for 30.01.2025On Wednesday, Nifty opened with a gap-up, showing strong buying momentum. It made a low of 22,976.50, attempted a rally to 23,125.85, but faced resistance at the 5m Supply Zone (23,118.05 - 23,137.95), leading to a pullback near 22,984. However, buyers stepped in again, pushing Nifty to a high of 23,183.35 before closing at 23,163.10, gaining 205 points over the previous close. The Weekly Trend (50 SMA) and the Daily Trend (50 SMA) remains Negative, indicating caution despite the recovery.
Demand/Support Zones
Near Demand/Support Zone (30m): 22,786.90 - 22,843.30
Near Demand/Support Zone (Daily): 21,791.95 - 22,910.15
Far Support Level: 21,281.45 (Low from 4th June 2024)
Supply/Resistance Zones
Near Supply/Resistance Zone (15m): 23,288.75 - 23,331.30
Near Supply/Resistance Zone (5m): 23,349.20 - 23,421.25
Far Supply/Resistance Zone (Daily): 23,496.15 - 23,795.20
Far Supply/Resistance Zone (75m): 23,645.05 - 23,726.85
Far Supply/Resistance Zone (Daily): 23,976.00 - 24,196.45
Outlook
Nifty’s price action suggests strong resistance around 23,180 - 23,330, where supply zones could limit further upside. On the downside, support near 22,900 will be key for bulls. With the Budget 2025 nearing, markets could witness increased volatility in the upcoming sessions.

Nifty Intraday Trade Setup | 30th January 2025Nifty opened flat around 23030 and after forming a low at 22976 it went up and made high above 23180.
Tomorrow, buy Nifty if sustains above 23180 for the targets of 23240 and above marked level. On the other side, sell if Nifty sustains above 23080 for the targets of 23030 and above marked level on the chart.
Expectations: Volatile Day
Intraday Levels:
Buy Above - 23180
Sell Below - 23080
To motivate us, Please like the idea If you agree with the analysis.
Happy Trading!
InvestPro India

Nifty Intraday Support & Resistance Levels for 29.01.2025On Tuesday, Nifty opened with a gap-up, reflecting initial bullish sentiment. It made a low of 22,857.65 and rallied to a high of 23,137.95, breaking above the 15m Supply Zone. However, the momentum was short-lived as it retraced to close at 22,957.25, gaining 128 points over the previous close. Both the Weekly Trend (50 SMA) and Daily Trend (50 SMA) remain Negative.
Demand/Support Zones
Near Demand/Support Zone (30m): 22,786.90 - 22,843.30
Near Demand/Support Zone (Daily): 21,791.95 - 22,910.15
Far Support Level: 21,281.45 (low from 4th June 2024)
Supply/Resistance Zones
Near Supply/Resistance Zone (5m): 23,118.05 - 23,137.95
Near Supply/Resistance Zone (15m): 23,288.75 - 23,331.30
Near Supply/Resistance Zone (5m): 23,349.20 - 23,421.25
Far Supply/Resistance Zone (Daily): 23,496.15 - 23,795.20
Far Supply/Resistance Zone (75m): 23,645.05 - 23,726.85
Far Supply/Resistance Zone (Daily): 23,976 - 24,196.45
Far Supply/Resistance Zone (Daily): 24,601.75 - 24,782.15
Far Supply/Resistance Zone (Weekly): 24,180.80 - 24,792.30
Outlook
Nifty's failure to sustain above the 15m Supply Zone near 23,137.95 indicates ongoing selling pressure. The 22,800 - 23,000 range remains crucial as a support zone, while resistance near 23,300 - 23,500 could cap further upside. With both trends still Negative, coupled with looming market volatility ahead of Budget 2025, caution is key.

NIFTY : Trading Levels and Plan for 29-Jan-2025Here's your detailed trading plan for NIFTY on 29-Jan-2025, covering all possible opening scenarios with actionable insights.
📈 Scenario 1: Gap-Up Opening (200+ points above 23,088)
If Nifty opens with a gap-up, watch for resistance levels around 23,231-23,288:
🔹 Resistance Zone: 23,231-23,288 – Wait for confirmation before initiating a put option trade, targeting 23,088-23,024 if the level holds.
🔹 If 23,288 breaks with volume, expect a rally towards 23,350+. Look for call option trades with a strict stop-loss below 23,231.
🔹 Avoid overtrading near 23,088-23,231 without clear signals.
💡 Pro Tip: Wait for a 15-minute candle close above/below key levels for confirmation.
📉 Scenario 2: Flat Opening (Near 22,976-23,024)
A flat opening brings the market closer to the No Trade Zone (22,963-23,024). Breakout confirmation is crucial:
🔹 If Nifty sustains above 23,024, it may test 23,088 and later 23,231 – Ideal for call option trades.
🔹 If Nifty breaks 22,963, expect weakness towards 22,862-22,829. Look for put option trades with a stop-loss above 23,024.
💡 Pro Tip: A breakout from the No Trade Zone often leads to strong directional moves. Let the market decide the trend.
⬇️ Scenario 3: Gap-Down Opening (200+ points below 22,963)
A bearish gap-down will test buyer strength at crucial support zones:
🔹 Support Zone: 22,862-22,829 – Look for reversal signs. If the price holds, call options targeting 22,963-23,024 can be considered.
🔹 If 22,829 breaks decisively, expect further downside towards 22,637. Plan for put option trades, keeping SL above 22,862.
🔹 Be cautious near 22,637 as it might act as a reversal zone.
💡 Pro Tip: After a gap-down, monitor institutional activity before taking a trade. Avoid bottom fishing too early.
🛡️ Risk Management Tips for Options Trading
🔹 Use a fixed percentage of capital per trade (1-2%) to manage risk effectively.
🔹 Avoid chasing trades—let the market confirm levels.
🔹 Always use stop-loss and avoid averaging losing positions.
🔹 Prefer at-the-money (ATM) or slightly out-of-the-money (OTM) options for liquidity.
📊 Summary and Conclusion
🔹 Key Resistance Zones: 23,088, 23,231, 23,288
🔹 Key Support Zones: 22,963, 22,862, 22,829, 22,637
📌 Follow the plan, avoid emotional trading, and stick to defined levels. The market rewards discipline and patience!
⚠️ Disclaimer: I am not a SEBI-registered analyst. This plan is for educational purposes only. Trade responsibly. 😊

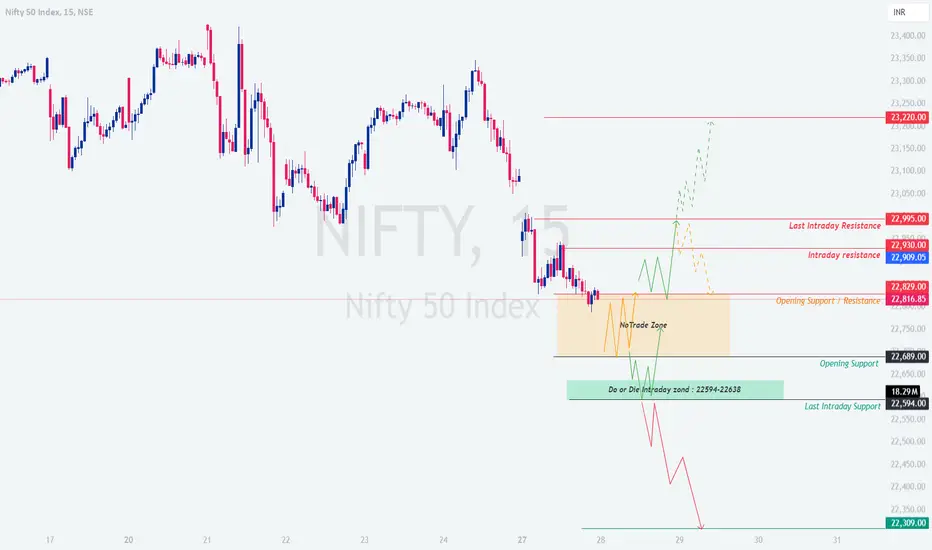
NIFTY : Trading levels and Plan for 28-Jan-2025📊 NIFTY Trading Plan for 28-Jan-2025 📊
📈 Key Levels to Watch:
Opening Support/Resistance Zone: 22,816-22,829
Intraday Resistance Zone: 22,909-22,930
Last Intraday Resistance Zone: 22,995
No Trade Zone: 22,816-22,829
Do or Die Intraday Zone: 22,594-22,638
Final Support Zone: 22,309
🌟 Scenario 1: Gap-Up Opening (100+ points above 22,909) 🌟
If NIFTY opens significantly above 22,909:
✅ Wait for Retest: Do not jump into trades immediately. Allow the index to retest the 22,909-22,930 zone for confirmation of strength.
📈 Action Plan: If the price holds above 22,930, initiate long trades targeting 22,995 (last resistance) and further extending to 23,220. Keep a stop-loss below 22,900.
🚫 Caution Zone: If resistance is observed near 22,995, consider profit booking or tightening stop-loss. Avoid fresh longs unless a breakout above 22,995 is confirmed.
💡 Pro Tip: Use bull call spreads to manage risk while capturing potential upside gains.
📉 Counter Strategy: If a bearish rejection candle forms near 22,995, short trades targeting 22,909 can be considered with a tight stop-loss.
🔄 Scenario 2: Flat Opening (Near 22,816) 🔄
If NIFTY opens flat or within the No Trade Zone: 22,816-22,829:
⚪ Avoid Immediate Trades: This range is indecisive. Wait for a breakout above 22,829 or a breakdown below 22,816.
🔼 Breakout Strategy: If the price breaks and sustains above 22,829, go long targeting 22,909-22,930. Use a stop-loss below 22,800.
🔽 Breakdown Strategy: If the price breaks below 22,816, initiate short trades targeting 22,689. Maintain a stop-loss above 22,850.
💡 Pro Tip: In a flat market, time decay in options can work against you. Use directional trades or hedged strategies.
🚦 Options Strategy: Consider a straddle or strangle strategy around the no-trade zone to capitalize on a potential breakout or breakdown.
🌧️ Scenario 3: Gap-Down Opening (100+ points below 22,816) 🌧️
If NIFTY opens below 22,816:
📉 Key Zone to Watch: The Do or Die Zone: 22,594-22,638 is critical. Look for bullish price action (e.g., hammer or bullish engulfing candles) for a potential reversal.
✅ Action Plan: If the price holds above 22,594, initiate long trades targeting 22,816. Use a stop-loss below 22,580.
🔥 Aggressive Selling Levels: If the price sustains below 22,594, further downside towards 22,309 is possible. Short trades can be initiated with strict risk management.
💡 Pro Tip: During gap-down scenarios, volatility spikes. Use hedging strategies (e.g., protective puts) to limit losses.
🚫 Avoid Overtrading: Gap-downs can lead to whipsaws. Wait for confirmation before entering trades.
🛡️ Risk Management Tips 💡:
🎯 Always follow your stop-loss and avoid emotional decisions.
🔥 Never risk more than 2% of your trading capital on a single trade.
🧘 Stay patient and disciplined. Avoid trading in the No Trade Zone .
📊 Utilize options strategies to hedge risk and protect your capital.
📝 Summary & Conclusion:
Key Zones to Monitor:
Resistance: 22,909-22,930 , 22,995 , and 23,220 .
Support: 22,816 , 22,689 , and 22,594-22,309 .
Gap-ups favor long trades above 22,909 , while gap-downs focus on supports like 22,594 .
Stick to your plan and avoid trades in the No Trade Zone unless a breakout or breakdown occurs.
⚠️ Disclaimer:
I am not a SEBI-registered analyst . All information shared is for educational purposes only. Please consult with a financial advisor before making any trading decisions.