NIFTY - Hajaari TradeHajaari Trade in Nifty seems active , provided it remains above 24K Level for next 3-4 Days!
NIFTY Staying above our Hajaari (Thousan Level) Trade since 31 Dec 2024.
Perfect Set up for our Hajaari Trade. Let's Ride the trend for 800 to 1k points from last Monthly Expiry.
Eyeing for 25500 Level with Bearish Expiry view this month End.
Let's see how market responds!
This Chart is for educational purpose & not a buy/sell recommendation.
Nifty may remain Bullish this month till 15 Jan, we may see a reversal basis Budget Movements. This is a Big yearly event which result in throwing Technical out of the window.
Technical Analysis may not work on Event Days like Budget, Election, Monitory Policy Review, RBI/ FED Interest Rat Decisions, etc. It is advised to check out Economic Calendar before planning a Trade!
Thank You
Niftyintradaytradesetup

NIFTY : Trading Levels and Plan for 02-Jan-2025WISH YOU ALL A VERY HAPPY NEW YEAR 2025
Introduction
In the previous trading session, we analyzed Nifty's key support and resistance levels for 1-Jan-2025. The chart provided a clear view of potential price movements under various scenarios. Yellow trends indicated sideways movement, green trends represented bullish behavior, and red trends highlighted bearish trends. Based on the chart for 1-Jan-2025, the actual price action unfolded as expected, staying within the highlighted zones and offering valuable insights for traders.
Trading Plan for 2-Jan-2025
Gap-Up Opening (100+ points)
If Nifty opens with a gap-up above 23,837 (No Trade Zone's upper band), observe the first 15-minute candle for confirmation.
If the price sustains above 23,837, expect a bullish trend targeting the Resistance Zone at 23,998 and further towards 24,068 for profit booking.
Place a stop loss just below 23,837 to manage risk and protect capital.
If the price fails to sustain above 23,837, expect a potential pullback towards the No Trade Zone. Monitor closely for any reversals within the zone.
Avoid taking positions inside the No Trade Zone unless a clear breakout or breakdown is visible.
Flat Opening
If Nifty opens flat near 23,758 (current market price), observe the price action for the first 15 minutes.
A breakout above 23,837 indicates bullish momentum towards 23,998 and 24,068, following the same plan as the gap-up scenario.
A breakdown below 23,699 (No Trade Zone's lower band) may signal a bearish move towards the Opening Support Zone at 23,617–23,640 and further towards 23,537.
Place a stop loss just above the breakdown or breakout levels to manage risk.
Wait for a confirmation candle (closing basis) before entering trades to avoid false signals.
Gap-Down Opening (100+ points)
If Nifty opens with a gap-down below 23,699, observe the first 15-minute candle for confirmation.
If the price sustains below 23,699, expect a bearish continuation targeting the Opening Support Zone at 23,617–23,640 and further towards the critical support at 23,537 (reversal zone).
Place a stop loss above 23,699 to manage risk.
If the price fails to sustain below 23,699, anticipate a pullback towards 23,837 and monitor for potential reversals in this region.
Avoid taking impulsive trades at open; let the levels guide your entries and exits.
Risk Management Tips for Options Trading
Always use stop losses to minimize potential losses.
Avoid over-leveraging; trade within your capital limits and risk tolerance.
Monitor implied volatility and time decay when trading options.
Diversify your trades to reduce exposure to single-direction risks.
Stick to your plan and avoid emotional decisions.
Summary and Conclusion
The trading plan for 2-Jan-2025 revolves around identifying key levels and understanding price behavior under various opening scenarios (Gap Up, Flat, or Gap Down). The No Trade Zone highlights areas to avoid unless clear trends are visible. Follow the highlighted trends: yellow for sideways, green for bullish, and red for bearish movements. By employing proper risk management and adhering to this plan, traders can make informed decisions and navigate market conditions effectively.
Disclaimer : I am not a SEBI-registered analyst. This trading plan is for educational purposes only and should not be construed as financial advice. Always conduct your research and consult a professional financial advisor before making trading decisions.

NIFTY : Trading levels and Plan for 31-Dec-2024[
Intro: Review of Previous Plan (30-Dec-2024)
Check plan V/s Actual performance for 30-Dec-2024 here : .
b]Trading Plan for Nifty - 31-Dec-2024
Key Color Codes in the Plan:
Yellow Trend: Sideways
Green Trend: Bullish
Red Trend: Bearish
Trading Plan for 31-Dec-2024:
Scenario 1: Gap-Up Opening (100+ points above 23,768)
If Nifty opens above 23,768 , the price is expected to move towards the Last Resistance for Intraday (23,866) .
Observe price action near 23,866 ; a breakout with sustained volume can trigger a long position targeting the Resistance for sideways at 24,010–24,058 .
If rejection occurs at 23,866 , look for bearish patterns (e.g., evening star or bearish engulfing). Initiate a short trade with a target of 23,737 .
Place a stop-loss 20 points beyond the breakout/rejection level to manage risk.
Scenario 2: Flat Opening (23,636–23,768)
A flat opening indicates indecision, and the market is likely to remain within the Yellow sideways zone .
Avoid trading aggressively in the Opening Resistance/Support zone (23,737–23,768) . Wait for a breakout above 23,768 to initiate long positions , targeting 23,866 .
On the downside, a breakdown below 23,636 could lead to bearish momentum towards the Buyer’s Support zone at 23,427 . Initiate short trades if the price sustains below 23,636 , with a stop-loss above 23,700 .
Scenario 3: Gap-Down Opening (100+ points below 23,604)
A gap-down below 23,604 could lead to bearish pressure, testing the Buyer’s Support zone at 23,427 .
Observe reversal patterns (e.g., hammer or bullish engulfing) at 23,427 . If confirmed, initiate long trades targeting 23,604 .
If the support fails, further bearish action could drive the price towards 23,320 . Enter short trades on confirmation of the breakdown, with a stop-loss above 23,500 .
Risk Management Tips for Options Trading:
Focus on in-the-money options to reduce the impact of time decay in sideways markets.
Use hedged strategies like iron condors to capitalize on low volatility within the sideways trend.
Always calculate your maximum loss and ensure it does not exceed 2% of your trading capital .
Avoid holding positions overnight without clear directional bias in the market.
Summary and Conclusion:
The key levels for tomorrow’s trading session are 23,768 on the upside and 23,427 on the downside.
Patience is critical within the Yellow sideways zone ; wait for clear breakouts or breakdowns.
Use defined stop-loss levels to minimize risk and maximize reward.
Disclaimer:
I am not a SEBI-registered analyst. This plan is for educational purposes only. Please conduct your analysis or consult with a financial advisor before making any trading decisions.

Nifty analysis for intraday 31/12/2024.Nifty has been trading in a range for the last 7 trading sessions.
Index is trading around the 20 EMA and giving sharp recovery on both sides.
Today it has closed below the moving averages. If the market starts trading below the No trading zone, bearish entry can be created for next support levels.
On the upper side the break out 23900 can clear the round number figure and test the Daily 20 EMA.
Wait for the price action near the levels before entering the trade.

NIFTY : Trading levels and Plan for 30-Dec-2024Trading Plan for Nifty - 30-Dec-2024
Intro: Review of Previous Plan (27-Dec-2024)
In the previous trading plan, we highlighted key zones, including the No Trade Zone (23,761–23,830) , the Last Intraday Resistance (24,010–24,058) , and the Buyer’s Support at 23,427 . As evident in the uploaded chart, Nifty traded within the highlighted zones, respecting the identified levels. The sideways momentum (Yellow trend) continued for most of the session, and an intraday attempt to breach the resistance zone was met with selling pressure, resulting in a close near the No Trade Zone.
Key Color Codes in the Plan:
Yellow Trend: Sideways
Green Trend: Bullish
Red Trend: Bearish
Trading Plan for 30-Dec-2024:
Scenario 1: Gap-Up Opening (100+ points above 23,930)
If Nifty opens above 23,930 , the market will be entering a bullish momentum zone. Look for a retest of the 24,010–24,058 resistance zone.
If the resistance is broken and sustained (hourly close above 24,058), initiate a long position targeting the retracement profit-booking resistance at 24,310 .
Place a stop-loss below the breakout level at 23,980 .
If the resistance holds, wait for rejection signals (red bearish candles) to initiate a short trade with a target of 23,761 .
Scenario 2: Flat Opening (23,800–23,850)
A flat opening indicates consolidation within the No Trade Zone (23,761–23,830) .
Avoid aggressive entries until Nifty decisively breaks out of the zone.
A breakout above 23,830 may signal a bullish move toward 24,010 . Look for confirmation with volume before entering a long trade .
On the downside, a breakdown below 23,761 could push Nifty toward 23,636 , the Last Intraday Support. In this case, initiate a short position with a stop-loss above 23,800 .
Scenario 3: Gap-Down Opening (100+ points below 23,730)
A gap-down opening below 23,730 signals bearish momentum. Observe if the price approaches the Buyer’s Support at 23,427 .
If the support holds, watch for reversal patterns (e.g., hammer or bullish engulfing) to initiate a long position targeting 23,761 .
A breakdown below 23,427 could extend the bearish trend to 23,300 or lower. Initiate a short trade if the breakdown is confirmed with a stop-loss above 23,500 .
Risk Management Tips for Options Trading:
Use defined risk strategies such as debit spreads to limit potential losses.
Avoid holding positions close to expiry to reduce time decay impact.
Trade with 1–2% of your total capital per trade to manage exposure.
Be cautious of high IV (Implied Volatility) spikes during gap openings.
Summary and Conclusion:
The plan emphasizes trading with confirmation signals and respecting highlighted zones.
Stay disciplined in the No Trade Zone to avoid unnecessary risks.
Follow the breakout and breakdown scenarios with defined stop-loss levels to maintain a favorable risk-reward ratio.
Disclaimer:
I am not a SEBI-registered analyst. All views are for educational purposes only. Traders are advised to do their analysis or consult with a financial advisor before making trading decisions.

#NIFTY50 TRADE SETUP - 30TH DECEMBER !!Nifty 50 Chart Analysis - 1 day Chart VieW
NSE:NIFTY
Nifty 50 Chart Analysis - Detailed Breakdown
Key Observations:
1. Current Price Zone: The Nifty index is trading at 23,832, with the price consolidating near recent lows.
2. Key Resistance Zones:
- 24,197.50: A significant resistance level, aligning with prior price rejections and a potential reversal area.
- 24,069.95: Intermediate resistance that needs to be cleared for bullish continuation.
3. Key Support Zones:
- 23,586.25: A strong support zone where buyers might step in, preventing further downside.
- 23,262.15: A deeper support level, marking the lower boundary of the recent bearish structure.
4. Market Sentiment: The price action indicates uncertainty, with equal probabilities of breakout above the resistance or breakdown below support.
Price Movement Summary:
- Upside Potential: A breakout above 24,197.50 could push the index towards 24,300+ levels. Thiszone has been highlighted in the chart as a bullish target area (marked in red box).
- Downside Risk: If the index breaks below 23,586.25, it could test 23,262.15 or lower, as depictedin the bearish target zone.
Trading Plan:
1. Bullish Plan:
- Entry: Above 24,069.95.
- Target 1: 24,197.50.
- Target 2: 24,300+.
- Stop-Loss: Below 23,961.55 (current pivot zone).
2. Bearish Plan:
- Entry: Below 23,586.25.
- Target 1: 23,536.60.
- Target 2: 23,262.15.
- Stop-Loss: Above 23,832.45.
Summary:
- Nifty is at a critical juncture, with immediate resistance at 24,069.95 and support at 23,586.25.
- Traders should wait for confirmation (breakout or breakdown) before initiating positions.
- Risk management is crucial as the index approaches year-end volatility.
Disclaimer:
This content is for educational purposes only. It is not a recommendation to buy or sell any financial instrument.The creator is not a SE-BI-registered advisor. Please consult with a certified professional before making investment decisions.

Nifty IntradayPure technical levels...
if the early morning momentum continues during after noon session can test 24100 levels
currently forming a flag with lesser volume and also forming a base
Momentum has to be there for upside

#NIFTY Intraday Support and Resistance Levels - 27/12/2024Gap up opening expected in nifty above the 23850 level. After opening if it's sustain above this level then expected movement upto 24000 level. 23700-23850 levels are the consolidation zone for nifty. Any major downside expected below the 23700 level.

NIFTY : Trading levels and plan for 27-Dec-2024Trading Plan for Nifty – 27-Dec-2024
Intro: Yesterday's Plan vs. Actual
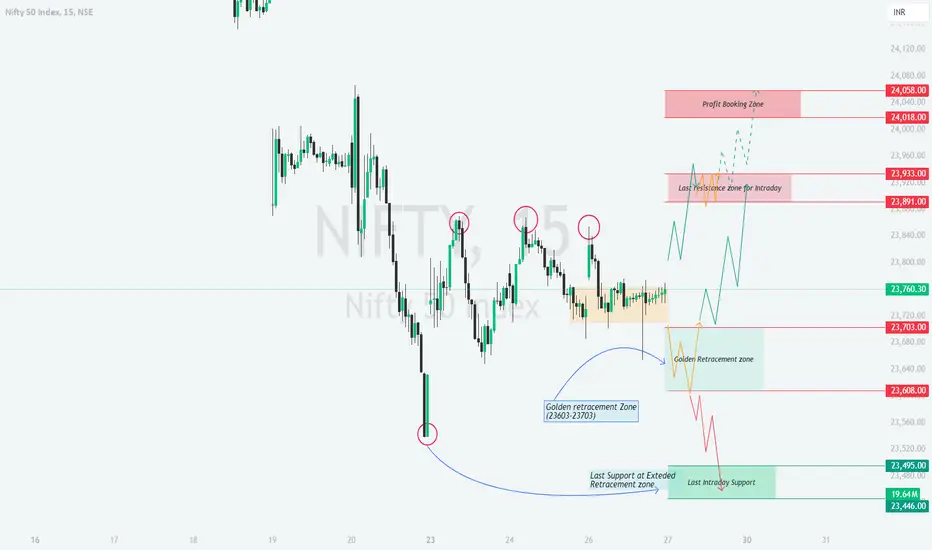
In yesterday’s plan, we highlighted the Golden Retracement Zone (23,603-23,703) and Last Resistance Zone for Intraday (23,891) as key levels to watch. The market opened near the consolidation zone (Yellow Trend), showing initial resistance at 23,760. The breakout towards 23,891 confirmed our bullish outlook (Green Trend), while reversals near the Profit Booking Zone (24,018-24,058) validated the importance of profit-taking zones.
Let’s now craft a detailed plan for 27-Dec-2024, keeping education and execution in focus.
Detailed Trading Plan for 27-Dec-2024
Gap-Up Opening (+100 points or more above 23,850):
A significant gap-up indicates strength, with Nifty likely testing the Last Resistance Zone for Intraday at 23,891. Sustained trading above 23,891 could lead to a rally toward the Profit Booking Zone at 24,018-24,058. This zone should be treated as a target for intraday traders, with potential reversals expected near 24,058.
⚠️ Action Plan: Avoid chasing the gap-up blindly. Instead, wait for a retest of 23,891 for long entries. If the price holds, aim for 24,018 and beyond.
💡 Risk Management Tip: Use trailing stop losses for options trades near resistance zones to lock in profits.
Flat Opening (Near 23,760-23,850):
A flat opening suggests indecision, with Nifty likely oscillating within the Golden Retracement Zone (23,703-23,760) initially. A breakout above 23,760 could push the index towards 23,891, while a breakdown below 23,703 may trigger bearish momentum towards 23,608.
⚠️ Action Plan: Observe the first 30 minutes of price action. For bullish trades, wait for confirmation of a breakout above 23,760. For bearish trades, look for rejection at 23,703, targeting lower levels.
💡 Risk Management Tip: Straddle or strangle strategies in options can be effective in such scenarios to capture directional moves.
Gap-Down Opening (-100 points or more below 23,760):
A gap-down opens the door for bearish moves, with immediate support at 23,608. A breakdown below 23,608 can extend the decline towards the Last Support Zone at Extended Retracement (23,495-23,446). Watch for potential reversals in this demand zone for contrarian trades.
⚠️ Action Plan: Avoid panic selling at the open. Look for a bounce at 23,495 for long entries with tight stop losses. If bearish momentum sustains below 23,495, initiate short trades targeting lower levels.
💡 Risk Management Tip: For bearish trades, consider bear put spreads to manage risk in a trending market.
Summary and Conclusion
For 27-Dec-2024, the key levels to watch are 23,891 on the upside and 23,608 on the downside. Gap-up openings need patience for confirmation, while flat and gap-down scenarios offer better risk-reward opportunities. Manage your trades with proper hedging strategies and always prioritize disciplined exits.
Nifty Intraday Trade Setup & technical analysis |27th Dec 2024Nifty moments for option and future trading 27/Dec/2024
follow us for more updates information.
message us for any stocks related information.

NIFTY : Trading Plan and level for 26-Dec-2024Trading Plan for 26-Dec-2024 – Nifty
Introduction:
The trading plan for 25-Dec-2024 focused on critical zones identified on the uploaded chart. The Golden Retracement Zone (23,603–23,703) acted as a pivot for potential reversals, while the Last Resistance Zone for Intraday (23,891–23,933) served as a crucial barrier. The day saw the index testing the retracement zone, respecting support at 23,608 , and moving toward the resistance zone. The Yellow, Green, and Red trends indicated sideways, bullish, and bearish phases, respectively, providing actionable setups. Today’s plan builds on these zones with further analysis.
Scenario 1: Gap-Up Opening (200+ Points)
If Nifty opens above 23,933 :
The index enters the Profit Booking Zone (24,043–24,078) , where strong resistance can lead to rejection ( Red Trend ). A sustained move above 24,078 could trigger bullish momentum ( Green Trend ).
Action Plan:
Look for shorting opportunities near 24,043 with a stop-loss above 24,100 , targeting 23,891 .
If prices sustain above 24,078 , initiate long positions with a target of 24,200+ .
If Nifty retraces back into the Last Resistance Zone (23,891–23,933) , watch for consolidation ( Yellow Trend ).
Scenario 2: Flat Opening (Within 50 Points)
If Nifty opens near 23,730–23,760 :
Monitor price action at the Retracement Zone (23,608–23,703) .
Action Plan:
A breakdown below 23,608 can trigger bearish momentum toward 23,495 . Initiate shorts with a stop-loss above 23,640 .
If prices sustain above 23,703 , look for long positions targeting 23,891 .
Wait for the first 15-30 minutes for market sentiment before initiating trades.
Scenario 3: Gap-Down Opening (200+ Points)
If Nifty opens near 23,495–23,446 :
The Last Intraday Support Zone is critical. Watch for bounce signals ( Green Trend ).
Action Plan:
Go long above 23,495 with a target of 23,608 . Use a stop-loss below 23,430 .
If prices break 23,446 decisively, expect bearish momentum toward lower levels ( Red Trend ). Avoid aggressive trades until a clear direction is established.
Risk Management Tips for Options Trading:
Always trade with defined targets and stop-losses .
Avoid over-leveraging, especially near resistance and support zones.
Allow the market to settle for at least 15-30 minutes before initiating trades.
Use trailing stop-losses to protect profits in trending moves.
Trade with appropriate position sizing to limit losses.
Summary and Conclusion:
Nifty is trading near critical levels, and today’s trading plan highlights actionable zones for all opening scenarios. Focus on Golden Retracement and Resistance Zones for probable reversals and momentum plays. Patience and disciplined execution with proper risk management are key to capitalizing on market opportunities.
Disclaimer:
I am not a SEBI-registered analyst. This trading plan is shared purely for educational purposes. Traders are advised to conduct their research or consult a financial advisor before taking any positions.

Nifty Intraday Trade Setup | 26th DecemberNifty opened flat around 23740 and after consolidating between 23740 and 23700 we saw an up move towards 23850 which acted as resistance again.
Tomorrow, Buy Nifty if sustains above 23770 for the targets of 23820 and above marked level. On the other side, Sell Nifty if sustains below 23680 for the targets of 23630 and below marked level on the chart.
Expectations: Volatile day
Intraday Levels:
Buy Above - 23770
Sell Below - 23680
To motivate us, Please like the idea If you agree with the analysis.
Happy Trading!
InvestPro India

NIFTY : Trading Levels and Plan for 24-Dec-2024Plan vs. Actual Performance (23-Dec-2024) - Nifty:
In today’s session, Nifty closely followed the levels and zones highlighted in the trading plan:
The index opened within the Opening Resistance/Support Zone (No Trade Zone) , as indicated in the plan. Price action remained muted here, showing indecision, aligning with the expectation of limited opportunities in this area.
The attempted move towards the Last Intraday Resistance Zone (23,953-24,058) failed, with prices reversing near resistance, confirming the bearish projection (red trend).
Later in the session, the index approached the Buyer’s Support Zone (23,194-23,281) . Prices showed signs of stabilization, reflecting the plan's green trend projection for potential reversal or support testing.
Key Takeaway: The plan accurately captured the market's reaction to critical levels, reinforcing the importance of patience in the No Trade Zone and the effectiveness of the support/resistance zones for planning entries.
This reflects the value of adhering to a well-defined trading framework.
This analysis will help us prepare for the trading day on 24-Dec-2024, considering different opening scenarios.
Trading Plan for 24-Dec-2024
Gap Up Opening (100+ points above 23,747.20)
If the market opens above 23,847.20, it indicates a strong bullish sentiment. The first resistance level to watch is 23,863.00 (Opening Resistance). If the price sustains above this level, the next target is 23,976.00 (Last Intraday Resistance for retracement).
In case the price breaks above 23,976.00, the next target is 24,009.00. A sustained move above this level can lead to the Profit Booking zone at 24,128.00.
If the price fails to sustain above 23,863.00, look for a potential retracement to 23,739.30. This could indicate a sideways trend (yellow line) or a bearish reversal (red line).
Flat Opening (around 23,747.20)
A flat opening suggests indecision in the market. The immediate level to watch is 23,739.30. If the price holds above this level, it could indicate a bullish trend (green line) towards 23,863.00.
If the price breaks below 23,739.30, the next support level is 23,611.00 (Opening Support Zone at Buyer’s retracement zone). A break below this level could lead to a bearish trend (red line) towards 23,547.00.
Monitor the price action around 23,863.00 for potential resistance. A break above this level could lead to targets of 23,976.00 and 24,009.00.
Gap Down Opening (100+ points below 23,747.20)
A gap down opening below 23,647.20 indicates bearish sentiment. The first support level to watch is 23,611.00. If the price holds above this level, it could indicate a potential retracement (yellow line) towards 23,739.30.
If the price breaks below 23,611.00, the next target is 23,547.00. A sustained move below this level could lead to further downside towards 23,447.00.
In case of a retracement, monitor the price action around 23,739.30 for potential resistance. A break above this level could lead to targets of 23,863.00 and 23,976.00.
Risk Management Tips for Options Trading
Always use stop-loss orders to limit potential losses.
Avoid over-leveraging your positions; trade within your risk tolerance.
Diversify your trades to spread risk across different assets or strategies.
Keep an eye on implied volatility, as it can significantly impact options pricing.
Regularly review and adjust your trading plan based on market conditions.
Summary and Conclusion
In summary, the trading plan for 24-Dec-2024 involves monitoring key support and resistance levels based on the opening scenario. By understanding the potential price movements and trends (yellow for sideways, green for bullish, and red for bearish), traders can make informed decisions. Always practice good risk management to protect your capital.
Disclaimer : I am not a SEBI registered analyst. This analysis is for educational purposes only and should not be considered as financial advice. Always do your own research before making any trading decisions.

Nifty Intraday Trade Setup | 24th DecemberNifty opened with gap-up around 23740 and after consolidating Nifty went up but 23870 acted as strong rejection zone and we saw more than 200 points fall from day high.
Tomorrow, Buy Nifty if sustains above 23830 for the targets of 23880 and above marked level. On the other side, Sell Nifty if sustains below 23650 for the targets of 23590 and below marked level on the chart.
Expectations: Volatile day
Intraday Levels:
Buy Above - 23830
Sell Below - 23650
To motivate us, Please like the idea If you agree with the analysis.
Happy Trading!
InvestPro India

#NIFTY Intraday Support and Resistance Levels - 23/12/2024Gap up opening expected in nifty near the 23800 level. After opening if nifty sustain above 23800 then possible upside movements upto 24000. 24000 level will act as a strong resistance zone for today's session. Possible nifty will reversal from this level upto the 23800 and this can be extend for further downside rally upto 23500 if nifty starts trading below 23750 level.

NIFTY : Trading Levels and Plan for 23-Dec-202423-Dec-2024 Nifty Trading Plan
On last trading session prices met with the targets on breaking and sustaining below mentioned levels and met with all targets on down side. Strategies for upcoming trading session
Color-Coding:
Yellow: Sideways trend. Green: Bullish trend. Red: Bearish trend.
23-Dec-2024 Trading Scenarios:
Gap Up Opening (+100 points):
If Nifty opens above 23,953 but below 24,058 , expect initial resistance at 24,058 . Watch for rejection signals such as bearish candlestick patterns (e.g., pin bars or engulfing) to initiate short trades targeting 23,747-23,603 .
However, if prices sustain above 24,058 , this zone transforms into support, indicating bullish sentiment. Enter long trades cautiously above 24,058 with targets of 24,300-24,400 . Use a stop loss at 23,950 .
Flat Opening:
A flat opening near 23,631-23,603 suggests the no-trade zone remains intact. Wait for a breakout above 23,747 or a breakdown below 23,603 .
Above 23,747: Long trades targeting 23,953-24,058 .
Below 23,603: Short trades targeting 23,281-23,194 . Use stop losses based on an hourly close for safer risk management.
Gap Down Opening (-100 points or more):
A gap down below 23,603 places immediate focus on the buyer’s support zone at 23,281-23,194 . Look for bullish reversal patterns (e.g., hammer or bullish engulfing) within this zone to initiate long trades.
If prices break below 23,194 , bearish momentum could intensify. Short trades targeting 23,000-22,850 become viable. Maintain a stop loss above 23,281 for these positions.
Risk Management Tips for Options Trading:
Use defined risk strategies like buying options or limited-loss spreads.
Avoid aggressive averaging when trades move against your position.
Always calculate the maximum loss potential before entering trades.
Exit positions if the index stays in the no-trade zone for extended periods.
Summary & Conclusion:
Nifty’s trading action on 23-Dec-2024 will revolve around the critical zones discussed. Respect the defined levels and avoid impulsive trades within the no-trade zone. Wait for confirmation before entering trades to maximize risk-reward ratios.
Disclaimer:
I am not a SEBI-registered analyst. This analysis is for educational purposes only. Please consult your financial advisor before making trading decisions.

Nifty Intraday Trade Setup | 23rd DecemberNifty opened with a minor gap-down and we saw a bounce in morning 23880 to 24000. Buy trade triggered as per trade setup posted for Friday but Nifty missed our 1st target of 24080 by 14 points and reversed.
For tomorrow, if Nifty sustains above 23650 we expect to see an up-move towards 23720 and above marked levels. On the other side, if Nifty breaks a crucial support 23500 on downside we may see 23430 and below marked levels on the chart.
Expectations: Volatile day
Intraday Levels:
Buy Above - 23650
Sell Below - 23500
To motivate us, Please like the idea If you agree with the analysis.
Happy Trading!
InvestPro India

Nifty Intraday Trade Setup | 20th DecemberNifty opened with a big gap-down near crucial support of 23850 today due to US markets and Nifty traded in a range created in first 15 mins.
For tomorrow, if Nifty sustains above 24000 we expect to see an upmove towards 24080 and above marked levels. On the other side, if Nifty breaks 23920 on downside we may see 23920 and below marked levels on the chart.
Expectations: Volatile day
Intraday Levels:
Buy Above - 24000
Sell Below - 23920
To motivate us, Please like the idea If you agree with the analysis.
Happy Trading!
InvestPro India

NIFTY - Trading Levels and Plan for 20-Dec-2024Intro: Review of the Previous Day’s Plan
After a gap down opening, prices saw first phase of recovery but could not find follow on support and traded in a narrow range. Let’s analyze potential scenarios for today.
Plan for Different Opening Scenarios
Gap-Up Opening (100+ points above 24,014):
A gap-up above 24,014 places Nifty near the resistance zone or even at 24,103. The focus should be on observing price action for either a breakout or a rejection.
Plan of Action:
If Nifty approaches 24,227, monitor for bearish rejection signals (e.g., shooting stars or bearish engulfing patterns) to initiate short positions targeting 24,103 and 24,014. Stop loss can be placed above 24,250.
For a breakout above 24,227, wait for an hourly close and consider long trades targeting 24,300 or higher. Stop loss below 24,200.
Key Tips: For options, consider OTM calls if a breakout occurs. Hedge positions using vertical spreads to cap potential losses.
Flat Opening (Within 23,900-24,000 range):
A flat opening keeps Nifty in the sideways zone (yellow trend). Early market movement will determine directionality.
Plan of Action:
If Nifty sustains above 24,014, initiate longs targeting 24,103 and 24,227. Use a stop loss below 23,950.
If the index slips below 23,900, initiate shorts targeting 23,877 and 23,748 with a stop loss above 24,000.
Key Tips: A flat opening is ideal for option straddle/strangle setups. Close positions if volatility contracts or movement remains indecisive.
Gap-Down Opening (100+ points below 23,877):
A gap-down below 23,877 places Nifty near support or bearish breakdown zones. Focus on price action around 23,748 or 23,604.
Plan of Action:
If Nifty holds above 23,748, initiate long positions with targets at 23,877 and 23,961, keeping a stop loss below 23,700.
A breakdown below 23,748 opens further downside to 23,604. Initiate shorts below this level with targets at 23,500 or lower. Stop loss above 23,800.
Key Tips: In gap-down scenarios, avoid panic trades. For options, consider OTM puts or debit spreads for bearish strategies.
Risk Management Tips for Options Trading:
Never risk more than 2% of your capital on a single trade.
Use a mix of ATM and OTM options for balanced risk/reward setups.
Exit trades promptly if Nifty deviates from the expected plan.
Monitor implied volatility; avoid overpaying for options in low-volatility environments.
Summary and Conclusion:
Today’s plan revolves around key levels: 24,014, 23,877, and 23,748. The yellow trend indicates likely consolidation, the green trend highlights bullish potential, and the red trend shows bearish zones. Patience and disciplined execution are crucial for trading success. Let price action confirm your trades before entering positions.
Disclaimer:
I am not a SEBI-registered analyst. This analysis is for educational purposes only. Please consult your financial advisor before making any trading decisions.

Nifty Bears Take Charge – 630 Points Secured with Risological InNifty 15-Minute timeframe short trade achieved a massive 630-point profit using the Risological Trading Indicator.
Trade Details:
Short Entry: 17th December, 9:15 AM
Exit: 19th December, 3:20 PM
Total Points Captured: 630 points
Technical Breakdown:
This trade showcased the precision and reliability of the Risological Trading Indicator. The indicator identified a clear bearish trend early on, enabling a high-conviction short entry. The trend persisted across multiple sessions, allowing the trade to capture a significant downward movement before closing out with a sizable profit.

NIFTY : Prediction levels and plan for 19-Dec-2024
Intro: Previous Day's Plan vs Actual
In yesterday's chart, we observed Nifty approaching a deep retracement zone (113% level at 24,098) and tested the must-try zone for Wave C completion as highlighted. Price remained within the "No Trade Zone" for a considerable period, indicating indecision and sideways movement. The sideways yellow trend was respected, with no significant breakout.
Now, for 19-Dec-2024, we will plan the opening scenarios considering a gap opening of 100+ points in either direction, or a flat opening, using key levels for action.
Trading Scenarios for 19-Dec-2024
Gap Up Opening (100+ points):
If Nifty opens above the Opening Resistance for Retracement at 24,359, this signals initial strength.
- Monitor the first 30 minutes for price action confirmation. If Nifty sustains above 24,359, we may see a move towards the Last Intraday Resistance at 24,488 (red level).
- Aggressive traders can look for long opportunities with a stop loss placed at 24,227 (blue level) on an hourly candle-close basis.
- However, failure to sustain above 24,359 can lead to a retracement back towards the No Trade Zone (24,169).
- Action Plan:
- If the price closes an hourly candle above **24,359**, initiate longs with **targets** at **24,488**.
- If it fails to hold above, avoid fresh trades and wait for price to return to the retracement zone.
Flat Opening:
If Nifty opens near the No Trade Zone (24,169 - 24,227), caution is required. A sideways price action is likely within this range.
- Price needs to break out from this "No Trade Zone" to give clear direction.
- Upside breakout above 24,227 could lead to a retracement test towards 24,359.
- Downside breakdown below 24,169 can trigger a test of the Wave C correction zone at 24,098 - 24,029.
- Action Plan:
- Avoid trading in the "No Trade Zone" to minimize risk.
- For longs, wait for a confirmed breakout above **24,227**.
- For shorts, wait for a breakdown below **24,169**, targeting **24,098** first and then **24,029**.
Gap Down Opening (100+ points):
If Nifty opens near or below the Must Try Zone at Wave C completion (24,098 - 24,029), it signals a bearish start.
- Watch for signs of support formation in this range. A strong bounce can lead to a reversal back toward 24,169.
- However, if Nifty fails to hold this zone and breaks 24,029, further downside towards 23,600 could unfold (red trend).
- Action Plan:
- Look for buying opportunities if price holds above **24,029** with confirmation on the hourly chart.
- If **24,029** breaks decisively, initiate short positions targeting **23,600**, with a stop loss above **24,098**.
Risk Management Tips for Options Traders :
Always use stop losses based on an hourly candle close to manage risks.
Avoid trading in uncertain zones (e.g., "No Trade Zone") where the risk-reward ratio is unfavorable.
For options, consider deploying spreads (e.g., Bull Call Spread or Bear Put Spread) to limit risk during gap openings.
Avoid chasing trades in case of a sharp gap-up or gap-down; let the price stabilize for 30 minutes.
Summary and Conclusion:
Nifty remains at a critical juncture near the Wave C correction completion zone.
Key Levels to Watch:
Upside: 24,227, 24,359, 24,488
Downside: 24,169, 24,098, 24,029, and 23,600
Focus on breakouts or breakdowns for actionable trades, avoiding sideways moves.
The yellow trend reflects sideways movement, green indicates a bullish reversal, and red shows bearish continuation.
Disclaimer: I am not a SEBI-registered analyst. This trading plan is for educational purposes only. Traders should conduct their analysis or consult a financial advisor before making decisions.

Nifty Intraday Trade Setup | 19th DecemberNifty opened with a minor gap-down and it morning we saw some volatile moves, once Nifty sustained below 24300 which was a crucial support level, we saw good fall and Nifty made a low near 24150 and closed below 24200.
There is US Fed meeting tonight and tomorrow we may see the impact on Indian markets.
For tomorrow, if Nifty sustains below 24150 we may see further downside towards 24100 and below marked levels. On the other side, if Nifty breaks 24250 on upside we may see 24300 and above marked levels on the chart.
Expectations: Volatile day
Intraday Levels:
Buy Above - 24250
Sell Below - 24150
To motivate us, Please like the idea If you agree with the analysis.
Happy Trading!
InvestPro India

NIFTY : Trading levels and Plan for 18-Dec-2024Nifty Trading Plan for 18-Dec-2024
Previous Day Plan vs Actual:
In yesterday's uploaded chart, we identified key levels of retracement and reversal zones. The Wave C completion zone (24,097 - 24,009) was highlighted as a potential support for buyers. As observed in today’s session, the price reacted strongly to this zone with a pullback, respecting the reversal area as anticipated. Additionally, the Golden Retracement Zone acted as intraday resistance, with prices consolidating sideways as shown in the Yellow Trend . Moving into 18-Dec-2024, we will adjust our plan based on the identified opening levels and trends.
Trading Scenarios for 18-Dec-2024:
Scenario 1: Gap Up Opening (100+ Points Above 24,319)
If Nifty opens with a strong gap-up above 24,485 or near the Golden Retracement Zone , we should be cautious of immediate selling pressure. The first resistance to monitor is at 24,547 . Price action here will determine further moves:
If prices sustain above 24,547 , expect an extension toward 24,686 (Last resistance for Intraday).
Failing to sustain above 24,547 could lead to retracement back to 24,319 (Opening Support).
Action Plan: Wait for a retest of support levels after the gap-up before initiating fresh longs. Avoid chasing prices.
Tip: For option traders, focus on at-the-money call options with tight stop losses if support holds.
⠀⠀
⠀⠀
Scenario 2: Flat Opening (Near 24,319 - Opening Support/Resistance Zone)
If Nifty opens flat near the Opening Support/Resistance at 24,319 , we must observe whether buyers or sellers take control:
If prices break above 24,319 and sustain, look for a move toward the Golden Retracement Zone at 24,454 - 24,485 .
Failure to hold 24,319 could trigger selling pressure toward 24,150 and deeper levels like the Wave C completion zone.
Action Plan: Observe 15-minute candle confirmation before taking any trade. Maintain a favorable Risk/Reward Ratio of at least 1:2.
Tip: For options, consider selling put options if support holds or buying call spreads to minimize premium risks.
⠀⠀
⠀⠀
Scenario 3: Gap Down Opening (100+ Points Below 24,319)
If Nifty opens with a gap-down near the Wave C completion zone (24,097 - 24,009) , this area will act as strong support for buyers:
Look for reversal signs (bullish candles) in this support zone for potential long entries with stop losses below 24,009 .
If prices fail to reverse and sustain below 24,009 , expect further downside toward 23,950 .
Action Plan: Focus on reversal confirmation at Wave C completion for long positions. Avoid shorting unless a clear breakdown occurs.
Tip: For options, buying in-the-money call options at reversal zones reduces the impact of time decay.
⠀⠀
⠀⠀
Risk Management Tips for Options Trading:
Always keep a defined stop-loss for every trade to protect your capital.
Avoid holding options positions overnight, especially during high volatility.
Use spreads (e.g., Call/Put Spreads) to minimize the impact of premium fluctuations.
Do not risk more than 1-2% of your capital per trade.
Monitor the VIX index to gauge overall market sentiment and volatility levels.
Summary and Conclusion:
Bullish Scenario: Sustaining above 24,454 - 24,485 could trigger a move toward 24,686 .
Sideways Scenario: Consolidation in the Golden Retracement Zone may dominate intraday moves.
Bearish Scenario: A break below 24,009 could invite further selling pressure.
Yellow Trend: Sideways Consolidation
Green Trend: Bullish Move
Red Trend: Bearish Breakdown
Disclaimer: I am not a SEBI-registered analyst. The analysis provided is for educational purposes only. Please conduct your research or consult with a financial advisor before taking any trade.
