NIFTY : Trading Plan and Levels for 17-Dec-2024🔹 Previous Day's Plan vs Actual (16-Dec-2024):
In yesterday's plan, we identified the No Trade Zone near 24,696-24,750 and the Opening Resistance at 24,830, expecting sideways movement if prices hovered in this range. As seen in the chart, the price respected the No Trade Zone, consolidating before a pullback. The Opening Intraday Support at 24,526 provided a critical holding point, and prices staged a rebound.
Today's plan will analyze multiple opening scenarios, key levels, and likely trends, helping traders prepare for action.
🔹 Nifty 50 Trading Plan for 17-Dec-2024:
Scenario 1: Gap Up Opening (100+ points)
If Nifty opens above 24,750 (No Trade Zone), the next critical resistance is at 24,830 (Opening Resistance). Sustaining above this level on an hourly candle close can trigger sharp short-covering, leading the index toward 25,041 (Profit Booking Resistance for 25,630).
🔹 Plan of Action:
Wait for the first 15-30 minutes to observe if the gap up sustains.
Enter long positions above 24,830 only if prices hold for an hourly close.
Immediate stop loss can be placed just below 24,750 for risk control.
🔹 Bullish Continuation Target:
Immediate Target: 25,041.
🔹 Risk Management:
For options traders, consider ATM or slightly ITM CE options to manage premium decay.
Avoid chasing the opening; let a pullback confirm strength.
Scenario 2: Flat Opening (near 24,648-24,696)
If Nifty opens flat, the No Trade Zone at 24,696-24,750 will play a critical role. This zone might act as a sideways region (Yellow Trend) if prices struggle to break out.
🔹 Plan of Action:
Stay cautious inside the No Trade Zone as there may be choppy moves.
A breakout above 24,750 or a breakdown below 24,526 will signal the direction.
Go long above 24,750 with a stop loss below 24,696.
Go short below 24,526, targeting 24,484 and lower levels.
🔹 Bullish or Bearish Confirmation:
Bullish breakout: Above 24,750.
Bearish breakdown: Below 24,526.
🔹 Risk Management:
Use defined stop losses, and avoid overleveraging positions.
For options, consider buying spreads to reduce premium risk.
Scenario 3: Gap Down Opening (100+ points)
If Nifty opens near or below 24,526 (Opening Intraday Support), the 24,484 and 24,309 levels will act as crucial supports.
🔹 Plan of Action:
Observe price action at 24,526. If support holds, expect a bounce back toward 24,696.
If 24,526 breaks, initiate short positions targeting 24,484 and 24,309.
If prices drop below 24,309 (Last Intraday Support), it could lead to a sharp decline (Red Trend).
🔹 Key Levels for Shorts:
Immediate Targets: 24,484 → 24,309.
🔹 Risk Management:
Manage trades with strict stop loss above 24,526 for shorts.
For options traders, consider buying OTM PE options for risk-limited trades.
🔹 Risk Management Tips for Options Traders:
Avoid holding positions overnight in volatile market conditions.
Use defined stop losses and trail profits to protect gains.
Prefer spreads (CE/PE spreads) instead of naked buying to manage risk and decay.
Wait for hourly candle closes at critical levels for better confirmation.
🔹 Summary & Conclusion:
Above 24,750, expect bullish continuation towards 25,041.
Flat opening inside the No Trade Zone requires caution; wait for breakout/breakdown.
Below 24,526, bears can take control, with levels 24,484 and 24,309 acting as key supports.
Watch price action near support/resistance and avoid random entries.
🔹 Disclaimer:
I am not a SEBI-registered analyst. This analysis is for educational purposes only. Traders are advised to conduct their research or consult with a financial advisor before making any trading decisions.
Niftyintradaytradesetup

Nifty Intraday Trade Setup | 17th DecemberNifty opened with a minor gap-down and after consolidating Nifty broke our Sell level 24670 on downside and made a low around 24600. Traders followed the idea must have booked profit in Sell side.
For tomorrow, if Nifty sustains below 24600 we may see further downside towards 24550 and below marked levels. On the other side, if Nifty breaks 24710 on upside we may see 24760 and above marked levels on the chart.
Expectations: Range bound day
Intraday Levels:
Buy Above - 24710
Sell Below - 24600
To motivate us, Please like the idea If you agree with the analysis.
Happy Trading!
InvestPro India

The Nifty spot intraday trend forecast for December 17, 2024I am bullish tomorrow. While calculating the Nifty spot levels, gaps on the either side are not taken into account. So levels may vary.
The content provided here are only views and the real-time market may not be in line to my forecast. Use it only for educational purposes.

Nifty Intraday Trade Setup | 16th DecemberNifty opened with a minor gap-down and gave a breakdown in morning which dragged Nifty below 24200. However Nifty took support near 24180 and gave strong reversal, went initially till day high 24520 and after breakout we saw rally in Nifty towards 24792.
For tomorrow, if Nifty sustains above 24810 we may see further rally towards 24860 and upper marked levels. On the other side, if Nifty broke 24670 on downside we may see 24620 and below marked levels on the chart.
Expectations: Volatile day
Intraday Levels:
Buy Above - 24810
Sell Below - 24670
To motivate us, Please like the idea If you agree with the analysis.
Happy Trading!
InvestPro India

Nifty Intraday Support & Resistance Levels for 16.12.2024On Friday, Nifty opened on a negative note, dropping to a low of 24180.80, entering the Daily Demand Zone. However, it staged an impressive recovery, reaching a high of 24792.30, testing the 15m Supply Zone, and closed strong at 24768.30, up 219 points over the previous close. The Weekly Trend (50 SMA) remains sideways, while the Daily Trend (50 SMA) is positive, signalling strength in the short term.
Demand/Support Zones
Far Demand/Support Zone (Daily): 23927.15 - 24188.45 (tested)
Far Demand/Support Zone (75m): 23447.15 - 23578.60
Supply/Resistance Zones
Near Supply/Resistance Zone (15m): 24772.60 - 24857.75 (tested)
Near Supply/Resistance Zone (Weekly): 24567.65 - 25234.05 (tested)
Far Supply/Resistance Zone (Daily): 25739.20 - 25907.60
Far Supply/Resistance Zone (Daily): 26151.40 - 26277.35
Note:
Resistance at 24700 breached: Nifty crossed this critical level and closed above it, a positive sign. Since Nifty is now trading within the Weekly Supply Zone (24567.65 - 25234.05), staying cautiously optimistic is recommended.

NIFTY : Trading Plan and levels for 16-Dec-2024Trading Plan for Nifty 16-Dec-2024
Intro: Yesterday's Plan vs Actual
The chart uploaded for 15-Dec-2024 accurately depicted the market's movement. As anticipated, Nifty faced sharp recovery from mentioned zone after a sharp decline in prices. Monday’s plan builds on these insights, focusing on opening scenarios and trading strategies.
Plan for Different Opening Scenarios
Scenario 1: Gap-Up Opening (100+ Points Above 24,781)
If Nifty opens significantly higher, near or above 25,053 :
Expect resistance around 25,053 (marked red on the chart). Observe for rejection signals such as bearish candles or reduced buying momentum.
Plan of Action:
For aggressive traders: Initiate a short position with a target of 24,767 , placing a stop-loss above 25,100 on an hourly candle close basis.
For conservative traders: Wait for a pullback toward the consolidation zone ( 24,653 - 24,767 ) for potential long positions, targeting a retest of 25,053 .
Watch out for a decisive breakout above 25,053 , which can trigger further bullish momentum toward 25,335 .
Scenario 2: Flat Opening (Near 24,781)
If Nifty opens near the previous close:
The consolidation zone ( 24,653 - 24,767 ) will act as a critical area.
Plan of Action:
Initiate long positions if Nifty sustains above 24,767 with targets of 25,053 . Place stop-loss below 24,653 .
If Nifty slips below 24,653 , short positions can be considered with a target of 24,542 . Ensure a tight stop-loss above 24,653 .
Pay attention to the price action in the yellow trend zone, as sideways movement could lead to traps.
Scenario 3: Gap-Down Opening (100+ Points Below 24,781)
If Nifty opens near 24,542 or lower:
24,542 is the opening support level (marked green on the chart). Observe for sharp recovery signs like bullish engulfing candles.
Plan of Action:
For bulls: Look for a recovery from 24,542 to target 24,653 with a stop-loss below 24,500 .
If 24,542 breaks decisively, expect bearish momentum toward 24,217 . In this case, initiate shorts with a target of 24,217 and stop-loss above 24,542 .
Risk Management Tips for Options Trading
Avoid taking positions during the first 15-30 minutes of market opening to avoid false moves.
For intraday options trading, use at-the-money or slightly in-the-money options to minimize time decay impact.
Set a fixed risk percentage (e.g., 2-3% of your capital) per trade. Stick to it strictly.
Avoid holding positions beyond your planned targets. Use trailing stop-losses to lock in profits during trending moves.
Summary and Conclusion
The key zones to watch today are:
Support: 24,542 , 24,653 .
Resistance: 25,053 , 25,335 .
Green trend indicates bullish potential, yellow for sideways movement, and red for bearish scenarios.
Adapt to price action at critical levels and prioritize proper risk management.
Disclaimer: I am not a SEBI-registered analyst. All views are for educational purposes only. Traders should conduct their own analysis or consult with their financial advisor before making any trading decisions.

The Nifty Spot Intraday trend forecast for December 16, 2024Here is the Nifty intraday likely trend for December 16, 2024. The trend looks bearish during the day. There is a possibility of Gap up opening. The intraday levels provided in the graph may vary subject to Gaps on the either side. This information is only for educational purposes.

Nifty Intraday Support & Resistance Levels for 13.12.2024On Thursday, Nifty opened negative, attempting a recovery with a high of 24675.25, but succumbed to selling pressure, hitting a low of 24527.95. It closed at 24548.70, losing 93 points over the previous close. The Weekly Trend (50 SMA) remains sideways, while the Daily Trend (50 SMA) stays positive.
Demand/Support Zones
Near Demand/Support Zone (30m): 24330.20 - 24368.30
Far Demand/Support Zone (30m): 24140 - 24187.05
Far Demand/Support Zone (75m): 23447.15 - 23578.60
Supply/Resistance Zones
Near Supply/Resistance Zone (15m): 24772.60 - 24857.75
Near Supply/Resistance Zone (Weekly): 24567.65 - 25234.05 (Tested)
Far Supply/Resistance Zone (Daily): 25739.20 - 25907.60
Far Supply/Resistance Zone (Daily): 26151.40 - 26277.35
Resistance at 24700: Nifty is struggling to break this level. A failure to sustain above it may lead to a drop toward the 24370 zone or lower.

NIFTY : Trading levels and plan for 13-Dec-2024Introduction
In the previous day's plan, we analyzed the Nifty 50 Index and identified key support and resistance levels. The chart highlighted a sideways trend in the yellow zone, a bullish trend in the green zone, and a bearish trend in the red zone. The actual price movement today followed the anticipated path, consolidating within the highlighted zones and providing opportunities for both long and short trades.
Trading Plan for 13-Dec-2024
Gap Up Opening (100+ points)
If Nifty opens with a gap up above 24,711.00, it is crucial to watch for a retest of the last and important resistance for intraday at 24,735.00. If the price sustains above this level, initiate long positions targeting 24,940.00.
Place a stop loss just below 24,711.00 to manage risk.
If the price fails to sustain above 24,735.00 and shows signs of reversal, consider short positions targeting the opening support/resistance zone at 24,484.00.
Monitor the price action closely and adjust stop losses to protect profits as the price moves in your favor.
Flat Opening
If Nifty opens flat around 24,539.50, observe the price action within the highlighted yellow zone.
A breakout and sustained movement above this range can pave the way for Nifty to target levels of 24,711.00 and 24,735.00.
Initiate long positions if the price breaks above the yellow zone with a stop loss just below the breakout level.
If the price remains within the yellow zone, avoid taking new positions and wait for a clear breakout or breakdown.
In case of a breakdown below the yellow zone, consider short positions targeting the support zone at 24,484.00.
Gap Down Opening (100+ points)
If Nifty opens with a gap down below 24,450.00, it is essential to watch for a retest of the opening support/resistance zone at 24,484.00.
If the price fails to reclaim this level and shows signs of further weakness, initiate short positions targeting the extended zone for Wave C correction at 24,354.00.
Place a stop loss just above 24,484.00 to manage risk.
If the price sustains above 24,484.00 after a gap down, consider long positions targeting the yellow zone and monitor for a potential reversal.
Adjust stop losses to protect profits as the price moves in your favor.
Risk Management Tips for Options Trading
Always use stop losses to limit potential losses.
Avoid over-leveraging and trade within your risk tolerance.
Diversify your trades to spread risk across different positions.
Keep an eye on implied volatility and time decay when trading options.
Regularly review and adjust your trading plan based on market conditions.
Summary and Conclusion
In summary, the trading plan for 13-Dec-2024 involves monitoring key support and resistance levels based on the opening scenario. For a gap-up opening, focus on sustaining above 24,735.00 for long positions. For a flat opening, watch for a breakout from the yellow zone. For a gap-down opening, monitor the 24,484.00 level for potential short positions. Implementing proper risk management strategies is crucial for successful options trading.
Disclaimer
I am not a SEBI registered analyst. The information provided is for educational purposes only and should not be considered as financial advice. Always conduct your own research and consult with a professional financial advisor before making any trading decisions.

NIFTY : Trading Plan and levels for 12-Dec-2024NIFTY Trading Plan for 12-Dec-2024
Intro: Review of 11-Dec-2024 Plan vs Actual
The trading plan for 11-Dec-2024 outlined key levels such as the Bullish Order Block (24,655–24,607) and the Liquidity Zone (24,820). As predicted, the market respected the "No Trade Zone" initially, followed by consolidation in the Liquidity Zone. The sideways movement highlighted by the yellow trend prevailed, with no significant breakout or breakdown occurring during the session. The Profit Booking Zone at 25,053 remained untouched. This demonstrates the importance of waiting for clear confirmation before executing trades.
Today's updated chart builds upon these levels and provides actionable insights for 12-Dec-2024 based on anticipated price movements.
Opening Scenarios and Plan for 12-Dec-2024
Gap Up Opening (+100 points or more above 24,652):
If the market opens above 24,750:
Resistance Zone: Immediate resistance remains at 24,820 (Liquidity Zone). Price could either consolidate here or witness selling pressure. Monitor price action for clear breakout signals.
Action Plan: Avoid long entries near the Liquidity Zone unless a breakout above 24,940 is confirmed. Short positions can be initiated on rejection from 24,820, targeting 24,652.
Alternate Scenario: Sustained movement above 24,940 indicates bullish momentum, with targets at the Profit Booking Zone (25,053).
Yellow trend highlights a cautionary approach in consolidation zones.
Flat Opening (Near 24,629–24,652):
If the market opens flat:
No Trade Zone: Expect price to oscillate within 24,629–24,652, indicating indecisiveness. Avoid trading in this range.
Bullish Scenario: A confirmed breakout above 24,652 with a retest offers long opportunities, targeting the Liquidity Zone at 24,820.
Bearish Scenario: A breakdown below 24,541.65 suggests bearish momentum, with potential shorts targeting Buyer’s Strong Support at 24,374–24,338.
Yellow trend signals limited movement; wait for breakouts for better trades.
Gap Down Opening (-100 points or more below 24,541.65):
If the market opens below 24,450:
Support Zone: The critical support lies at 24,374–24,338, aligning with Buyer’s Strong Support near the CHoCH level.
Action Plan: Look for reversal signs near the support zone to initiate long trades with a tight stop loss below 24,300, aiming for 24,541.65.
Alternate Scenario: If this support fails, avoid aggressive longs and wait for stabilization before entering.
Red trend suggests bearish momentum; trade cautiously.
Tips for Risk Management in Options Trading
Use predefined stop losses to cap potential losses. For example, place stops below 24,541 for bullish trades and below 24,300 for reversal trades.
Avoid trading during the first 15 minutes to allow for market direction to emerge.
For option buyers, select ATM or slightly ITM options to reduce the impact of time decay.
Maintain a 1:2 or higher risk-reward ratio to ensure consistent profitability.
Position sizing should align with your risk tolerance to handle volatile price swings.
Summary and Conclusion
The NIFTY index remains in a consolidation phase with critical levels identified for bullish and bearish scenarios.
Liquidity Zone (24,820) and Buyer’s Support (24,374–24,338) are key areas to monitor for actionable trades.
Avoid trading in indecisive zones and wait for clear breakouts or breakdowns.
Effective risk management remains crucial, especially in volatile markets.
Disclaimer: This analysis is for educational purposes only. I am not a SEBI-registered analyst. Please conduct your own research or consult a financial advisor before trading.

Nifty 11th Dec 2024Date: 11th Dec 2024
TIme 12:00 pm IST
BIAS
Monthly-Bearish
Weekly-Not Sure
Daily-Bullish
4hr-Not Sure
1hr-Not sure
TRADE
Nifty is most like to consolidates o my trades will be delta neutral non directional.

Nifty technical analysis for today (11/Dec/2024)Nifty moments for option and future trading 11/Dec/2024
follow us for more updates information.
message us for any stocks related information.

NIFTY : Trading Plan and levels for 11-Dec-2024Trading Plan for Nifty on 11-Dec-2024
Intro for the Previous Day's Chart Pattern :
On 10-Dec-2024, Nifty exhibited a mixed trend with a sharp shift in demand zones. The chart revealed a significant buyer's support near the CHoCH (Change of Character) level, with a consolidation phase observed in the "No Trade Zone." The yellow trend marked sideways action, while green and red trends indicated bullish and bearish movements, respectively. The index also faced resistance in the liquidity zone, signaling profit-booking scenarios.
Trading Plan for 11-Dec-2024 :
Gap-Up Opening (+100 points or more above 24,620):
A gap-up opening above 24,720 would position the index near the liquidity zone. Traders should:
Wait for the first 15-30 minutes to observe price stability.
If Nifty sustains above 24,780 (liquidity zone), initiate long trades targeting 24,891 (Resistance/Profit Booking Zone).
Place a stop loss below 24,652 (Opening Resistance/Support Zone) on a closing basis.
If prices face rejection near 24,820 , wait for a bearish hourly candle to confirm a downside move towards 24,680 . Avoid aggressive buying in the resistance zone.
Flat Opening (near 24,620):
A flat opening suggests indecision. Plan of action:
Let the market settle for 15-30 minutes within the "No Trade Zone."
Breakout above 24,652 can lead to bullish momentum, targeting 24,780 and higher.
Breakdown below 24,541 could initiate bearish moves targeting 24,374 and 24,338 .
Risk management is crucial here; tight stop losses are essential to avoid unnecessary losses.
Gap-Down Opening (-100 points or more below 24,620):
A gap-down opening near 24,500-24,480 will likely test the buyer's strong support zone around 24,374 . Actions to consider:
If Nifty holds above 24,374 , initiate long trades for a reversal, targeting 24,541 (Opening Support Zone).
If the index breaches 24,338 , prepare for further downside with targets at 24,280 .
Wait for clear rejection or reversal patterns to confirm your entries. Avoid panic-selling in bearish moves.
Tips for Options Trading Risk Management:
Trade with defined stop losses and avoid holding positions beyond your risk appetite.
Use "ATM" (At-The-Money) options for quicker returns in trending markets.
For sideways trends, prefer strategies like straddle or strangle.
Avoid over-leveraging, and never risk more than 2-3% of your trading capital on a single trade.
Summary and Conclusion:
Nifty's movement on 11-Dec-2024 will hinge on its ability to sustain critical zones like 24,652 and 24,374 . While green trends indicate bullish potential, red trends signal caution for bearish moves. Adhering to risk management principles and waiting for clear price action confirmation will enhance your trade quality and reduce unnecessary losses.
Disclaimer:
I am not a SEBI-registered analyst. All information provided is based on personal research and is for educational purposes only. Traders should perform their own analysis or consult with a financial advisor before making any trading decisions.

Nifty Intraday Support & Resistance Levels for 11.12.2024On Tuesday, Nifty opened on a slightly positive note, bulls took over during the first hour, reaching a high of 24677.80. However, it couldn’t sustain the momentum and dropped to a day low of 24510.65. A late-session recovery saw it close at 24610.05, losing just 9 points over the previous close. The Weekly Trend (50 SMA) remains sideways, while the Daily Trend (50 SMA) stays positive, indicating resilience in the short term.
Demand/Support Zones
Near Demand/Support Zone (15m): 24295.55 - 24376.65
Far Demand/Support Zone (30m): 24140 - 24187.05
Far Demand/Support Zone (75m): 23447.15 - 23578.60
Supply/Resistance Zones
Near Supply/Resistance Zone (15m): 24772.60 - 24857.75
Near Supply/Resistance Zone (Weekly): 24567.65 - 25234.05 (Current price inside the zone)
Far Supply/Resistance Zone (Daily): 25739.20 - 25907.60
Far Supply/Resistance Zone (Daily): 26151.40 - 26277.35

Nifty Intraday Trade Setup | 10th DecemberNifty opened with gap-down near our buy level 24640 but gave a sharp bounce towards 24705 and then started falling. Nifty broke our sell level 24640 and hit 1st target on sell side at 24590. After that it was trading in a range.
For tomorrow, we will look for the sell opportunity either from 24700 - 24690 or if breaks 24580 for the targets of 24530 and below marked level on the chart.
Expectations: Trending day
Intraday Levels:
Buy Above - Sell on rise
Sell Below - 24580
To motivate us, Please like the idea If you agree with the analysis.
Happy Trading!
InvestPro India

Nifty Intraday Support & Resistance Levels for 10.12.2024On Monday, Nifty opened on a negative note, fluctuating within a narrow range yet again. It marked a high of 24705 and a low of 24580.05, before closing at 24619, losing 58 points. The Weekly Trend (50 SMA) remains sideways, while the Daily Trend (50 SMA) stays positive, suggesting potential for upward momentum.
Demand/Support Zones
Near Demand/Support Zone (15m): 24295.55 - 24376.65
Far Demand/Support Zone (30m): 24140 - 24187.05
Far Demand/Support Zone (75m): 23447.15 - 23578.60
Supply/Resistance Zones
Near Supply/Resistance Zone (Weekly): 24567.65 - 25234.05 (Current price inside the zone)
Far Supply/Resistance Zone (Daily): 25739.20 - 25907.60
Far Supply/Resistance Zone (Daily): 26151.40 - 26277.35

NIFTY : Trading Levels and Plan for 10-Dec-2024Trading Plan for Nifty 50 – 10-Dec-2024
Intro:
On the previous trading day, Nifty witnessed a mix of consolidation and momentum shifts. The Liquidity Zone around 24,767 acted as a crucial resistance level, while support near 24,541.65 helped stabilize the index. The chart shows a No Trade Zone between 24,626.60 and 24,652.35, indicating indecisiveness. A clear trend above or below this range will dictate the next move. Yellow signifies sideways movement, green shows bullish potential, and red highlights bearish breakdowns.
Opening Scenarios:
Gap-Up Opening (+100 Points):
If Nifty opens near 24,767 or higher, it will test the Opening Resistance . This level aligns with the Liquidity Zone observed previously.
Action Plan:
A breakout above 24,767 could push the index toward the Profit Booking Zone at 25,053. Enter long positions only if the first 15-minute candle closes above 24,767, with a stop loss at 24,652.35.
If rejection occurs at 24,767, expect a pullback toward 24,652.35. Short positions can be considered below 24,767, targeting the No Trade Zone.
Risk Management Tip: Avoid aggressive positions at key resistance zones. Use limited-risk strategies like debit spreads to manage exposure.
Flat Opening:
If Nifty opens near 24,652.35, it enters the No Trade Zone . This is a neutral region, and waiting for a clear breakout or breakdown is recommended.
Action Plan:
A breakout above 24,652.35 can lead to a bullish move toward 24,767. Initiate long positions with tight stop losses at 24,541.65.
A breakdown below 24,626.60 could trigger bearish momentum, targeting 24,541.65. Consider short trades in this scenario, with stop losses at 24,652.35.
Risk Management Tip: Avoid overtrading in consolidation zones. Use trailing stop losses to secure profits during volatile phases.
Gap-Down Opening (-100 Points or More):
If Nifty opens near 24,541.65 or lower, it will test the Opening Support or even the Buyer's Strong Support near 24,338.
Action Plan:
Watch for a bullish reversal near 24,338. If the price sustains above this level, initiate long positions targeting 24,541.65. Use 24,300 as a stop loss.
A breakdown below 24,338 could lead to a bearish continuation toward 24,200. Short positions can be initiated in such cases, with stop losses above 24,338.
Risk Management Tip: In gap-down scenarios, prioritize hedged strategies like iron condors to mitigate large swings.
Summary & Conclusion:
Resistance Levels: 24,767 , 25,053
Support Levels: 24,541.65 , 24,338 , 24,200
A breakout or breakdown from the No Trade Zone will set the directional bias for the day. Traders should remain cautious and avoid emotional trading.
Disclaimer:
This analysis is for educational purposes only. I am not a SEBI-registered analyst. Please consult your financial advisor or conduct independent research before trading.

Nifty Intraday Trade Setup | 9th DecemberNifty opened flat as because of RBI Policy we saw some volatility in first hour but then Nifty traded in a small range whole day and it was more of a options sellers day.
For tomorrow, if Nifty sustains above 24755 you can consider buying for 27800 and above marked level. On the other side, if Nifty sustains below 24640 you can consider taking a sell trade for the target of 24590 and below marked level on the chart.
Expectations: Volatile movement.
Intraday Levels:
Buy Above - 24755
Sell Below - 24640
To motivate us, Please like the idea If you agree with the analysis.
Happy Trading!
InvestPro India

Trade Setup for Monday (09-Dec-2024)Multi Time Frame Analysis
HTF - D1
LTF - M15
PD Arrays
D1 - FVG
M15 - SSL (Liquidity)
Sell Side Liquidity swept
Price is likely to move towards Buy Side Liquidity (BSL) at 24850 level

Nifty Intraday Support & Resistance Levels for 09.12.2024On Friday, Nifty traded within a narrow range, reflecting cautious market sentiment. It made a high of 24751.05 and a low of 24620.50, ultimately closing at 24677.80, down by 30 points. The Weekly Trend (50 SMA) remains sideways, while the Daily Trend (50 SMA) stays positive, signalling underlying strength.
Demand/Support Zones
Near Demand/Support Zone (15m): 24295.55 - 24376.65
Far Demand/Support Zone (30m): 24140 - 24187.05
Far Demand/Support Zone (75m): 23447.15 - 23578.60
Supply/Resistance Zones
Near Supply/Resistance Zone (Weekly): 24567.65 - 25234.05 (Current price inside the zone)
Far Supply/Resistance Zone (Daily): 25739.20 - 25907.60
Far Supply/Resistance Zone (Daily): 26151.40 - 26277.35

NIFTY : Trading Plan and Levels for 09-Dec-2024Nifty Trading Plan for 09-Dec-2024
Previous Day's Chart Pattern:
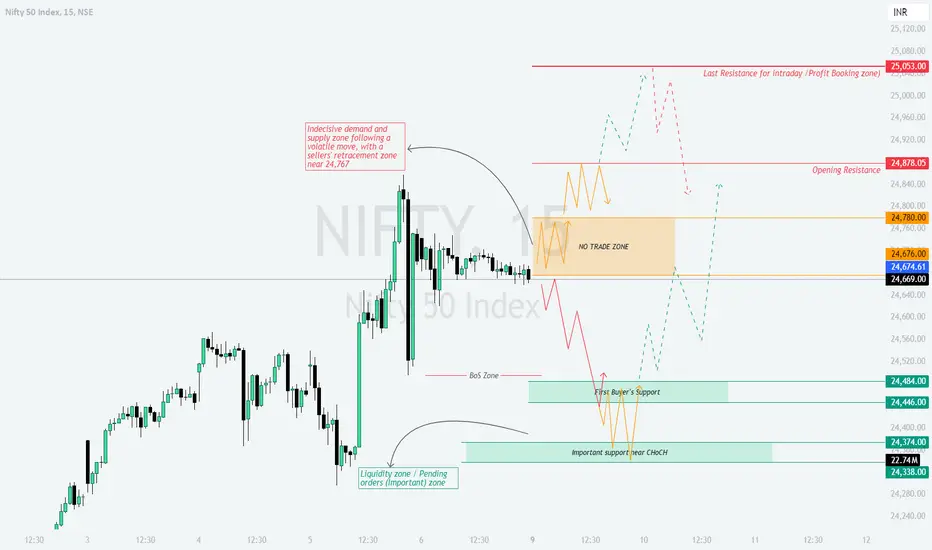
On 08-Dec-2024, Nifty displayed a range-bound movement within the No Trade Zone (24,674 – 24,780) , with intermittent attempts to break out on both sides. Buyers showed interest near the liquidity zone around 24,484 , but resistance at 24,780 capped upward momentum. The yellow zone signified consolidation, green highlighted bullish efforts, and red depicted bearish dominance. This creates a balanced yet cautious outlook for the next trading session.
Trading Plan for 09-Dec-2024:
Gap-Up Opening (+100 points or more above 24,780):
If Nifty opens above 24,780:
The immediate target will be 24,878 . A sustained move above this level may lead to a test of the profit-booking zone at 25,053 .
Enter long positions above 24,780 with a stop loss at 24,730 . Watch for rejection patterns near 24,878 for partial profit booking.
In case of a sharp reversal from 24,878, the index could retrace toward 24,780. Avoid aggressive longs if rejection occurs at higher levels.
Risk Management Tip: Opt for slightly OTM call options in small quantities. Use trailing stops to secure profits near resistance zones.
Flat Opening (Within the No Trade Zone 24,674 – 24,780):
A flat opening within the No Trade Zone requires patience:
If Nifty breaks above 24,780, initiate longs with targets of 24,878 and 25,053 .
On the downside, a fall below 24,674 can lead to a retest of the first buyer’s support at 24,484 . Initiate shorts cautiously with a stop loss above 24,700.
Risk Management Tip: Avoid overtrading in a sideways zone. Wait for clear breakouts before taking positions. Avoid weekly options in choppy zones.
Gap-Down Opening (-100 points or more below 24,674):
If Nifty opens below 24,674:
First support lies at 24,484 . If this zone holds, we may witness a reversal toward 24,674. Look for bullish candles to confirm long entries.
A break below 24,484 will likely test the liquidity zone at 24,446 or deeper support at 24,374 – 24,338 . Enter shorts below 24,484 with a stop loss near 24,500.
Risk Management Tip: For gap-down scenarios, consider put options with a spread strategy to limit losses. Avoid chasing price movements without confirmation.
Summary and Conclusion:
Nifty's key levels to monitor are 24,674 – 24,780 (No Trade Zone), 24,878 (Opening Resistance), and 25,053 (Profit Booking Zone).
The green zones represent bullish trends, yellow highlights consolidation, and red indicates bearish zones.
Focus on executing trades only after confirmation and manage risks with disciplined stop-loss placements.
Disclaimer: This analysis is for educational purposes only. I am not a SEBI-registered analyst. Traders are advised to do their research or consult a financial advisor before trading.
NIFTY Surges 900+ Points: Massive Gains Unlocked!NIFTY on the 1-hour timeframe displayed an exceptional bullish momentum, achieving 900+ points in profit so far. This long trade setup, captured using the Risological Swing Trading Indicator , has already hit TP1 and TP2, with the remaining targets likely to be reached soon.
NIFTY Key Levels:
TP1: 24204.50 ✅
TP2: 24786.30 ✅
TP3: 25368.10 🔄
TP4: 25727.65 🔄
NIFTY Technical Analysis:
The trade initiated at 23844.95 with a stop-loss at 23554.05, providing an excellent risk-to-reward ratio.
The price consistently respected the Risological trend line, confirming the strength of the uptrend. Both TP1 and TP2 have been achieved, showcasing the precision of the system.
The breakout above key resistance levels hints at a continuation towards the upper targets.
This setup reflects how effectively the Risological Swing Trading Indicator identifies profitable opportunities with minimal risk.
Namaste!

NIFTY : Trading Plan and levels for 06-Dec-2024Trading Plan for Nifty – 06-Dec-2024
Intro to the Previous Day's Chart Pattern:
On 05-Dec-2024, Nifty exhibited a volatile session but from the level (excatly where I mentioned in yesterday's trade pan) a significant rally towards the Wave C completion zone but a huge volatility in the prices seen in the last trading hour, . A sharp rejection from this zone reinforced bearish pressure, driving the index back to the Opening Support/Resistance zone at ₹24,697 . The chart highlighted three critical zones:
Red Trend: Bearish resistance around Wave C completion ( ₹25,050 ).
Yellow Trend: Sideways consolidation in the Opening Resistance Zone (₹24,882–₹24,697) .
Green Trend: Bullish momentum originating from the Initial Support Zone (₹24,412) .
Trading Plan for 06-Dec-2024
Gap Up Opening (+100 Points):
If Nifty opens above ₹24,882 , it will likely face immediate resistance at the Wave C completion zone (₹25,050) .
Action Plan:
Look for bearish rejections or reversal candlestick patterns near ₹25,050 . A failure to sustain above this level indicates a shorting opportunity, targeting ₹24,697 and ₹24,412 .
If Nifty sustains above ₹25,050 for at least two 15-minute candles, it signals a breakout. Go long, aiming for ₹25,300 and ₹25,450 .
Risk Management Tip:
Use a trailing stop-loss once the trade moves in your favor. For options, consider selling OTM puts below ₹24,700 to benefit from time decay.
Flat Opening (Near ₹24,697):
A flat opening will test the Opening Support/Resistance zone (₹24,697) .
Action Plan:
If Nifty holds above ₹24,697 , expect a bullish move towards ₹24,882 . Breakout above this level can lead to ₹25,050 .
Failure to sustain ₹24,697 could drag Nifty towards the Initial Support Zone (₹24,412) . Monitor for price rejection at ₹24,412 for potential long entries.
Risk Management Tip:
For flat openings, avoid aggressive entries. Let the first 30 minutes establish the trend, then act accordingly. Use spreads (e.g., bull call spreads) to cap your risk in options.
Gap Down Opening (-100 Points):
A gap-down opening near ₹24,412 or below will test key supports.
Action Plan:
If Nifty finds support at ₹24,412 , look for bullish price action. Enter long positions targeting ₹24,697 and ₹24,882 .
If Nifty breaks ₹24,412 , the next critical zone lies at ₹24,224–₹24,142 . Watch for signs of demand in this deep retracement zone for potential reversals.
Risk Management Tip:
In case of high volatility, trade with reduced position sizes. Use iron condors or straddles to take advantage of elevated option premiums during gap-down scenarios.
Summary and Conclusion:
Resistance Levels: ₹24,882, ₹25,050
Support Levels: ₹24,697, ₹24,412, ₹24,224
Key levels to watch: A breakout above ₹25,050 or a breakdown below ₹24,412 will dictate intraday momentum.
Use proper risk management strategies like trailing stop-losses and avoid over-leveraging in volatile markets.
Disclaimer:
The above analysis is for educational purposes only . I am not a SEBI-registered analyst. Please perform your own research or consult a financial advisor before making any trading decisions. Markets involve risk; trade responsibly.
