nifty itNifty IT sector near major support @27500/27200
if not close below we seen sharp bounce back .
Niftyit

TCS review TCS has broken the descending channel
Where to buy ????
3185-3200 (S1)
Further buy on dip levels will be
2880-3000(S2)

WAVE ANALYSISCurrently #NIFTYIT is forming wave-D of a triangle in up trend. Most probably this triangle will be a expanding triangle.

Case 2nd in NIFTY IT wave analysisCase 1st can be found here
Case 2nd: If you see the market goes below 32438.25 means the wave-C is itself as a complex correction and the market will go down more, this view will remain same until the market goes above the 36815. Chances are very high that the wave-C will be a complex corrective pattern. If you have any question you can ask.

TCS Following FibonacciTata Consultancy Services moves in a channel upwards, then retraces, exactly to 78.6% basis Fibonacci.
If TCS makes a recent top, you can get short opportunity all the way down to 78.6% irrespective of what NIFTY IT does.
Wait for the top, and breakdown from channel before entering trade. Keep trailing stop loss after every day.

Nifty IT IndexNifty IT Index now trade around 33400 if break out below 33400 first support 31300 and finally i expect 29300

Nifty IT Index Nifty IT Index support 33400 if break out below this lvl big fall expecting upto 29000 to 29300

Nifty IT may take support at this levelCNXIT is traveling in a channel and it got a rejection from the top of the channel we have a demand zone for CNXIT from 34453 to 33500
We are going to be bullish in CNXIT until a daily candle closes below 33500.
So we can plan swing trading in this sector and we can take long positions if get any long setup in the stocks which come under this sector but we have to wait until it enter into DemandZone.
What we believe in:-
°Trade With Logic
°Take Time Before Investment
Saving Your Capital 🙂
I'm not responsible for your profit or loss.
Mainly Stock & Crypto Investor 🕵️
| The Indus Trader 📊
DISCLAIMER:- This Channel Is For ( EDUCATIONAL PURPOSE )

Nifty IT at crucial juncture Nifty IT at Make or Break level. If this level holds it can support Nifty as well.

Support Zone of Nifty IT: Good time to Accumulate Tech StocksNifty IT heading towards Support Zone. Time for Bottom Fishing of Tech Stocks.
Go through heavy weight counters of IT Sectors
Infy
NSE:INFY
TCS
NSE:TCS
Tech M
NSE:TECHM
Naukri
NSE:NAUKRI

IT Index re-testing the Break OutIT Index had given a major BO from the squeezing triangle. Mostly it is coming back to test the breakout. Major supports here are 37362, 37264, 37196 and finally 37125. Mostly IT should reverse from that range. Post re-testing is done IT will slowly consolidate and move towards making fresh highs above 39442. Our target of IT Index for 2022 is 40211.

INFY LONG ??? RESULT DAY TRADINGGood Morning guys
My Personal view about INFY
Im bullish on INFY
Buy @ CMP
Targets :
1925
1961
2000
sell below will be 1800 (If market close below 1800 level)
Thank you

NEWGEN SOFTWARE - BuyHigh Probability Trade Setup
Buy NEWGEN Software above 620.
Risky traders can even buy around 600-610 range.
Stock looks good for mid-term.
Above 645, stock can blast and we can see 700++ levels as well. Refer chart for in detailed levels.
There is a gap created from 664 to 645, high probability of gap getting filled in coming week.
Good Volumes seen on the chart on Friday. Stock has retraced from 50%. High chances of 700 levels in coming days.


ROUTE 1DAYROUTE is consoladating a long way, earlier corrected 30% now again corrected at 30%. Now can reverce from here till the box then make the new high from the green line.

NIFTY IT : IN CHANNELNIFTY IT AGAIN ENTER IN CHANNEL...False Break out was seen on Saturday but due to Heavy selloff in market Nifty IT Again Enter in DECENDING TRIANGLE

Nifty IT Triangle BreakoutNifty IT will be my radar for up coming sessions. Might come for retest but over all looking good for up side.

NIFTY IT : IN DECENDING TRIANGLENifty it trading in correction of 4 hour chart...and also rangebound trend....now trade in upper range of triangle....pricewise Correction correction is completed when Nifty it till 34400....and expected to till Feb 2022

IT SECTOR : Still in uptrendIT Sector weekly chart shows uptrend is still intact. Index trading above 30 WEMA which suggests it is in Stage2- Uptrend. Relative Strength is positive as against the Nifty 50 Index. Larger stocks within the index have seen decent correction & seems to be forming bases for next leg of move. Will be considered weak if it breaks down below 30 WEMA. Would start next leg of upmove on breakout of the current trading (box) range marked.
Only for educational purposes, not a buy/sell recommendation.

Nifty IT34550 in IT sector can be a major support zone. Below this I will looking bearishness in IT Stocks. Keep an eye

abaove 35350 nifty IT will give breakoutabaove 35350 nifty IT will give breakout
RSI positive Divergance
taken support from demand zone on daily time frame

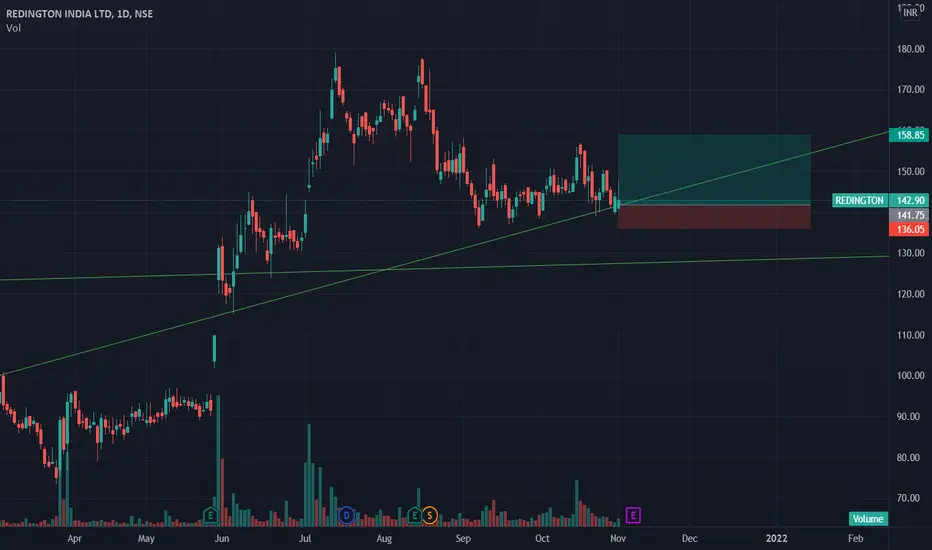
Redington Retest ReversalThe stock has reached lower trendline and may undergo a reversal rally. Trade is supported by brokerage calls and Supports Nearby.
Risk Reward Ratio - 3:1
SL is placed below support zone & the lower trendline. The target is placed near resistance.
Cyient ReversalThe stock has reached lower trendline and may undergo a reversal rally. Trade is supported by brokerage calls and Supports Nearby.
Risk Reward Ratio - 3:1
SL is placed below support zone the lower trendline. The target is placed near resistance.
