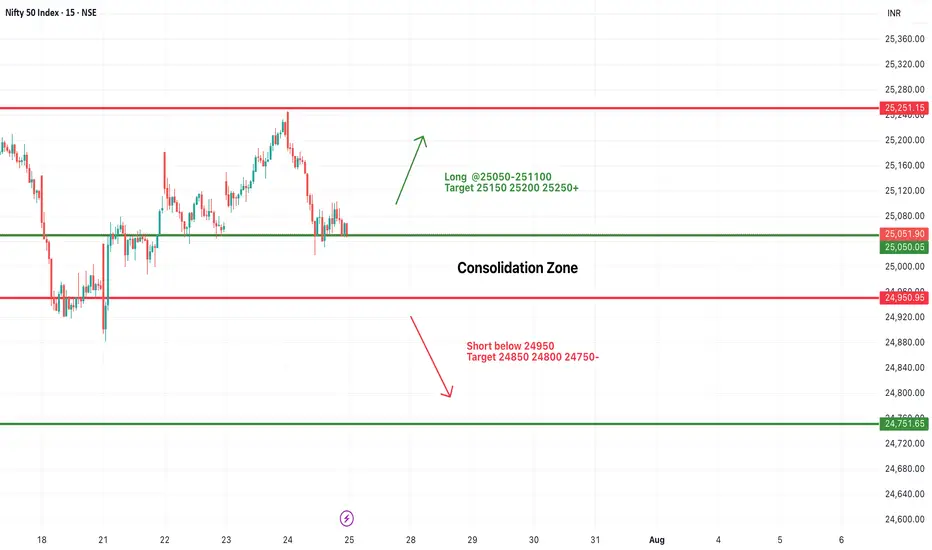
#NIFTY Intraday Support and Resistance Levels - 25/07/2025Nifty is expected to open with a slight gap-down and is currently trading within a tight consolidation zone between 24,950 and 25,050. This narrow 100-point range has acted as a critical zone over the past sessions, indicating indecision and low conviction among traders.
A sustained move above 25,050–25,100 may provide a long opportunity with potential upside targets of 25,150, 25,200, and 25,250+. Strong bullish momentum will only be confirmed if Nifty manages to close above 25,250, which may push the index further toward 25,350–25,400 in the coming days.
On the other hand, a breakdown below 24,950 will shift the bias toward bearishness. A short setup could then target 24,850, 24,800, and 24,750- levels.
Until then, expect sideways price action between 24,950 and 25,050. Traders should wait for a breakout or breakdown before entering fresh trades. Avoid aggressive entries inside this tight band.
Niftylevels
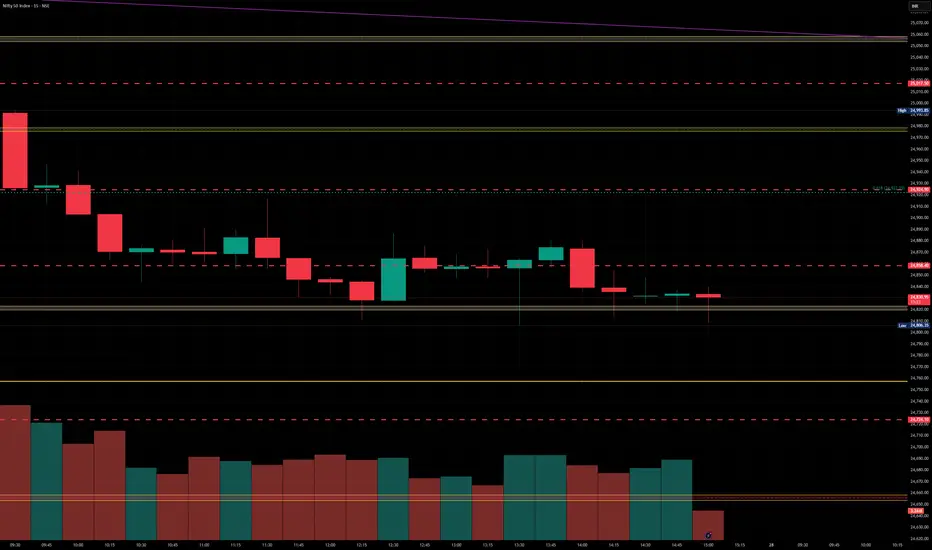
Nifty levels - Jul 28, 2025Nifty support and resistance levels are valuable tools for making informed trading decisions, specifically when combined with the analysis of 5-minute timeframe candlesticks and VWAP. By closely monitoring these levels and observing the price movements within this timeframe, traders can enhance the accuracy of their entry and exit points. It is important to bear in mind that support and resistance levels are not fixed, and they can change over time as market conditions evolve.
The dashed lines on the chart indicate the reaction levels, serving as additional points of significance to consider. Furthermore, take note of the response at the levels of the High, Low, and Close values from the day prior.
We hope you find this information beneficial in your trading endeavors.
* If you found the idea appealing, kindly tap the Boost icon located below the chart. We encourage you to share your thoughts and comments regarding it.
Wishing you success in your trading activities!
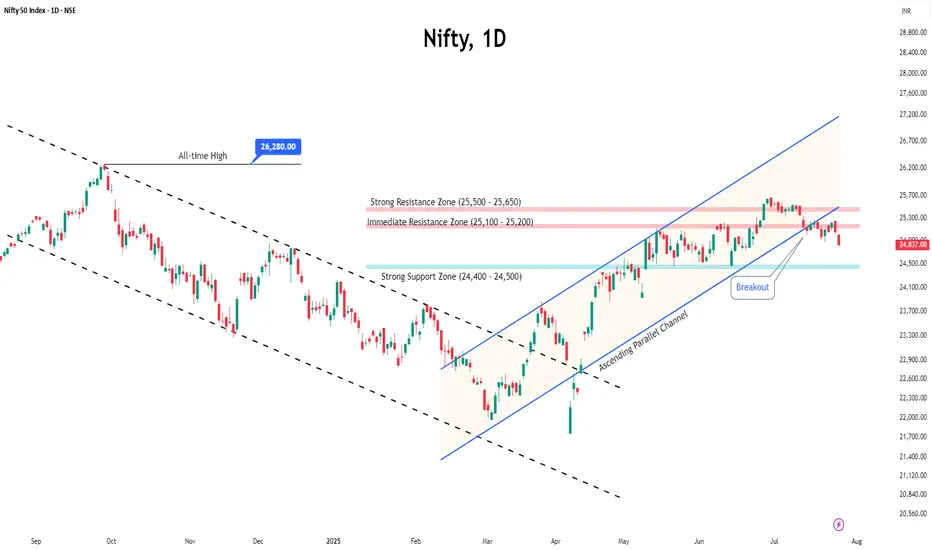
Pressure Builds on Nifty Before ExpiryThe Nifty traded in a tight range for most of the week but eventually slipped below the 25,000 mark, ending on a weak note.
With the monthly expiry approaching, the index is likely to remain under pressure, and volatility may pick up in the coming sessions.
Key resistance levels are seen at 25,200 and 25,500. A decisive move above 25,500 could trigger an upside breakout. On the downside, support is expected around 24,500 and 24,400.
Given the current structure, traders are advised to stay cautious, focus on selective opportunities, and avoid aggressive positions until a clearer trend emerges.
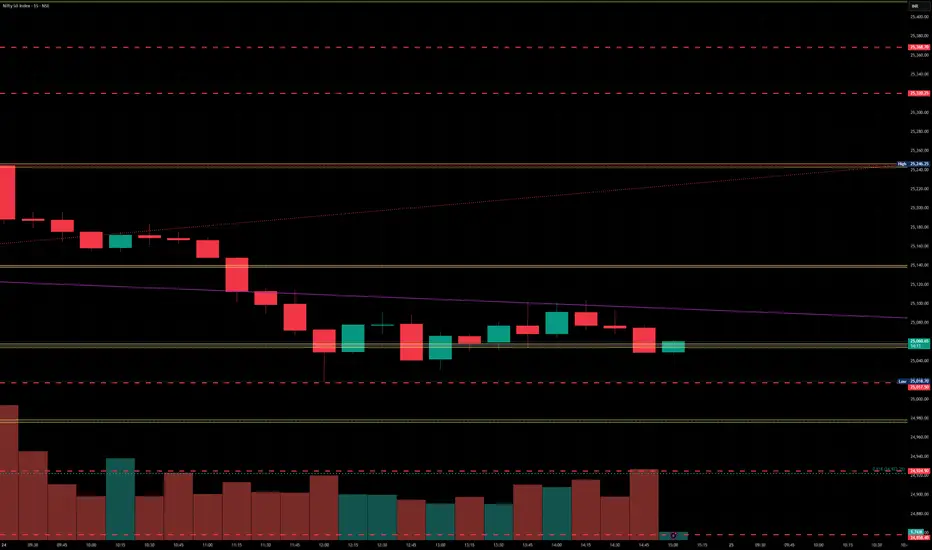
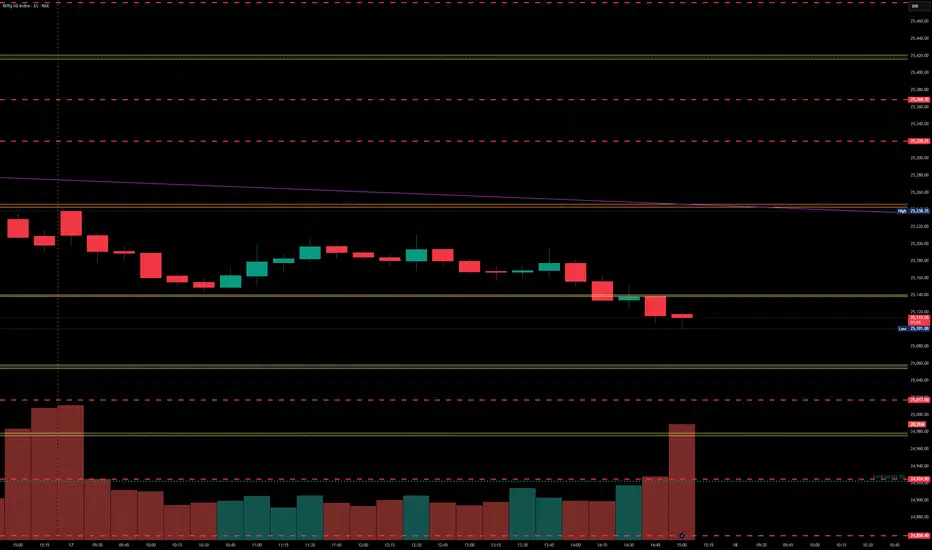
Nifty Analysis EOD – July 24, 2025 – Thursday 🟢 Nifty Analysis EOD – July 24, 2025 – Thursday 🔴
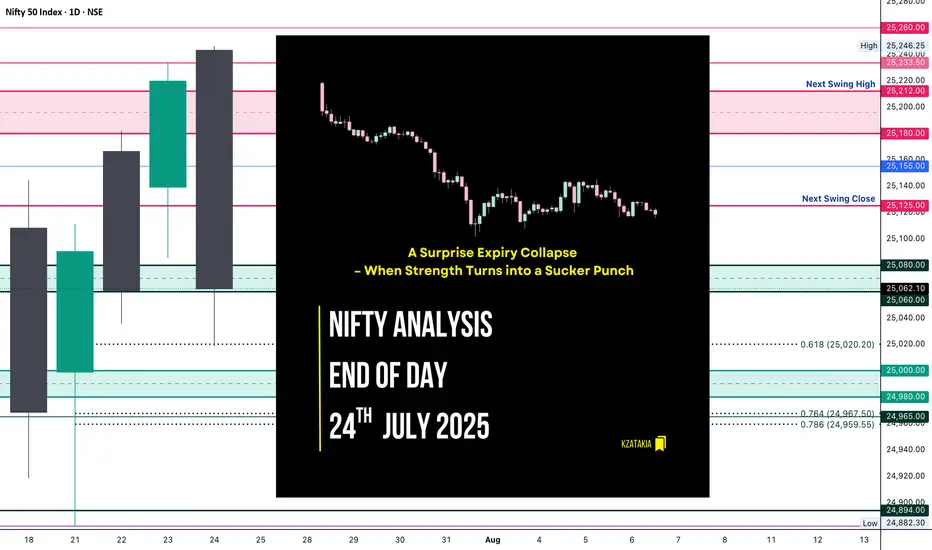
📉 A Surprise Expiry Collapse – When Strength Turns into a Sucker Punch
Today’s session was an unexpected twist.
Nifty opened above the previous day’s high, giving early hope to the bulls—but within the first hour, it slipped to 25,155 and formed its IB. What followed was a sharp 136-point fall, breaking not just yesterday’s low, but also the July 22nd low. This sudden bearish momentum was completely news-driven, and expiry-day long unwinding only added fuel to the fire.
Despite a strong close yesterday, today’s fall erased all of July 23rd’s gains and brought us right back to July 22nd’s close—neutralizing the recent upward effort.
The day closed at 25,062, marginally above key support. Technically, today’s low respected the 0.618 Fib retracement level drawn from July 21st’s low to July 23rd’s high—so a dead cat bounce is possible if no further bad news hits. But if we open below 25,050 tomorrow, expect more downside pressure toward 24,960–24,890 zones.
🕯 5 Min Time Frame Chart with Intraday Levels
🕯 Daily Time Frame Chart with Intraday Levels
🕯 Daily Candle Breakdown
Open: 25,243.30
High: 25,246.25
Low: 25,018.70
Close: 25,062.10
Change: −157.80 (−0.63%)
Candle Structure Analysis:
🔴 Body: Large red body (181.2 pts) shows strong intraday selling.
☁️ Upper Wick: Tiny (2.95 pts) → sellers dominated from the start.
🌊 Lower Wick: Moderate (43.4 pts) → small recovery near close.
Candle Type:
Almost a bearish Marubozu — clear domination by sellers with barely any upper shadow, signaling intense sell pressure.
Key Insight:
Bulls lost control after open.
Bears took charge below 25,155.
Close near support, but bias cautious.
Bulls must reclaim 25,150+ for recovery, else 25,000 may give way.
🛡 5 Min Intraday Chart
⚔️ Gladiator Strategy Update
ATR: 185.97
IB Range: 83.55 → Medium
Market Structure: Balanced
Trades Triggered:
⏰ 10:05 AM – Short Entry → SL Hit
⏰ 11:10 AM – Short Entry → Target Hit (1:3.6 Risk:Reward)
📊 Support & Resistance Levels
Resistance Zones:
25,125
25,155
25,180 ~ 25,212
25,233
Support Zones:
25,080 ~ 25,060
25,020
25,000 ~ 24,980
24,967 ~ 24,959
24,882
🔮 What’s Next?
A gap-up or stable open may trigger a dead cat bounce toward 25,150–25,180.
A gap-down below 25,050 confirms bearish continuation → next targets: 24,960 / 24,890.
Watch price action around the 25,020–25,060 zone closely.
🧠 Final Thoughts
“Markets are never wrong – opinions often are.”
— Jesse Livermore
Today was a reminder of how expiry day surprises and news flows can flip the narrative. Stay flexible, and keep a bias—but not a blind one.
✏️ Disclaimer
This is just my personal viewpoint. Always consult your financial advisor before taking any action.
Nifty levels - July 25, 2025Nifty support and resistance levels are valuable tools for making informed trading decisions, specifically when combined with the analysis of 5-minute timeframe candlesticks and VWAP. By closely monitoring these levels and observing the price movements within this timeframe, traders can enhance the accuracy of their entry and exit points. It is important to bear in mind that support and resistance levels are not fixed, and they can change over time as market conditions evolve.
The dashed lines on the chart indicate the reaction levels, serving as additional points of significance to consider. Furthermore, take note of the response at the levels of the High, Low, and Close values from the day prior.
We hope you find this information beneficial in your trading endeavors.
* If you found the idea appealing, kindly tap the Boost icon located below the chart. We encourage you to share your thoughts and comments regarding it.
Wishing you success in your trading activities!
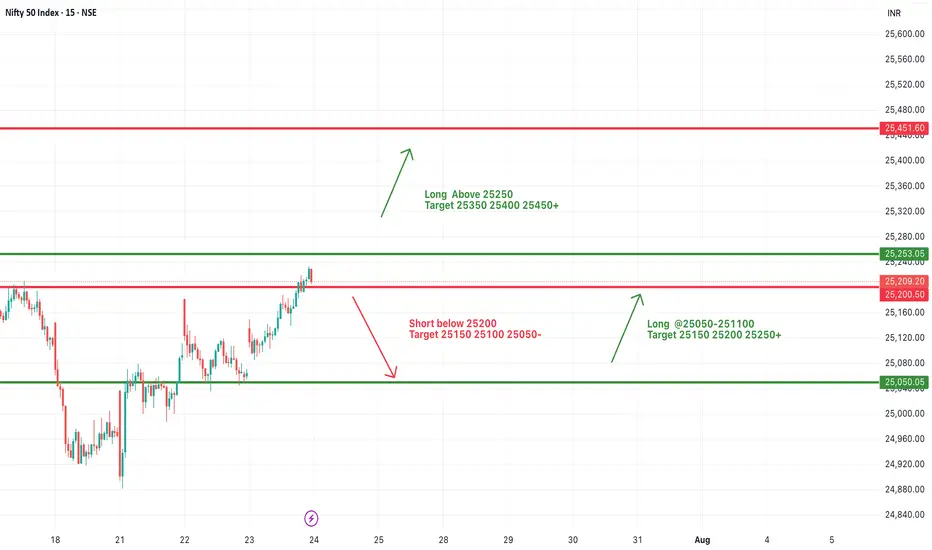
#NIFTY Intraday Support and Resistance Levels - 24/07/2025Nifty is expected to open with a bullish gap-up today, breaching the 25,250 resistance zone. This level has been acting as a consolidation ceiling in recent sessions, and today’s opening above it indicates strong buying momentum in the market.
If Nifty sustains above 25,250, we may witness a fresh upside rally towards the immediate targets of 25,350, 25,400, and 25,450+. A decisive breakout above this zone would mark the continuation of the upward trend and may attract aggressive long-side participation.
On the downside, if Nifty slips and sustains below 25,200–25,250, weakness could resume. A break below 25,200 may lead to a correction toward 25,150, 25,100, and possibly even 25,050-, which will now act as a crucial support zone.
Overall, today's session may remain bullish above 25,250 with momentum trades favored on the long side.
Nifty levels - Jul 24, 2025Nifty support and resistance levels are valuable tools for making informed trading decisions, specifically when combined with the analysis of 5-minute timeframe candlesticks and VWAP. By closely monitoring these levels and observing the price movements within this timeframe, traders can enhance the accuracy of their entry and exit points. It is important to bear in mind that support and resistance levels are not fixed, and they can change over time as market conditions evolve.
The dashed lines on the chart indicate the reaction levels, serving as additional points of significance to consider. Furthermore, take note of the response at the levels of the High, Low, and Close values from the day prior.
We hope you find this information beneficial in your trading endeavors.
* If you found the idea appealing, kindly tap the Boost icon located below the chart. We encourage you to share your thoughts and comments regarding it.
Wishing you success in your trading activities!
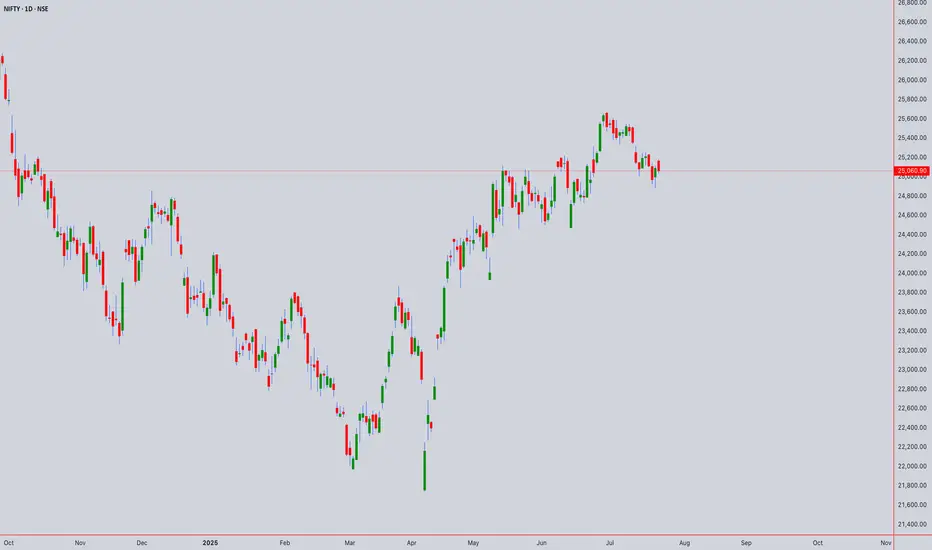
Comprehensive Technical Analysis: NIFTY50 ₹25060.90 as of 22/07Long-Term (Monthly/Weekly) - SWING PERSPECTIVE
Trend & Structure:
Elliott Wave:
Primary Trend: Bullish (Wave 3 or 5 ongoing since 2023).
Current Phase: Likely final sub-wave (Wave 5) targeting ₹25,800–26,200.
Risk: Completion of Wave 5 may trigger a 10–15% correction (ABC pattern) toward ₹22,500–23,000 (38.2% Fib retracement).
Wyckoff & Volume:
Accumulation/Distribution: Monthly volume declining near highs → early distribution signals.
Key Level: Close below ₹24,800 confirms distribution phase (bearish reversal).
Gann Analysis (Price-Time Squaring):
Square of 9:
Key Resistance: ₹25,317 (√25,060 ≈ 158.3; 158.5² = 25,132 → 159² = 25,281).
Major Support: ₹24,649 (157.5²), ₹24,000 (psychological + Gann 45° angle).
Time Cycle:
Aug-Sep 2025 critical for reversal (90-day cycle from April 2025 high).
Ichimoku (Weekly):
Kumo Cloud: Price above cloud → bullish bias.
Lagging Span (Chikou): Above price (26 weeks back) → no congestion.
Warning: Tenkan (9) below Kijun (26) on weekly → momentum loss.
Moving Averages (Weekly):
Bullish Stacking: EMA(20) > EMA(50) > SMA(100) → trend intact.
Support: EMA(20) at ₹24,200
Medium-Term (Daily/4H) - SWING ENTRY
Candlestick Patterns:
Daily: Doji/Spinning Top near ₹25,060 → indecision.
4H: Bearish Shooting Star → resistance at ₹25,150–25,200.
Harmonic Patterns:
Bullish Bat potential (PRZ: ₹24,600–24,750).
Bearish Crab if price rejects ₹25,300 (PRZ: ₹25,280–25,350).
Gann Angles:
1x1 Angle Support (from June 2025 low): ₹24,900 (break → accelerates selling).
Price-Time Squaring:
24th July = 180° from Jan 2025 low → watch for volatility.
RSI + Bollinger Bands (Daily):
RSI(14): 68 (neutral-bearish divergence → weakening momentum).
BB(20,2): Price near upper band (₹25,200) → overbought.
VWAP (4H): Price above VWAP → intraday bullish, but divergence at highs.
Intraday (1H/30M/15M/5M)
Ichimoku (1H):
Tenkan (9) > Kijun (26): Bullish.
Kumo Twist: Support at ₹24,950 (cloud top).
Sell Signal: If price breaks below Kijun (₹25,010).
Moving Averages (30M):
EMA(20): ₹25,040 (intraday support).
Death Cross: EMA(20) < SMA(50) on 15M → short-term bearish.
RSI + BB (15M):
RSI(14): 72 → overbought.
BB Squeeze: Bands narrowing → expect breakout (bearish bias below VWAP).
Gann Intraday Levels (5M):
Resistance: ₹25,100 (1x1 angle), ₹25,180 (2x1).
Support: ₹24,980 (1x1 downside), ₹24,920 (2x1).
Synthesis & Trading Plan
Bullish Scenario (Swing):
Trigger: Hold above ₹24,900 (Gann 1x1) + RSI > 60 on weekly.
Target: ₹25,800–26,200 (Wave 5, Gann Square 159²).
Stop Loss: ₹24,650 (Harmonic Bat PRZ).
Bearish Reversal (Intraday/Swing):
Trigger: Close below ₹24,950 (Ichimoku cloud) + RSI < 50.
Target: ₹24,600 (Harmonic Bat), ₹24,000 (monthly SMA).
Stop Loss: ₹25,200 (Bollinger upper band).
Intraday Levels (23rd July):
Resistance Support
₹25,100 (1H VWAP) ₹25,000 (psych)
₹25,180 (Gann 2x1) ₹24,950 (Ichimoku)
₹25,280 (Sq9) ₹24,800 (daily pivot)
Key Risk Factors
Gann Time Cycle: 24–28 July = high volatility (price-time square).
Elliott Terminal Wave: Wave 5 exhaustion → strict stop losses.
VWAP Divergence: Failure to hold above VWAP on 4H → short.
Instrument: NIFTY50
Strategy:
Swing: Wait for daily close above ₹25,150 (confirms bullish) or below ₹24,800 (bearish).
Intraday: Sell rallies to ₹25,100–25,150 (RSI>70, BB squeeze) for ₹24,950.
Verified Tools:
Gann Square of 9 + Ichimoku for precision entries.
RSI/BB for overbought/oversold filters.
For those interested in further developing their trading skills based on these types of analyses, consider exploring the mentoring program offered by Shunya Trade.(world wide web shunya trade)
I welcome your feedback on this analysis, as it will inform and enhance my future work.
Regards,
Shunya Trade
world wide web shunya trade
⚠️ Disclaimer: This post is educational content and does not constitute investment advice, financial advice, or trading recommendations. The views expressed here are based on technical analysis and are shared solely for informational purposes. The stock market is subject to risks, including capital loss, and readers should exercise due diligence before investing. We do not take responsibility for decisions made based on this content. Consult a certified financial advisor for personalized guidance.
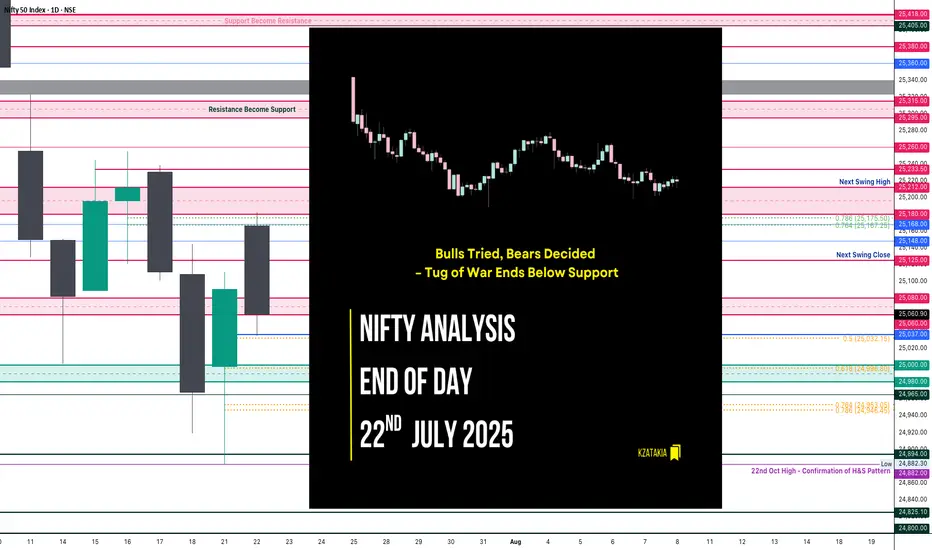
Nifty Analysis EOD – July 22, 2025 – Tuesday🟢 Nifty Analysis EOD – July 22, 2025 – Tuesday 🔴
"Bulls Tried, Bears Decided – Tug of War Ends Below Support"
Nifty opened with an 88-point gap-up, continuing the bullish sentiment, right at the resistance zone of 25,180 ~ 25,212. However, the market opened at the high (OH) and quickly slipped around 100 points to form the Initial Balance (IB). After a brief bounce back to the mean, it faced resistance, leading to a breakdown of IB and further losses of 77 points.
A supportive bounce emerged near 25,060 ~ 25,080, but the price was pushed down again by PDH + VWAP + R1. The day closed below PDC and under the support zone at 25,065, showing bearish dominance despite a volatile tug-of-war between bulls and bears.
Today’s low tested the 0.5 Fibonacci retracement level (from yesterday’s low to today’s high). If this is truly a retracement, 25K must hold in upcoming sessions, and bulls will need to reclaim 25,200 to regain their grip.
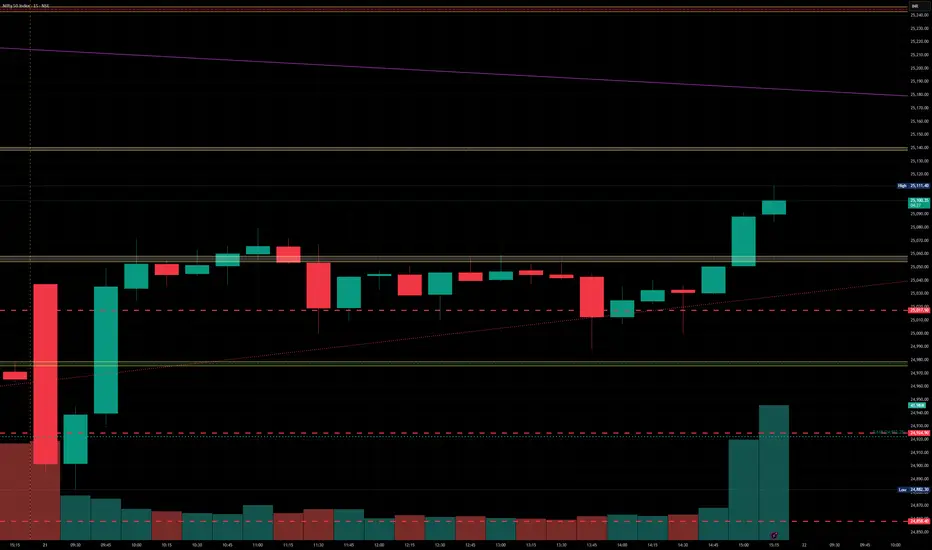
🕯 5 Min Time Frame Chart with Intraday Levels
🕯 Daily Time Frame Chart with Intraday Levels
📊 Daily Candle Breakdown
Open: 25,166.65
High: 25,182.00
Low: 25,035.55
Close: 25,060.90
Change: −29.80 (−0.12%)
Candle Structure:
Real Body: Red (−105.75 pts) → Decent bearish body
Upper Wick: 15.35 pts → Small
Lower Wick: 25.35 pts → Moderate
Interpretation:
Price opened strong but faced selling near 25,180, leading to a steady drop throughout the session. The lower wick shows some buying attempt near 25,035, but the close below open signals bears dominated.
Candle Type:
Bearish candle with moderate lower wick – resembles a Bearish Engulfing setup after a green candle, suggesting profit-booking or fresh selling.
Key Insight:
Sellers defending 25,180–25,200 firmly
Holding above 25,030–25,050 is critical; breaking this could retest 24,950–25,000
Bulls must reclaim 25,120–25,150 for momentum revival
🛡 5 Min Intraday Chart
⚔️ Gladiator Strategy Update
ATR: 182.32
IB Range: 92.6 → Medium
Market Structure: Balanced
Trades Triggered:
10:45 AM – Short Trade → Trailing SL Hit (1:0.8)
12:45 PM – Long Trade → SL Hit
📌 Support & Resistance Levels
Resistance:
25,080 ~ 25,060
25,125
25,168
25,180 ~ 25,212
Support:
25,037
25,000 ~ 24,980
24,965
24,894 ~ 24,882
24,825
24,800 ~ 24,768
🧠 Final Thoughts:
"Markets often dance between zones of power — where bulls flex and bears press. It's not chaos, it's the choreography of sentiment."
The 25,000–25,212 zone continues to be the battlefield. Let’s see who seizes the upper hand tomorrow.
✏️ Disclaimer:
This is just my personal viewpoint. Always consult your financial advisor before taking any action.
Nifty levels - Jul 23, 2025Nifty support and resistance levels are valuable tools for making informed trading decisions, specifically when combined with the analysis of 5-minute timeframe candlesticks and VWAP. By closely monitoring these levels and observing the price movements within this timeframe, traders can enhance the accuracy of their entry and exit points. It is important to bear in mind that support and resistance levels are not fixed, and they can change over time as market conditions evolve.
The dashed lines on the chart indicate the reaction levels, serving as additional points of significance to consider. Furthermore, take note of the response at the levels of the High, Low, and Close values from the day prior.
We hope you find this information beneficial in your trading endeavors.
* If you found the idea appealing, kindly tap the Boost icon located below the chart. We encourage you to share your thoughts and comments regarding it.
Wishing you success in your trading activities!

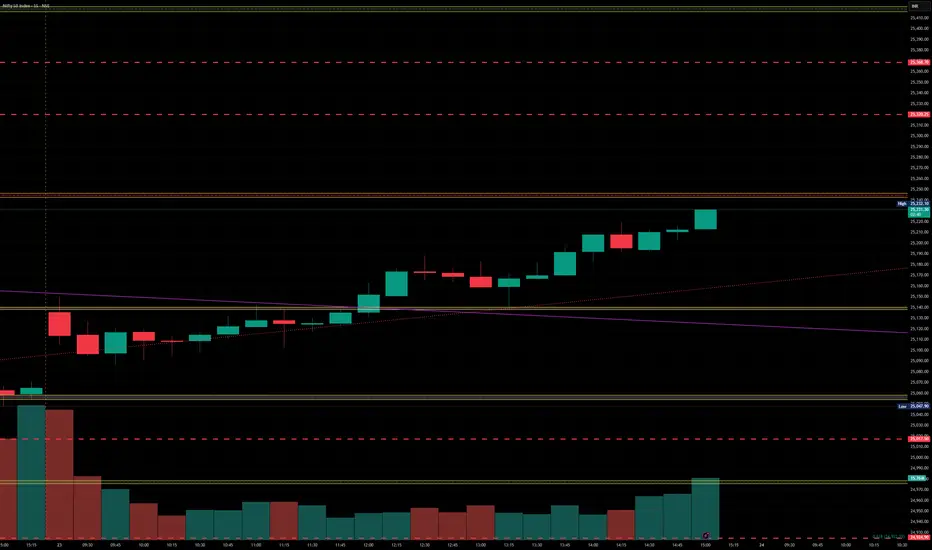
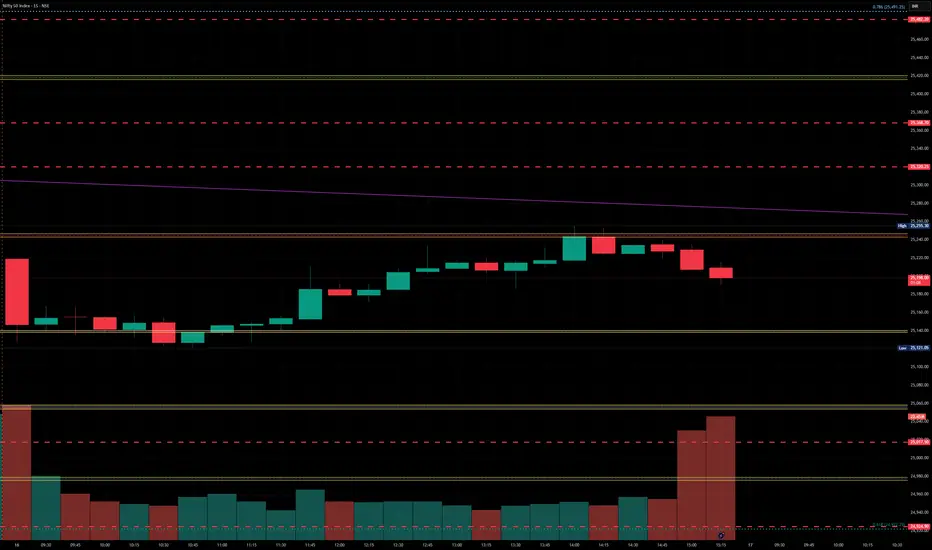
Nifty Analysis EOD – July 21, 2025 – Monday 🟢 Nifty Analysis EOD – July 21, 2025 – Monday 🔴
“Shock, Squeeze, and a Strong Close — Bulls Reclaim 25K”
Today’s move was nothing short of shocking. In the first 45 minutes, Nifty plunged more than 150 points, breaking through key levels and touching 24,882. But what followed was a V-shaped recovery that caught both Friday’s shorts and those who shorted below PDC/PDL completely off guard.
The index powered up to mark a day high of 25,080, and sustained above CPR and VWAP throughout most of the session. A final push came around 2:55 PM, breaking the intraday trendline and CDH, registering a fresh high before closing near the top at 25,090.70.
✅ Bulls not only held 25K — they dominated the battlefield all day, recovering almost everything lost during Friday’s drop.
🕯 5 Min Time Frame Chart with Intraday Levels
🕯 Daily Time Frame Chart with Intraday Levels
🕯 Daily Candle Breakdown
Open: 24,999.00
High: 25,111.40
Low: 24,882.30
Close: 25,090.70
Change: +122.30 (+0.49%)
📊 Candle Structure Breakdown
Real Body: 91.70 points → strong bullish body
Upper Wick: 20.70 points → slight hesitation near highs
Lower Wick: 116.70 points → deep intraday buying from the lows
🔍 Interpretation
Mildly negative open, followed by a sharp 150-point fall
Buyers stepped in strongly near 24,880, triggering a sharp reversal
V-shape recovery sustained above CPR & VWAP, closing near high
Close is not just above open — it’s above Friday’s close and 25K mark
🕯 Candle Type
Hammer-like Bullish Reversal Candle — Long lower wick with green body, signaling strong dip buying and possible short-term trend reversal
📌 Key Insight
Strong defense at 24,880–24,900 created the base for reversal
Close above 25,090 shifts near-term bias in favor of bulls
25,110–25,140 is the next resistance to watch
As long as we stay above 24,900, buyers hold the edge
🛡 5 Min Intraday Chart
⚔️ Gladiator Strategy Update
ATR: 186.31
IB Range: 166.8 → Wide IB
Market Structure: 🟡 Balanced
📉 Trades Triggered:
10:09 AM – Long Trade → ❌ SL Hit
📌 Support & Resistance Levels
Resistance Levels:
25,080 ~ 25,060
25,125
25,168
25,180 ~ 25,212
Support Levels:
25,037
25,000 ~ 24,980
24,965
24,894 ~ 24,882
24,825
24,800 ~ 24,768
💭 Final Thoughts
🧠 “Volatility doesn’t confuse the market — it reveals who’s in control.”Today’s V-shaped reversal erased all doubts from Friday’s fall. Buyers didn’t just defend — they counterattacked and reclaimed 25K with authority.Follow-through above 25,125 on Monday could confirm trend resumption.
✏️ Disclaimer
This is just my personal viewpoint. Always consult your financial advisor before taking any action.

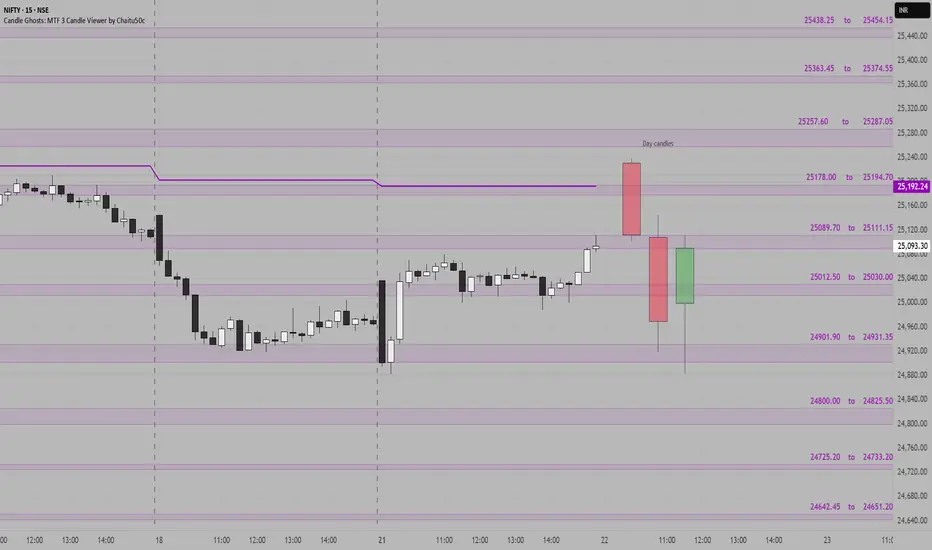
NIFTY SUPPORT & RESISTANCE ZONES FOR 22-07-2025Nifty Support & Resistance Zones for Tomorrow 22-07-2025
Based on price cluster analysis and recent market structure, the following key support and resistance levels have been identified for the upcoming session:
Resistance Zones:
25438.25 – 25454.15
25363.45 – 25374.55
25257.60 – 25287.05
25178.00 – 25194.70
25089.70 – 25111.15
Support Zones:
25012.50 – 25030.00
24901.90 – 24931.35
24800.00 – 24825.50
24725.20 – 24733.20
24642.45 – 24651.20
These levels are derived from high-probability zones where price has shown repeated interaction in the recent past. Watch how Nifty reacts at these zones for potential breakout, reversal, or pullback setups.
Nifty levels - Jul 22, 2025Nifty support and resistance levels are valuable tools for making informed trading decisions, specifically when combined with the analysis of 5-minute timeframe candlesticks and VWAP. By closely monitoring these levels and observing the price movements within this timeframe, traders can enhance the accuracy of their entry and exit points. It is important to bear in mind that support and resistance levels are not fixed, and they can change over time as market conditions evolve.
The dashed lines on the chart indicate the reaction levels, serving as additional points of significance to consider. Furthermore, take note of the response at the levels of the High, Low, and Close values from the day prior.
We hope you find this information beneficial in your trading endeavors.
* If you found the idea appealing, kindly tap the Boost icon located below the chart. We encourage you to share your thoughts and comments regarding it.
Wishing you success in your trading activities!
Nifty Closes Below 25,000 — What Lies Ahead?The Indian market's recent uptrend appears to be losing momentum, as the benchmark Nifty index extended its decline for the third consecutive week, ending just below the important 25,000 mark.
This pullback has been largely driven by weakness in the Financial and IT sectors, with major players like NSE:TCS , NSE:HCLTECH , and NSE:AXISBANK posting disappointing earnings.
From a technical perspective, the index is now approaching a key support zone near 24,900. A decisive break below this level could open the door for a further slide towards 24,500.
Open Interest (OI) data reinforces this view, with the 25,000–24,900 zone seeing the highest put writing, marking it as an immediate support area. On the upside, strong call writing at 25,100 and 25,200 on Friday suggests these levels will act as immediate resistance.
Given the current structure, the outlook for the coming week remains neutral to bearish.
Traders are advised to stay cautious, manage risk effectively, and keep a close watch on these crucial levels.

Nifty Analysis EOD – July 18, 2025 – Friday🟢 Nifty Analysis EOD – July 18, 2025 – Friday 🔴
“Deep Dive Below 25K – Bounce or Breakdown Ahead?”
As we discussed yesterday, a big move was on the cards — and Nifty delivered.
The index started flat to negative, and from the opening tick, sellers took firm control. It sharply broke through multiple key supports: PDC, PDL, S1, the important 25,080–25,060 support zone, swing low, 25,000–24,980, and even 24,965.
Buyers finally showed up near 24,920, a crucial level, and pulled off a modest 86-point recovery. The session ended at 24,968.40, still below the psychological 25,000 mark and the fractal swing low of July 14.
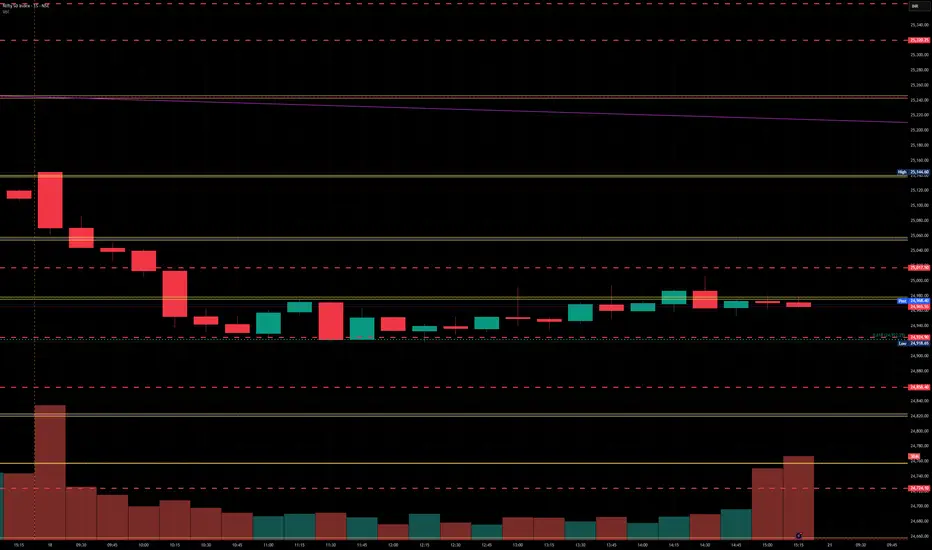
🕯 5 Min Time Frame Chart with Intraday Levels
🔍 Mixed Signals:
✅ Positive: Today’s low aligns with the 0.618 Fib retracement from the June 13 low to June 30 high — potential support zone.
✅ Positive: RSI(3 of 3) shows bullish divergence — early reversal sign?
❌ Negative: Closed below July 14 swing low — weak structural signal.
❌ Negative: Below 25,000 — psychological breakdown.
❓Now the big question: Will this bearish move continue, or is it a fakeout before reversal?
You're still bullish on the overall daily trend, but tactically bearish for intraday until a close above 25,125 confirms strength.
🕯 Daily Time Frame Chart For Additional View
🕯 Daily Time Frame Chart with Intraday Levels
🕯 Daily Candle Breakdown
Open: 25,108.55
High: 25,144.60
Low: 24,918.65
Close: 24,968.40
Change: −143.05 (−0.57%)
📊 Candle Structure Breakdown
Real Body: 140.15 pts → Large red bearish body
Upper Wick: 36.05 pts → rejection near early highs
Lower Wick: 49.75 pts → dip buying near 24,920
🔍 Interpretation
Mildly negative open with early strength attempt near 25,140
Sharp decline through major support zones
Buyers stepped in at 24,920, but recovery lacked follow-through
Close below 25K and key swing low confirms steady intraday selling pressure
🕯 Candle Type
Strong Bearish Candle with both wicks — sellers dominated, but not without some resistance from buyers at the lows.
📌 Key Insight
Short-term bearish momentum confirmed
24,920–24,890 is next critical support; breakdown may extend to 24,882–24,825
Bulls need to close above 25,125+ to reclaim control
🛡 5 Min Intraday Chart
⚔️ Gladiator Strategy Update
ATR: 181.56
IB Range: 126.45 → Medium IB
Market Structure: 🔴 Imbalanced
🟢 Trades Triggered:
09:42 AM – Short Trade → ✅ Trailed SL Hit Profit (R:R = 1 : 3.87)
📌 Support & Resistance Levels
Resistance Levels:
24,980 ~ 25,000
25,080 ~ 25,060
25,125
25,168
25,180 ~ 25,212
Support Levels:
24,965
24,894 ~ 24,882
24,825
24,800 ~ 24,768
💭 Final Thoughts
“Sometimes markets fall not to reverse, but to recharge.”
Today’s drop pierced major support zones, but the bounce from 0.618 Fib hints at possible resilience.
Structure needs clarity — Monday’s session will reveal whether this was a trap or fuel for bears.
✏️ Disclaimer
This is just my personal viewpoint. Always consult your financial advisor before taking any action.

Nifty levels - Jul 21, 2025Nifty support and resistance levels are valuable tools for making informed trading decisions, specifically when combined with the analysis of 5-minute timeframe candlesticks and VWAP. By closely monitoring these levels and observing the price movements within this timeframe, traders can enhance the accuracy of their entry and exit points. It is important to bear in mind that support and resistance levels are not fixed, and they can change over time as market conditions evolve.
The dashed lines on the chart indicate the reaction levels, serving as additional points of significance to consider. Furthermore, take note of the response at the levels of the High, Low, and Close values from the day prior.
We hope you find this information beneficial in your trading endeavors.
* If you found the idea appealing, kindly tap the Boost icon located below the chart. We encourage you to share your thoughts and comments regarding it.
Wishing you success in your trading activities!
Nifty Analysis EOD – July 17, 2025 – Thursday🟢 Nifty Analysis EOD – July 17, 2025 – Thursday 🔴
📉 Sellers Grip Expiry Day — Big Move Loading?
Nifty started again with an OH (Open = High) formation and slipped down 94 points before 10:30 AM, marking the day’s low at 25,144. During this fall, it broke the support zone of 25,212 ~ 25,180. Although a retracement followed, it couldn’t sustain above the mean and eventually broke below the previous day’s low (PDL), closing at 25,111.45.
The weekly expiry was wild and volatile — especially from 12:30 to 2:30 PM. Interestingly, if we consider the total range of the last three sessions, it is just 166 points — well below average. This suggests a phase of consolidation. A significant move may emerge once Nifty decisively breaks the broader zone of 25,000 to 25,255.
🕯 5 Min Time Frame Chart with Intraday Levels
🕯 Daily Time Frame Chart with Intraday Levels
📊 Daily Candle Breakdown
Open: 25,230.75
High: 25,238.35
Low: 25,101.00
Close: 25,111.45
Change: −100.60 (−0.40%)
Candle structure breakdown:
Real body:
Red candle (Close < Open): 25,230.75 − 25,111.45 = 119.30 points → Decent-sized bearish body
Upper wick:
25,238.35 − 25,230.75 = 7.60 points → Very small
Lower wick:
25,111.45 − 25,101.00 = 10.45 points → Small
Interpretation:
Nifty opened slightly lower, made a weak attempt upward, then saw consistent selling throughout the day, closing near the session’s low. The negligible wicks indicate that sellers were in full control, and buyers had little room to fight back.
Candle Type:
A strong bearish candle (almost Marubozu) with very small wicks → Clear dominance by sellers.
Key Insight:
The test of the 25,100 zone again shows weakening bullish strength.
If the next session breaks below 25,100, the fall may extend toward 25,000–25,050.
For bulls to regain short-term momentum, a close above 25,200–25,220 is necessary.
🛡 5 Min Intraday Chart
⚔️ Gladiator Strategy Update
ATR: 176.62
IB Range: 60.85 → Medium IB
Market Structure: Balanced
Trades Triggered:
🕒 10:53 AM – Long Trade → Trailed SL Hit Profit (R:R = 1:0.42)
🧭 What’s Next? / Bias Direction
The market is coiling within a narrow range across multiple sessions, hinting at a potential breakout move.
📌 Watch Zone: 25,000 to 25,255
🔻 A break below 25,000 may open 24,950–24,900
🔺 A close above 25,260 could drive price toward 25,350+
Bias remains neutral-to-bearish unless bulls reclaim 25,220 decisively.
🧱 Support & Resistance Levels
Resistance Levels
25,168
25,180 ~ 25,212
25,260
25,295 ~ 25,315
Support Levels
25,125
25,080 ~ 25,060
25,000 ~ 24,980
24,965
🧠 Final Thoughts
"Structure is key. When levels work, respect them. When they break, adapt."
Three sessions of compression hint at expansion soon — stay alert and trade level-to-level with discipline.
✏️ Disclaimer
This is just my personal viewpoint. Always consult your financial advisor before taking any action.

Nifty levels - Jul 18, 2025Nifty support and resistance levels are valuable tools for making informed trading decisions, specifically when combined with the analysis of 5-minute timeframe candlesticks and VWAP. By closely monitoring these levels and observing the price movements within this timeframe, traders can enhance the accuracy of their entry and exit points. It is important to bear in mind that support and resistance levels are not fixed, and they can change over time as market conditions evolve.
The dashed lines on the chart indicate the reaction levels, serving as additional points of significance to consider. Furthermore, take note of the response at the levels of the High, Low, and Close values from the day prior.
We hope you find this information beneficial in your trading endeavors.
* If you found the idea appealing, kindly tap the Boost icon located below the chart. We encourage you to share your thoughts and comments regarding it.
Wishing you success in your trading activities!
Nifty Analysis EOD – July 16, 2025 – Wednesday🟢 Nifty Analysis EOD – July 16, 2025 – Wednesday 🔴
"Bounce Back with Caution: Bulls Show Up, But Still Not in Full Control"
Nifty started the day on a flat note, but the opening candle turned out to be the day’s high, and from there, it quickly lost 91 points, marking the day’s low at 25,121 within the first hour. The early pressure gave a bearish opening tone, but bulls gradually stepped in.
Around 11:45 AM, Nifty broke above the VWAP–Day Low range, crossed the CPR zone, and then pushed toward PDH. It did make one attempt to break PDH, but failed, resulting in a slow drift downward toward VWAP and CPR into the close. The day ended at 25,212.05, nearly at CPR — a zone of indecision.
📉 The structure shows sharp reversal from the lows, but also clear hesitation near resistance zones. The session was volatile, forming a typical pre-expiry pattern with mixed sentiment. Bulls must take charge tomorrow by crossing the 25,250–25,260 zone to regain strength.
🕯 5 Min Time Frame Chart with Intraday Levels
🕯 Daily Time Frame Chart with Intraday Levels
🕯 Daily Candle Breakdown
Open: 25,196.60
High: 25,255.30
Low: 25,121.05
Close: 25,212.05
Change: +16.25 (+0.06%)
📊 Candle Structure Breakdown
Real Body: 15.45 points → small green body
Upper Wick: 43.25 points
Lower Wick: 75.55 points → significant downside recovery
🔍 Interpretation
Market opened flat, dropped quickly to test 25,120 zone
Strong buying emerged after initial fall
Buyers lifted the index above CPR, but failed to hold breakout above PDH
Candle closes with long lower wick → buyers defended dip, but lacked closing dominance
🕯 Candle TypeSpinning Top with Long Lower Wick — often a neutral to mildly bullish candle, suggesting buying interest at lower levels, but with uncertain momentum.
📌 Key Insight
Bulls clearly defended the 25,120–25,125 support zone
Momentum will only resume above 25,250–25,260, leading to targets around 25,300–25,315
Failure to hold 25,120 could reopen downside toward 25,000–25,050
🛡 5 Min Intraday Chart
⚔️ Gladiator Strategy Update
ATR: 180.99
IB Range: 91.20 → Medium IB
Market Structure: 🟡 Balanced
Trades Triggered
11:34 AM – Long Trade → ✅ Target Achieved, Trailed SL Hit (R:R 1:2.42)
📌 Support & Resistance Zones
Resistance Levels
25,168
25,180 ~ 25,212
25,260
25,295 ~ 25,315
Support Levels
25,125
25,080 ~ 25,060
25,000 ~ 24,980
24,965
💭 Final Thoughts
“Structure is forming — but conviction is lacking. Let expiry day bring clarity. Above 25,260 we fly, below 25,120 we fall.”
✏️ Disclaimer
This is just my personal viewpoint. Always consult your financial advisor before taking any action.

Nifty levels - Jul 17, 2025Nifty support and resistance levels are valuable tools for making informed trading decisions, specifically when combined with the analysis of 5-minute timeframe candlesticks and VWAP. By closely monitoring these levels and observing the price movements within this timeframe, traders can enhance the accuracy of their entry and exit points. It is important to bear in mind that support and resistance levels are not fixed, and they can change over time as market conditions evolve.
The dashed lines on the chart indicate the reaction levels, serving as additional points of significance to consider. Furthermore, take note of the response at the levels of the High, Low, and Close values from the day prior.
We hope you find this information beneficial in your trading endeavors.
* If you found the idea appealing, kindly tap the Boost icon located below the chart. We encourage you to share your thoughts and comments regarding it.
Wishing you success in your trading activities!
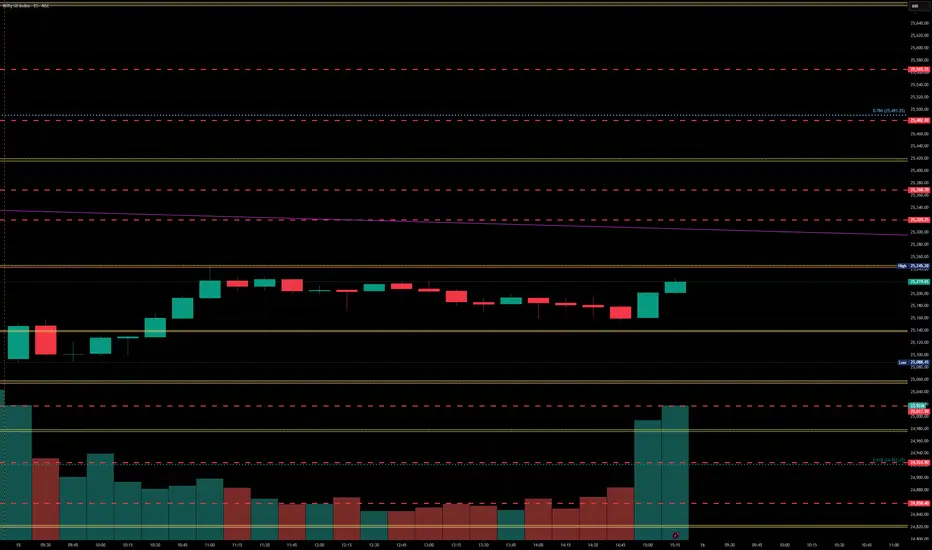
Nifty Analysis EOD – July 15, 2025 – Tuesday🟢 Nifty Analysis EOD – July 15, 2025 – Tuesday 🔴
"Buyers Step Back with Conviction, Reclaim Lost Ground"
Nifty began the session with a flat-to-positive tone, and the first 5-minute candle confidently added 60 points, pushing the index toward 25,150 – aligning with the Previous Day High (PDH). However, the level couldn't hold on the first attempt and Nifty slipped back to the day's open. After a brief consolidation, bulls made a strong comeback.
The second push broke through the PDH, Day High, and the resistance zone of 25,180–25,212, and extended the move up to mark the day’s high at 25,245.20. Post that, the index hovered above the breakout zone and closed solidly at 25,195.80, showing strength and follow-through.
📈 The day’s structure was clean and directional — a healthy bounce and hold above critical levels, reinforcing the idea that buyers are regaining control after last week’s consolidation and weakness.
🕯 5 Min Time Frame Chart with Intraday Levels
🕯 Daily Time Frame Chart with Intraday Levels
🕯 Daily Candle Breakdown
Open: 25,089.50
High: 25,245.20
Low: 25,088.45
Close: 25,195.80
Change: +113.50 (+0.45%)
📊 Candle Structure Breakdown
Real Body: 106.30 points – strong green bullish body
Upper Wick: 49.40 points – profit-taking or resistance at highs
Lower Wick: 1.05 points – negligible dip from open
🔍 Interpretation
Opened flat and quickly built momentum.
Temporary pullback in first 15 minutes was bought into strongly.
Closed with a clean green body, showing clear intraday bullish intent.
Holding above the 25,180–25,212 zone is a big win for bulls.
🕯 Candle Type
Bullish Marubozu-like (strong green body with minimal lower wick) — shows conviction and potential start of a new upswing post recent chop.
📌 Key Insight
25,080–25,100 is now a key base and must be protected.
If Nifty can break and hold above 25,240–25,250, a move toward 25,295–25,315 looks likely.
Failure to hold above 25,180 would be first sign of hesitation.
🛡 5 Min Intraday Chart
⚔️ Gladiator Strategy Update
ATR: 186.18
IB Range: 67.35 → Medium IB
Market Structure: 🟢 Balanced
Trades Triggered
10:30 AM – Long Trade → ✅ Target Achieved, Trailed SL (R:R 1:2.48)
📌 Support & Resistance Zones
Resistance Levels
25,168
25,180 ~ 25,212
25,260
25,295 ~ 25,315
Support Levels
25,125
25,080 ~ 25,060
25,000 ~ 24,980
24,965
💭 Final Thoughts
"Trend is nothing without follow-through — today buyers showed up, but tomorrow they must push past 25,250 to prove it wasn't just a bounce."
✏️ Disclaimer
This is just my personal viewpoint. Always consult your financial advisor before taking any action.

Nifty levels - Jul 16, 2025Nifty support and resistance levels are valuable tools for making informed trading decisions, specifically when combined with the analysis of 5-minute timeframe candlesticks and VWAP. By closely monitoring these levels and observing the price movements within this timeframe, traders can enhance the accuracy of their entry and exit points. It is important to bear in mind that support and resistance levels are not fixed, and they can change over time as market conditions evolve.
The dashed lines on the chart indicate the reaction levels, serving as additional points of significance to consider. Furthermore, take note of the response at the levels of the High, Low, and Close values from the day prior.
We hope you find this information beneficial in your trading endeavors.
* If you found the idea appealing, kindly tap the Boost icon located below the chart. We encourage you to share your thoughts and comments regarding it.
Wishing you success in your trading activities!
Nifty Analysis EOD – July 14, 2025 – Monday🟢 Nifty Analysis EOD – July 14, 2025 – Monday 🔴
"Broken Support, Fought Resistance – Tug of War in Play"
Nifty began the day with a classic Open = High (OH) setup, instantly rejecting any bullish intent. The crucial support zone of 25,080–25,060 was taken out early, and the market went on to mark the day's low at 25,001.95, a level that quickly turned into a decisive battleground.
After a bounce from the low, 25,125 emerged as a stiff resistance that pushed the index back below the broken support zone. For most of the session, the same support zone turned into resistance — a textbook polarity flip. However, in the final hour, Nifty showed resilience and finally closed back above 25,080, ending the session at 25,082.30.
🔄 The structure was full of failed intraday breakouts, signaling confusion and conflict — likely fueled by a wider CPR, imbalanced market structure, and medium IB of 109 pts. It was a low-volatility session, but packed with psychological tests.
🕯 5 Min Time Frame Chart with Intraday Levels
🕯 Daily Time Frame Chart with Intraday Levels
🕯 Daily Candle Breakdown
Open: 25,149.50
High: 25,151.10
Low: 25,001.95
Close: 25,082.30
Change: −67.55 (−0.27%)
📊 Candle Structure Breakdown
Real Body: 67.20 points – small to moderate bearish body
Upper Wick: 1.60 points – negligible upside attempt
Lower Wick: 80.35 points – strong defense from day’s low
🔍 Interpretation
Opened higher but got instantly rejected (OH formation).
Sellers took charge early but failed to hold momentum all the way.
The long lower wick reflects buyer presence at key 25,000 zone.
The close below open but above reclaimed support suggests tug of war — with bulls slightly redeeming themselves by EOD.
🕯 Candle Type
Hammer-like red candle — while bearish on close, the long lower shadow indicates potential exhaustion of selling and hints at reversal if follow-through buying emerges next session.
📌 Key Insight
25,000–25,020 has emerged as crucial near-term support.
A strong open or close above 25,150–25,180 may confirm a bullish reversal setup.
Breakdown below 25,000 opens the door for a fall toward 24,950 or lower.
🛡 5 Min Intraday Chart
⚔️ Gladiator Strategy Update
ATR: 188.77
IB Range: 109.20 → Medium IB
Market Structure: 🔴 Imbalanced
Trades Triggered
09:50 AM – Long Trade → ❌ SL Hit
01:05 PM – Short Trade → ❌ SL Hit
📉 Tough day for directional trades — false breakouts dominated.
📌 Support & Resistance Zones
Resistance Levels
25,125
25,168
25,180 ~ 25,212
25,260
25,295 ~ 25,315
Support Levels
25,080 ~ 25,060
25,000 ~ 24,980
24,965
💭 Final Thoughts
“Reclaimed ground doesn’t mean victory – yet. Watch the next move. Rejection below 25,000 ends the bulls' narrative; a strong move above 25,180 rewrites it.”
✏️ Disclaimer
This is just my personal viewpoint. Always consult your financial advisor before taking any action.
