NIFTY - Trading Levels and Plan for 06-Feb-2025📌 NIFTY TRADING PLAN – 06-Feb-2025
🔹 Previous Close: 23,685.10
🔹 Important Zones Identified:
🟥 Sharp Profit Booking Zone: 24,065 - 24,154🟥 Opening Resistance: 23,848🟧 Opening Support / Resistance: 23,683 - 23,658🟩 Last Intraday Support: 23,567🟢 Buyer's Support: 23,374 - 23,345
📈 Scenario 1: Gap-Up Opening (Above 100+ Points)
If NIFTY opens with a strong gap-up above 23,785, it will move toward the Opening Resistance (23,848) and may attempt to test the Profit Booking Zone (24,065 - 24,154).
🔹 Bullish Strategy:
If NIFTY sustains above 23,848, expect a continuation towards 24,065 - 24,154.
An ideal entry can be on a pullback towards 23,848, with a stop-loss below 23,750.
🔻 Bearish Reversal Plan:
If NIFTY shows rejection around 24,065 - 24,154, a short trade can be initiated.
Target for shorts: 23,848 - 23,685.
Stop-loss for short trades: Above 24,200.
📝 Pro Tip: If NIFTY opens directly in the Profit Booking Zone, avoid aggressive long positions. Wait for a breakout or a reversal setup.
📊 Scenario 2: Flat Opening (Between 23,683 - 23,658)
A flat opening means NIFTY is near the Opening Support / Resistance Zone (23,683 - 23,658). Patience is required to confirm the direction.
🔹 Bullish Plan:
If NIFTY breaks above 23,685 with strong volume, a long trade can be considered.
Targets: 23,743 - 23,848.
Stop-loss: Below 23,650.
🔻 Bearish Breakdown:
If NIFTY breaks below 23,658, expect a decline towards 23,567.
Short trades can be initiated with a stop-loss above 23,700.
📝 Pro Tip: Flat openings often result in choppy movement for the first 15-30 minutes. Let the market establish direction before entering trades.
📉 Scenario 3: Gap-Down Opening (Below 23,567)
If NIFTY opens below 23,567, it enters the Last Intraday Support Zone and may attempt to test the Buyer's Support (23,374 - 23,345).
🔹 Buying Opportunity:
A strong bullish reversal from 23,374 - 23,345 can provide a long opportunity.
Target: 23,567 - 23,685.
Stop-loss: Below 23,300.
🔻 Further Breakdown Plan:
If 23,345 is broken, expect further downside towards 23,200.
Short trades can be initiated with SL above 23,400.
📝 Pro Tip: If NIFTY gaps down but quickly recovers above 23,567, it could be a bear trap—watch for bullish confirmations.
⚠️ Risk Management & Options Trading Tips
✔ For Option Buyers: Select ATM (At-the-Money) strikes to avoid time decay. Enter only when price action confirms the trade.
✔ For Option Sellers: If IV (Implied Volatility) is high, consider selling OTM (Out-of-the-Money) options near key resistance/support levels.
✔ Always use SL: Protect capital! A good Risk-to-Reward (R:R) ratio is essential for long-term success.
✔ Avoid Overtrading: Stick to planned setups—don’t force trades.
📌 Summary & Conclusion
🚀 Bullish above: 23,685 (Target 23,848+)📉 Bearish below: 23,658 (Target 23,567 - 23,345)⚠️ Watch Key Zones: No Trade Zone & Profit Booking Area📊 Expect Volatility: Let the first 15-30 minutes settle before aggressive trades.
⚠️ Disclaimer: I am not a SEBI-registered analyst. This analysis is for educational purposes only. Always do your own research before taking any trades. 📢📊
Niftylevels

Superb closing above Mother and Father Line Resistance. We had a very good closing today by Nifty at 23739 which is above Mother and Father line of resistance but there is a trendline resistance now at 23745 which Nifty was not able to cross today after briefly hovering above it as it made a high of 23762.
The next resistances in line for Nifty if it is able to cross 23745 swiftly will be at 23883 and 24108. Closing above 24108 can bring the Bulls back into the game and take us to the next resistances at 24281, 24596, 24898 and finally 25K+ levels.
Supports for Nifty are at 23663 (Mother Line support), 23619 (Father line support), 23421 and 23222. Below 23222 Nifty will become weak again and in such a scenario Nifty can fall to below 23K levels of 22976, 22797 or even 22316.
Disclaimer: The above information is provided for educational purpose, analysis and paper trading only. Please don't treat this as a buy or sell recommendation for the stock or index. The Techno-Funda analysis is based on data that is more than 3 months old. Supports and Resistances are determined by historic past peaks and Valley in the chart. Many other indicators and patterns like EMA, RSI, MACD, Volumes, Fibonacci, parallel channel etc. use historic data. There is no guarantee they will work in future as markets are highly volatile and swings in prices are also due to macro and micro factors based on actions taken by the company as well as region and global events. Equity investment is subject to risks. I or my clients or family members might have positions in the stocks that we mention in our educational posts. We will not be responsible for any Profit or loss that may occur due to any financial decision taken based on any data provided in this message. Do consult your investment advisor before taking any financial decisions. Stop losses should be an important part of any investment in equity.

nifty50NSE:NIFTY
ONE SHOULD WAIT FOR FURTHER Breakout ON WEEKLY BASIS.
Note :
1. One should go long with a Stop Loss, below the Trendline or the Previous Swing Low.
2. Risk :Reward ratio should be minimum 1:2.
3. Plan your trade as per the Money Management and Risk Appetite.
Disclaimer :
>You are responsible for your profits and loss.
>The idea shared here is purely for Educational purpose.
>Follow back, for more ideas and their notifications on your email.
>Support and Like incase the idea works for you.

NIFTY - Trading levels and Plan for 05-Feb-2025🔹 NIFTY TRADING PLAN – 05-FEB-2025 🔹
📍 Previous Close: 23,707.70
📍 Key Levels to Watch:
🔸 Resistance Zone: 23,743 - 23,845
🔹 Opening Support Zone: 23,591 - 23,644
🟢 Last Intraday Support: 23,491
🟩 Buyers’ Strong Support: 23,345 - 23,388
🎯 Profit Booking Zone: 24,067 - 24,155
🔵 POSSIBLE OPENING SCENARIOS & TRADING STRATEGY 🔵
📈 Gap Up Opening (100+ Points Above 23,807) – Bullish to Cautious Approach
📌 If Nifty opens with a gap-up above 23,807+ , traders should wait for initial price action.
📌 A sustained move above 23,845 can trigger bullish momentum towards 24,067 - 24,155 (Profit Booking Zone).
📌 If Nifty struggles near 23,845 , expect sideways movement or a potential reversal to test 23,743 - 23,707 .
📌 Trade Setup:
✅ Buy on retracement if 23,743 acts as support after a pullback.
🚨 Avoid aggressive buying near resistance without confirmation.
↔️↔️↔️
📊 Flat Opening (Between 23,683 - 23,743) – Key Zone for Decision Making
📌 A flat opening within 23,683 - 23,743 keeps the market in a neutral-to-bullish zone.
📌 If Nifty holds above 23,707 , we can see a push towards 23,845 .
📌 Failure to hold 23,707 might bring weakness towards 23,644 - 23,591 (Opening Support) .
📌 Trade Setup:
✅ If Nifty stays above 23,707 for 15-30 minutes, a breakout trade towards 23,845 is possible.
🚨 If it breaks below 23,644, avoid longs and wait for a deeper support test.
↔️↔️↔️
📉 Gap Down Opening (100+ Points Below 23,607) – Caution Required
📌 A gap-down below 23,607 will bring pressure on support levels.
📌 23,591 - 23,491 is a key demand zone; a strong bounce from here can offer buying opportunities.
📌 If selling continues and Nifty breaks below 23,491 , the next major support is 23,345 - 23,388 .
📌 Trade Setup:
✅ Look for reversal signs near 23,491 - 23,345 before entering long trades.
🚨 If Nifty breaks and sustains below 23,345, expect further downside.
⚠️ RISK MANAGEMENT & OPTIONS TRADING TIPS ⚠️
🔹 Use strict stop-losses based on an hourly close.
🔹 Avoid chasing trades at extreme levels; wait for pullbacks.
🔹 For options trading, consider ATM/ITM contracts for better liquidity.
🔹 Time decay will impact weekly options—exit early if momentum slows.
🔹 Hedge positions if volatility spikes unexpectedly.
📌 SUMMARY & CONCLUSION 📌
✅ Bullish Bias above 23,743 targeting 23,845 - 24,067.
❌ Bearish Break below 23,591 may push towards 23,491 - 23,345.
📊 Key Zone: 23,707 - 23,743—market reaction here will decide the trend.
📌 Wait for confirmation at crucial levels before entering trades!
⚠️ DISCLAIMER ⚠️
🔹 I am not a SEBI-registered analyst. This trading plan is for educational purposes only.
🔹 Please do your own research or consult with a financial advisor before making trading decisions.

#NIFTY Intraday Support and Resistance Levels - 04/02/2025Gap up opening expected in nifty. After opening if nifty starts trading and sustain above 23400 level then expected upside rally upto 23600 in today's session. Expected reversal from this level in nifty. Major downside expected if nifty starts trading below 23350 level.

NIFTY : Trading levels and Plan for 04-Feb-2025📌 NIFTY Trading Plan for 04-Feb-2025
📍 Key Levels:
Resistance for Profit Booking: 23,672
Resistance Zone: 23,544
No Trade Zone (Opening Support/Resistance Zone): 23,345 - 23,422
Opening Support: 23,256
Last Intraday Support: 23,178 - 23,202
Buyer's Support Zone: 22,950 - 22,990
🚀 If NIFTY Opens with a Gap-Up (100+ Points)
A gap-up opening near 23,500+ means price will be closer to the resistance zone. In this case:
If NIFTY faces rejection near 23,544, look for a shorting opportunity with a target of 23,345-23,422.
A strong breakout above 23,544 with good momentum and volume can push NIFTY towards 23,672 (profit booking zone).
If NIFTY consolidates around 23,500 and holds, look for buying opportunities after a retest with a stop-loss below 23,422.
📌 Pro Tip: If you are trading options, watch for IV (Implied Volatility) spikes. Avoid buying options at the open when IV is high. Wait for a pullback or confirmation before entering.
📊 If NIFTY Opens Flat (± 30 Points)
A flat opening means price will likely be inside the No Trade Zone (23,345-23,422). This zone can act as both support and resistance.
Avoid aggressive trades in this zone and wait for a clear direction.
A breakout above 23,422 can push NIFTY towards 23,544.
A breakdown below 23,345 can lead to 23,256 first and then towards 23,178-23,202.
📌 Pro Tip: When trading inside a range, avoid taking large positions. Instead, use Iron Condors or Credit Spreads in options for range-bound profits.
📉 If NIFTY Opens with a Gap-Down (100+ Points)
A gap-down near 23,178 - 23,202 can bring initial buying support. However, if this level breaks, we can see a quick move towards 22,950-22,990.
If NIFTY finds support around 23,178 and reverses, we can go long with a target of 23,256-23,345.
If it struggles near 23,256, this can be a sell-on-rise opportunity for a downward move.
📌 Pro Tip: For put buyers, ensure there is confirmation of weakness before entering. If the market shows strength after the gap-down, avoid holding puts for too long.
📌 Risk Management & Option Trading Tips 🛡️
✅ Keep Stop Loss Tight – Markets can be volatile, and a fixed SL helps in capital protection.
✅ Avoid Trading Inside the No Trade Zone – Let the price break out clearly.
✅ Hedge Your Positions – Use spreads instead of naked options to minimize risk.
✅ Don't Chase the Market – If you miss an entry, wait for the next setup.
📌 Summary & Conclusion 📢
🔹 Bullish Above: 23,422, targeting 23,544 → 23,672.
🔹 Bearish Below: 23,345, targeting 23,256 → 23,178.
🔹 No Trade Zone: 23,345-23,422 (Wait for confirmation before trading).
🎯 Always stick to the plan, manage your risk, and follow the levels carefully.
⚠️ Disclaimer: I am NOT a SEBI registered analyst. This is for educational purposes only. Trade at your own risk.
This plan ensures structured decision-making across all scenarios. Let me know if you need modifications! 🚀📊

Global Markets crack fearing Trump Tariff plans.Global markets cracked downwards today fearing the tariff imposed by the new Government in US. The action has strengthened already strong USD$ as US is trying to flex it's financial muscle. How long this strength in USD can sustain is a question as it is looking far away from support having given an ATH against Rupee. The Tariffs as of now have been imposed by US on Canada, Mexico and China but other countries can also receive a similar treatment including India. So that space has to be watched continuously.
Under such global perfect storm Nifty actually did pretty well to close at 23361 after making a low of 23222 which is a remarkable 139 points recovery. This might be due to the Budget announcements. There is also a talk that RBI might go for a rate cut. This can further give some strength of Financial and Banking and some other stocks. Global factors and FII selling are the main issues along with strength of Dollar that are hampering the Indian market. The results so far have been below par compared YonY but better than some market experts expectation. So even on that front it is a mixed bag.
Supports for Nifty are at: 23222, 23136 and 22976. If we get a closing below 22976 Nifty can fall in a total Bear territory and fall further to 22797, 22316 or further down.
Resistances for Nifty are at: 23381, 23555, 23618 (Father Line Resistance), 23660 is the (Mother line Resistance). After we get a weekly closing above 23660 we can think of getting back to the more bullish territory of 23745, 23883 and finally 24K+ zone. Shadow of the candle right now seems to be neutral to negative.
Disclaimer: The above information is provided for educational purpose, analysis and paper trading only. Please don't treat this as a buy or sell recommendation for the stock or index. The Techno-Funda analysis is based on data that is more than 3 months old. Supports and Resistances are determined by historic past peaks and Valley in the chart. Many other indicators and patterns like EMA, RSI, MACD, Volumes, Fibonacci, parallel channel etc. use historic data. There is no guarantee they will work in future as markets are highly volatile and swings in prices are also due to macro and micro factors based on actions taken by the company as well as region and global events. Equity investment is subject to risks. I or my clients or family members might have positions in the stocks that we mention in our educational posts. We will not be responsible for any Profit or loss that may occur due to any financial decision taken based on any data provided in this message. Do consult your investment advisor before taking any financial decisions. Stop losses should be an important part of any investment in equity.

NIFTY : Trading levels and Plan for 03-Feb-2025NIFTY Trading Plan for 03-Feb-2025
Key Levels to Watch: Resistance Zones: 🔴 Intraday Resistance Zone: 23,622 - 23,672🔴 Profit Booking / Sideways Zone: 23,822
Support Zones: 🟠 Opening Support / Resistance Zone: 23,475 - 23,565🟢 Opening Support at Retracement: 23,367🟢 Last Intraday Support (Must Try Zone): 23,229 - 23,259🟢 GAP-UP Opening (100+ Points) (Typically above 23,600 region)
➡️ If NIFTY opens above 23,565 and sustains, we need to observe price action at 23,622 - 23,672 (intraday resistance zone).
Bullish Scenario: If price consolidates above 23,672 and breaks out with volume, expect a rally towards 23,822 (profit booking zone). 📈📌 Entry: Above 23,672🎯 Target: 23,750 - 23,822❌ Stop Loss: Below 23,600
Bearish Rejection: If price rejects from 23,672 and fails to sustain, expect a pullback towards 23,500 - 23,475 .📌 Entry: Below 23,620 after confirmation🎯 Target: 23,500 - 23,475❌ Stop Loss: Above 23,680
📝 Educational Tip: In strong gap-up scenarios, avoid chasing the market immediately. Let the price consolidate near key resistance levels before taking a trade.
↔️ Sideways Possibility: If NIFTY stays between 23,565 - 23,672 , it may remain range-bound. Wait for a breakout.
⚖️ FLAT Opening (Near 23,470 - 23,500) ➡️ A flat opening would indicate market indecision and a need for further confirmation.
Bullish Bias: If price takes support at 23,475 - 23,500 and starts moving up, it can retest 23,622 , then 23,672 .📌 Entry: Above 23,500 after bullish confirmation🎯 Target: 23,622 - 23,672❌ Stop Loss: Below 23,450
Bearish Breakdown: If NIFTY breaks below 23,475 , expect a move towards 23,367 or even 23,259 (last intraday support).📌 Entry: Below 23,475🎯 Target: 23,367 - 23,259❌ Stop Loss: Above 23,525
📝 Educational Tip: Flat openings require patience. Let the market establish a clear direction before entering. Avoid overtrading in a choppy market.
🔴 GAP-DOWN Opening (100+ Points) (Typically below 23,375)
➡️ If NIFTY opens below 23,367 , it indicates weakness and possible downside towards 23,259 - 23,229 .
Bearish Continuation: If price sustains below 23,367 , expect selling pressure towards 23,259 and 23,229 .📌 Entry: Below 23,367🎯 Target: 23,259 - 23,229❌ Stop Loss: Above 23,400
Bounce Back Scenario: If NIFTY takes support at 23,259 and shows strong reversal, we may see a move back towards 23,367 or even 23,475 .📌 Entry: Above 23,275 after confirmation🎯 Target: 23,367 - 23,475❌ Stop Loss: Below 23,220
📝 Educational Tip: In gap-down scenarios, watch for institutional buying or aggressive selling. Avoid counter-trend trades without confirmation.
📌 Risk Management Tips for Options Traders ✅ Trade with Defined Risk: Always set a stop loss before entering a trade.✅ Avoid Overleveraging: Keep position sizes within your risk tolerance.✅ Watch for Volatility: Sudden spikes in IV (Implied Volatility) can impact options pricing.✅ Exit at Key Levels: If a trade reaches resistance/support, book partial profits.✅ Use Spreads for Safety: Instead of naked options, consider spreads to minimize risk.
📊 Summary & Conclusion Gap-Up: Watch for resistance at 23,672 ; breakout targets 23,822 . Flat Opening: Key support at 23,475 ; break above 23,500 can lead to bullish movement. Gap-Down: Below 23,367 , expect 23,259 - 23,229 ; bounce possible from support.
🛑 Disclaimer: I am not a SEBI-registered analyst. This analysis is for educational purposes only. Trade at your own risk.
🚀 Happy Trading & Stay Disciplined! 💰

Superb weekly closing with Bullish Engulfing candle by Nifty. Superb weekly closing at 23508 with a closing above 50 Weeks EMA (Mother line) which was at 23423. This came along with Bullish Engulfing candle by Nifty now all eyes on Nirmalaji (Indian FM) to deliver a great budget and turnaround this bullish candle into a proper Bull rally. Now the only thing that can stop us and fizzle the rally would be a dank budget.
Supports for Nifty remain at 23136 and 22838. Below 22838 the rally can fizzle out into the bear territory again. In such a scenario Bears can drag Nifty further down to 22316, 21869. Below 21869 major support will be near 200 Weeks EMA at 19578. Historical resistances for Nifty based on previous Peaks and Valleys can be at 23883 (Trend line resistance), 24281 and 24904. After getting a closing above 24904 market can think of regaining 25K or even 26K levels. RSI is entering the Bull Zone as well with closing this week at 45.60. RSI Resistance is at 47.49 that is something to look at.
The above information is provided for educational purpose, analysis and paper trading only. Please don't treat this as a buy or sell recommendation for the stock or index. The Techno-Funda analysis is based on data that is more than 3 months old. Supports and Resistances are determined by historic past peaks and Valley in the chart. Many other indicators and patterns like EMA, RSI, MACD, Volumes, Fibonacci, parallel channel etc. use historic data. There is no guarantee they will work in future as markets are highly volatile and swings in prices are also due to macro and micro factors based on actions taken by the company as well as region and global events. Equity investment is subject to risks. I or my clients or family members might have positions in the stocks that we mention in our educational posts. We will not be responsible for any Profit or loss that may occur due to any financial decision taken based on any data provided in this message. Do consult your investment advisor before taking any financial decisions. Stop losses should be an important part of any investment in equity.

#NIFTY Intraday Support and Resistance Levels - 31/01/2025Gap up opening expected in nifty. Expected opening near 23350 level. After opening if nifty starts trading and sustain above 23400 level then expected strong upside rally upto 23600+ level in opening session. Any downside movement expected below 23350 level. Important support level for nifty is 23100 if nifty starts trading below this level then expected sharp downside movement

Nifty Review & Analysis - DailyPrice Action :
Nifty showed Strenght and closed in green for 2 consicutive days
Technicals:
Nifty opened in green and built on it. A small profit booking was see at 23300 levels may be due to monthly expiry but over all looked strong and stable but couldn’t close above 20Dema but managed to close above 10Dema.
The momentum indicators, RSI - Relative Strength Index improved to 45
Support/Resistance
Major Support 22900
Immediate Support 23100
Immediate Resistance 23350
Major Resistance 23500
Trend:
Overall Trend is Bearish but short term Nifty is bit positive if trades above 22300
Options Data:
Monthly Options data reading not clear as it was expiry day
Weekly Options data suggests huge Put unwinding seen at 23000 and Call Build up seen at 23000 suggesting Resistance
PCR improved to 0.7 which is Bearish
Futures Data:
FII Long/Short ratio improved to 22%/78%
Nifty Futures price was in neagative, a decrease in price alongside an increase in Open Interest (OI) typically indicates a build-up of short positions in the market, which is generally considered a bearish signal as more traders are betting on the price to fall further
Outlook for Next Session:
Nifty in sideways to positive
Approch:
Long only above 23270
avoid shorts till 22800 taken down convincingly
Wait for today’s High or Low to break and sustaines for further direction
My Trades & Positions:
still holding Long in Feb Series CE

Nifty trying to stage a comeback but important hurdles coming upNifty is trying to stage a comeback but there are important hurdles coming up 23328 and 23883 has a lot of obstacles for the rising Nifty based on the historical data. (Historical meaning the data which is At Least 3 months or older).
The important resistances for Nifty here are 23328 (June 24 peak) followed by Father line resistance (200 day's EMA on daily chart at 23623.). The mother line resistance (50 day's EMA) which is at 23687. After we get a closing above this zone the next resistance will be near 23883. Once we get a closing above 23883 we can think of gaining back 24K levels.
Supports for Nifty now remain at 22838, 22316 and 21869 which is near the lows of June 4th 2024. Shadow of the candle is currently positive but near the resistances mentioned earlier there can be pressure on Nifty.
Disclaimer: The above information is provided for educational purpose, analysis and paper trading only. Please don't treat this as a buy or sell recommendation for the stock or index. The Techno-Funda analysis is based on data that is more than 3 months old. We do not guarantee any success in highly volatile market or otherwise. Stock market investment is subject to market risks which include global and regional risks. This is a spot Nifty analysis based on Historical data as mentioned earlier. We will not be responsible for any Profit or loss that may occur due to any financial decision taken based on any data provided in this message. Do consult your investment advisor before taking any financial decisions. Stop losses should be an important part of any investment in equity.

NIFTY : Trading levels and Plan for 31-Jan-2025📌 Nifty Trading Plan – 31st January 2025 📈🔥
A structured trading plan is essential for navigating market movements with confidence. Let's analyze Nifty for 31st January 2025, incorporating key levels and different opening scenarios to optimize trade entries and exits.
📍 Key Levels:
Opening Resistance / Sideways / Profit Booking Zone: 23,415 - 23,500
Last Intraday Resistance: 23,677
Opening Support / Resistance: 23,227 - 23,214
Opening Support Zone: 23,047 - 23,108
Last Intraday Support: 22,897
🚀 Scenario 1: Gap-Up Opening (100+ points above 23,400)
If Nifty opens above 23,400 , it will enter the profit booking zone of 23,415 - 23,500 , where resistance may come into play. A cautious approach is required to avoid getting trapped in a false breakout.
If Nifty sustains above 23,500 , a move towards 23,677 (last intraday resistance) is possible.
If price faces rejection at 23,500 , expect a pullback to 23,415 . Failure to hold this level may lead to further decline toward 23,297 .
Avoid chasing long positions immediately; wait for a retest of support zones for better risk-reward trades.
👉 Pro Tip: If 23,500 is decisively broken with strong volume, it may trigger a fresh rally, offering buying opportunities on dips.
📊 Scenario 2: Flat Opening (23,250 - 23,400)
A neutral start within this range suggests the market is waiting for direction. Here’s how to approach it:
If Nifty holds 23,227 - 23,214 , it could attempt a gradual rise towards 23,400+ .
A breakout above 23,400 will open doors for an upside move toward 23,500 .
A failure to hold 23,214 may push the index down to test the 23,108 - 23,047 support zone.
Traders should watch for price action near 23,227 , as it could act as an intraday pivot for directional moves.
👉 Pro Tip: In a sideways market , consider using options scalping strategies rather than directional trades.
📉 Scenario 3: Gap-Down Opening (100+ points below 23,200)
A weak opening below 23,200 could indicate short-term bearishness. It’s important to assess whether Nifty finds support at lower levels or continues declining.
If Nifty holds 23,108 - 23,047 , expect a pullback rally toward 23,214 - 23,227 .
A breakdown below 23,047 can accelerate selling pressure toward 22,897 (last intraday support).
Look for bullish reversal signs near 23,047 - 23,000 before considering long positions.
If the market forms a lower high after a gap-down, follow the trend rather than trying to catch a falling knife.
👉 Pro Tip: If Nifty struggles to reclaim 23,214 after a gap-down, selling on rise could be a better approach.
🛑 Risk Management & Options Trading Tips: 🎯
Always define a stop-loss before entering a trade to protect your capital.
Avoid overleveraging in uncertain market conditions—risk management is key! 💰
In case of high volatility , wait for confirmation instead of chasing trades impulsively.
Consider hedging strategies (like spreads) to limit losses in options trading.
Check Open Interest (OI) data before trading options to gauge market sentiment.
📌 Summary & Conclusion:
✅ Nifty is at a critical juncture, with 23,227 - 23,214 acting as an opening pivot zone.
✅ Bullish Bias above 23,500 , targeting 23,677 .
✅ Bearish Outlook below 23,047 , targeting 22,897 .
✅ Discipline & patience are crucial—wait for confirmation before taking positions! 🚀
⚠️ Disclaimer: I am not a SEBI-registered analyst. This plan is for educational purposes only . Trade at your own risk and manage capital wisely! 📊🔥

#NIFTY Intraday Support and Resistance Levels - 30/01/2025Flat opening expected in nifty. After opening possible nifty will consolidate in between the range of 23100-23200 level. If nifty gives upside breakout of 23200 level then expected bullish rally upto 23350+ into today's session. Strong downside move expected below 23100 level. Downside next support level at 22900 for nifty in today's session.

Bulls Make a major counter attack to Pull Nifty upwards. Today the Bulls fought back very well and against all odds were able to close Nifty much above Mother line of hourly chart. Nifty closed at 23163 and the Mother line support now is at 23108. If Bulls are able to keep Nifty aflot above this level and drive it higher they will have potential to make a come back into the game which was dominated one-sidedly by Bears since a long time. Not only Nifty we saw Mid and Small cap index also fight back today. The negative observation is that there is a trendline resistance just near today's high as you can see in the chart at 23183. So closing much above that level tomorrow will be really helpful.
The supports for Nifty now remain at: 23108 (Mother Line Major support), 23032, 22919, 22776 (Major trend line support), 22465 and 22100 will be the channel Bottom support.
The Resistances for Nifty now will be at: 23183 (Major Trend line resistance), 23354, 23465 (Major Father line Resistance of 200 hours EMA), 23542, 23726, 23892 (Major Channel top resistance). If channel top resistance is broken in the current rally Bulls will be back in the game and can drag the index further upwards towards 24060 and 24226. Above 24226 monthly closing there is Nifty landing again in Pure Bull territory.
Good come back by bulls. Shadow of the candle now is neutral but it can become positive if we get a closing above 23183 tomorrow.
Disclaimer: The above information is provided for educational purpose, analysis and paper trading only. Please don't treat this as a buy or sell recommendation for the stock or index. We do not guarantee any success in highly volatile market or otherwise. Stock market investment is subject to market risks which include global and regional risks. I or my clients might have positions in the stocks that we mention in our posts. We will not be responsible for any Profit or loss that may occur due to any financial decision taken based on any data provided in this message. Do consult your investment advisor before taking any financial decisions. Stop losses should be an important part of any investment in equity.

NIFTY : Trading levels and plan for 30-Jan-2025📊 Nifty Trading Plan for 30-Jan-2025
This trading plan covers all possible opening scenarios (Gap-Up, Flat, and Gap-Down) along with crucial resistance and support levels. Follow these levels carefully to maximize your trades.
📈 Scenario 1: Gap-Up Opening (100+ points above 23,176)
If Nifty opens with a gap-up, it will likely test the resistance levels. Key focus points:
🔹 Opening Resistance Zone: 23,253 – 23,287 – If price sustains above this level, it can move towards 23,416. Consider call option trades if momentum remains strong with stop-loss at 23,200.
🔹 Major Resistance Zone: 23,416 – This is a crucial level where sellers might become active. Avoid chasing longs here and book profits.
🔹 If Nifty rejects from 23,253, watch for a retracement towards 23,176 before taking fresh trades.
💡 Pro Tip: Always wait for a retest and confirmation before entering a trade in a gap-up market.
📉 Scenario 2: Flat Opening (Near 23,176)
A flat opening means price action will revolve around the Opening Support / Resistance Zone: 23,176 – 23,200. Key levels to monitor:
🔹 If price sustains above 23,200, expect bullish movement towards 23,253, followed by 23,287. Enter call options only after a breakout confirmation.
🔹 If price rejects from 23,176, it may slip towards 23,142, and if this breaks, expect a drop to 23,059. Put options can be considered here.
🔹 Avoid trading in the Opening Support / Resistance Zone unless a clear breakout/breakdown happens.
💡 Pro Tip: Flat openings often create a trap in the first 15 minutes. Let the market settle before taking a position.
⬇️ Scenario 3: Gap-Down Opening (100+ points below 23,176)
A bearish gap-down could test support levels. Here’s how to trade it:
🔹 Opening Support Zone: 23,059 – If this zone holds, expect a pullback to 23,176. A strong reversal from this level can provide a good call option opportunity.
🔹 If 23,059 breaks, expect further downside towards 22,983, followed by 22,871 (Golden Retracement Zone). Look for put options with SL at 23,059.
🔹 If price sustains below 22,871, expect high volatility. Avoid aggressive long positions.
💡 Pro Tip: In gap-down markets, avoid catching falling knives. Look for proper support confirmation before entering long trades.
🛡️ Risk Management Tips for Options Trading
🔹 Keep a fixed risk per trade (1-2% of capital) to avoid big losses.
🔹 Use ATM (At-the-Money) or slightly OTM (Out-of-the-Money) options for better liquidity.
🔹 Don't overtrade. If your first 2 trades fail, step back and analyze the market.
🔹 Follow proper stop-loss levels to protect capital.
📊 Summary and Conclusion
Resistance Zones: 23,200, 23,253-23,287, 23,416
Support Zones: 23,176, 23,142, 23,059, 22,983, 22,871
Opening Support / Resistance Zone: 23,176 – 23,200 (Wait for breakout/breakdown)
📌 Stick to the plan and manage risk wisely. Market structure matters more than emotions!
⚠️ Disclaimer: I am not a SEBI-registered analyst. This trading plan is for educational purposes only. Trade at your own risk. 😊

#NIFTY Intraday Support and Resistance Levels - 29/01/2025Gap up opening expected in nifty. After opening if it's sustain above 23050 level then upside rally expected in index. Major downside possible if nifty starts trading below 22950 level. This downside can be goes upto the 22700 level after breakdown of 22950 level. 22950-23050 level act as a consolidation zone for nifty.

Nifty tried unsuccessfully to close above Mid-channel resistanceNifty today tried unsuccessfully to close above mid-channel resistance but failed. After making a high of 23137 it again closed below 23K at 22957 not able to hold on to 23K+ levels. There was positive movement in Banks, Finance, Auto and Services. The laggards were Pharma, Mid-cap, Small cap, Public sector, IT, Metal and FMCG.
Low of the day was 22857 if this level hold tomorrow and if Nifty can Push itself above 23137 we can see movement further northwards to 23357 or even 23542. Real momentum will build if we get a closing above Father line at 23632 and Mother line above 23727. Till that time we can see wild swings on either sides.
Supports for Nifty remain at 22848 and 22763. Below 22763 we may see Nifty stumbling towards 22465, 22175 or even 21886 levels. It is still hanging by the thread. Shadow of the candle right now is positive to neutral.
Disclaimer: The above information is provided for educational purpose, analysis and paper trading only. Please don't treat this as a buy or sell recommendation for the stock or index. We do not guarantee any success in highly volatile market or otherwise. Stock market investment is subject to market risks which include global and regional risks. I or my clients might have positions in the stocks that we mention in our posts. We will not be responsible for any Profit or loss that may occur due to any financial decision taken based on any data provided in this message. Do consult your investment advisor before taking any financial decisions. Stop losses should be an important part of any investment in equity.

NIFTY : Trading Levels and Plan for 29-Jan-2025Here's your detailed trading plan for NIFTY on 29-Jan-2025, covering all possible opening scenarios with actionable insights.
📈 Scenario 1: Gap-Up Opening (200+ points above 23,088)
If Nifty opens with a gap-up, watch for resistance levels around 23,231-23,288:
🔹 Resistance Zone: 23,231-23,288 – Wait for confirmation before initiating a put option trade, targeting 23,088-23,024 if the level holds.
🔹 If 23,288 breaks with volume, expect a rally towards 23,350+. Look for call option trades with a strict stop-loss below 23,231.
🔹 Avoid overtrading near 23,088-23,231 without clear signals.
💡 Pro Tip: Wait for a 15-minute candle close above/below key levels for confirmation.
📉 Scenario 2: Flat Opening (Near 22,976-23,024)
A flat opening brings the market closer to the No Trade Zone (22,963-23,024). Breakout confirmation is crucial:
🔹 If Nifty sustains above 23,024, it may test 23,088 and later 23,231 – Ideal for call option trades.
🔹 If Nifty breaks 22,963, expect weakness towards 22,862-22,829. Look for put option trades with a stop-loss above 23,024.
💡 Pro Tip: A breakout from the No Trade Zone often leads to strong directional moves. Let the market decide the trend.
⬇️ Scenario 3: Gap-Down Opening (200+ points below 22,963)
A bearish gap-down will test buyer strength at crucial support zones:
🔹 Support Zone: 22,862-22,829 – Look for reversal signs. If the price holds, call options targeting 22,963-23,024 can be considered.
🔹 If 22,829 breaks decisively, expect further downside towards 22,637. Plan for put option trades, keeping SL above 22,862.
🔹 Be cautious near 22,637 as it might act as a reversal zone.
💡 Pro Tip: After a gap-down, monitor institutional activity before taking a trade. Avoid bottom fishing too early.
🛡️ Risk Management Tips for Options Trading
🔹 Use a fixed percentage of capital per trade (1-2%) to manage risk effectively.
🔹 Avoid chasing trades—let the market confirm levels.
🔹 Always use stop-loss and avoid averaging losing positions.
🔹 Prefer at-the-money (ATM) or slightly out-of-the-money (OTM) options for liquidity.
📊 Summary and Conclusion
🔹 Key Resistance Zones: 23,088, 23,231, 23,288
🔹 Key Support Zones: 22,963, 22,862, 22,829, 22,637
📌 Follow the plan, avoid emotional trading, and stick to defined levels. The market rewards discipline and patience!
⚠️ Disclaimer: I am not a SEBI-registered analyst. This plan is for educational purposes only. Trade responsibly. 😊

Short
I’ve been shorting most of the Nifty 50 index stocks ever since it breached 24,750, holding onto my position with strategic exits in case the market rallies, though I see that as highly unlikely at this point. As long as 24,750 holds we can support this bearish view.
At this stage, we’re either heading back to around 24,200 or possibly correcting further to a minimum target of 20,200 over the next few months. Even if we see a short-term rally, it’s likely to be brief. The more plausible scenario is the market eventually heading towards 20,200.
It’s amusing to watch the media, retail investors, and brokers get so excited about a 200-point rally. What they fail to realize is that this optimism is largely driven by retail traders chasing the market without considering the underlying risks. They often end up getting trapped at highs or lows, stuck in positions when a pullback or rally inevitably happens.
I’ve always stressed the importance of proper risk management in my articles. Growing wealth is not just about making big bets—it’s about sustainable growth. Brokers, however, don’t necessarily share this focus. Their main interest lies in collecting commissions, regardless of whether the market goes up or down. The same can be said for exchanges and even the government, all of whom profit from the trading activity regardless of the retail investor’s success or failure.
Investors need to understand that chasing short-term moves and focusing solely on commission-driven narratives can lead to long-term losses. Wealth building is more about having the right strategy, managing risk, and not getting swayed by market noise.

#NIFTY Intraday Support and Resistance Levels - 28/01/2025Gap up opening expected in nifty near the 22950 level. After opening it will face resistance at this level and chances of reversal in index. If reversal occurs at this level then expected downside movement upto 22700- in today's session. Any bullish rally now only expected if nifty starts trading and sustain above 23050 level.

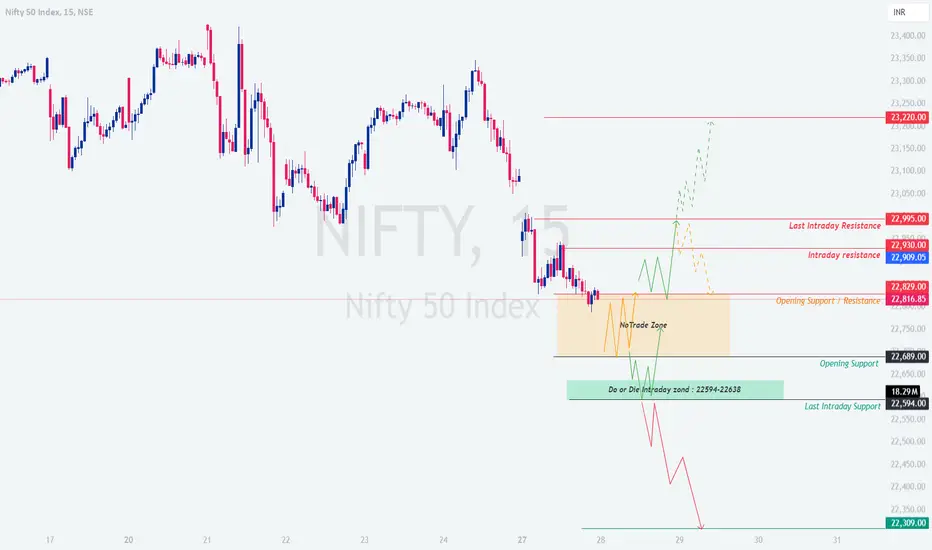
NIFTY : Trading levels and Plan for 28-Jan-2025📊 NIFTY Trading Plan for 28-Jan-2025 📊
📈 Key Levels to Watch:
Opening Support/Resistance Zone: 22,816-22,829
Intraday Resistance Zone: 22,909-22,930
Last Intraday Resistance Zone: 22,995
No Trade Zone: 22,816-22,829
Do or Die Intraday Zone: 22,594-22,638
Final Support Zone: 22,309
🌟 Scenario 1: Gap-Up Opening (100+ points above 22,909) 🌟
If NIFTY opens significantly above 22,909:
✅ Wait for Retest: Do not jump into trades immediately. Allow the index to retest the 22,909-22,930 zone for confirmation of strength.
📈 Action Plan: If the price holds above 22,930, initiate long trades targeting 22,995 (last resistance) and further extending to 23,220. Keep a stop-loss below 22,900.
🚫 Caution Zone: If resistance is observed near 22,995, consider profit booking or tightening stop-loss. Avoid fresh longs unless a breakout above 22,995 is confirmed.
💡 Pro Tip: Use bull call spreads to manage risk while capturing potential upside gains.
📉 Counter Strategy: If a bearish rejection candle forms near 22,995, short trades targeting 22,909 can be considered with a tight stop-loss.
🔄 Scenario 2: Flat Opening (Near 22,816) 🔄
If NIFTY opens flat or within the No Trade Zone: 22,816-22,829:
⚪ Avoid Immediate Trades: This range is indecisive. Wait for a breakout above 22,829 or a breakdown below 22,816.
🔼 Breakout Strategy: If the price breaks and sustains above 22,829, go long targeting 22,909-22,930. Use a stop-loss below 22,800.
🔽 Breakdown Strategy: If the price breaks below 22,816, initiate short trades targeting 22,689. Maintain a stop-loss above 22,850.
💡 Pro Tip: In a flat market, time decay in options can work against you. Use directional trades or hedged strategies.
🚦 Options Strategy: Consider a straddle or strangle strategy around the no-trade zone to capitalize on a potential breakout or breakdown.
🌧️ Scenario 3: Gap-Down Opening (100+ points below 22,816) 🌧️
If NIFTY opens below 22,816:
📉 Key Zone to Watch: The Do or Die Zone: 22,594-22,638 is critical. Look for bullish price action (e.g., hammer or bullish engulfing candles) for a potential reversal.
✅ Action Plan: If the price holds above 22,594, initiate long trades targeting 22,816. Use a stop-loss below 22,580.
🔥 Aggressive Selling Levels: If the price sustains below 22,594, further downside towards 22,309 is possible. Short trades can be initiated with strict risk management.
💡 Pro Tip: During gap-down scenarios, volatility spikes. Use hedging strategies (e.g., protective puts) to limit losses.
🚫 Avoid Overtrading: Gap-downs can lead to whipsaws. Wait for confirmation before entering trades.
🛡️ Risk Management Tips 💡:
🎯 Always follow your stop-loss and avoid emotional decisions.
🔥 Never risk more than 2% of your trading capital on a single trade.
🧘 Stay patient and disciplined. Avoid trading in the No Trade Zone .
📊 Utilize options strategies to hedge risk and protect your capital.
📝 Summary & Conclusion:
Key Zones to Monitor:
Resistance: 22,909-22,930 , 22,995 , and 23,220 .
Support: 22,816 , 22,689 , and 22,594-22,309 .
Gap-ups favor long trades above 22,909 , while gap-downs focus on supports like 22,594 .
Stick to your plan and avoid trades in the No Trade Zone unless a breakout or breakdown occurs.
⚠️ Disclaimer:
I am not a SEBI-registered analyst . All information shared is for educational purposes only. Please consult with a financial advisor before making any trading decisions.
Nifty to test 23550 ?NSE:NIFTY is Nifty ready to test 23,550 ?
It seems nifty to hold 22,500 in Feb and to test 23,500 on your side
