Nifty Daily Trend AnaysisMy Observation:
Nifty Spot had been consolidating within a range for 16 consecutive trading sessions. Today, it broke out decisively and is now trading above that range. If it sustains this breakout, it indicates bullish momentum and the index could potentially rally towards the targets of 25,800 and 26,500.
However, if the market slips back into the previous range, I anticipate support around 24,600—although this scenario seems less likely given the strength of today’s breakout.
Disclaimer: This is purely my personal view and is shared for educational purposes only. Please do your own analysis before making any trading decisions.
Niftylevels

#NIFTY Intraday Support and Resistance Levels - 09/06/2025Nifty is opening with a gap-up above the 25050 level, continuing the recent bullish momentum. The index has broken out of its previous range and is now hovering near a key breakout zone.
If Nifty sustains above 25050–25100, we could see further upside toward 25150, 25200, and 25250+. A clean breakout above 25250 may unlock extended targets at 25350, 25400, and 25450+.
However, if the index fails to hold above 25000 and slips back below 24950, it could lead to a short-term pullback. In that case, expect downside toward 24850, 24800, and 24750.

9 june Nifty50 brekout and Breakdown leval
🔵 Call (CE) Buy Levels:
24,768 – Above 10m hold CE by Risky Zone
25,122 –Above 10m hold CE Zone
25,290 – Above 10m hold CE by Zone
25,490 – Above 10m closing, short covering possible
🔴 Put (PE) Buy Levels:
25,290 – Below 10m PE by Risky Zone
25,490 – Below 10m PE by Safe Zone
24,768 – Below 10m hold PE by Zone
🟢 Other Key Zones:
24,530 – CE by Safe Zone
➤ Below this: Unwinding Possible
25,122 – Above: Positive Trade View
➤ Below: Negative Trade View

NIFTY 50 Long term Analysis I had a VIew in September 2024 that NIfty Should Fall from Its Life time HIgh to the levels of 22000 which is a strong Support and Monthly EMI 20 in Sept 2024 was nearing 22000 levels.
Now as nifty has taken support from 22000 and have relied till 25000 now. in HTF it is sideways. Important levels above is 25250 and then 26000 (LTH) and on lower side 24000 & 22000.
US after trump is very volatile and now after trump and elon musk issue and off course trade war with mostly china may drive the US market down as it is already overvalued and effects could be seen here in India market
Market Cap to GDP ratio of US (190%) & India (125%) is very High Still.
Nifty 50 analysis :
If Nifty from here if breaks 25250 level and sustain there it will face resistance @ 26000 (LTF) and if it is able to break it and sustain over it. It should zoom to 30000 levels in next 10-12 months
if nifty is not able to hold 25250 and gets rejection from here it should get it support @ 24000 but if it is not able to hold on to it. The Next Level will be 22000 again which is a very strong support but it is been tested already twice.
I have view here that Economic Conditions, US Market, Wars & Other Factors if not favourble at that time Nifty can Test 19500 Levels and curruntly 3 Month EMA 20 also is Calling the market to hand shake once @ 19500 Very Strong 3 Months Demand Zone.
This should also take 10-12 months from here.
Lets see where nifty 50 takes us 30000 or 19500.
;)

Nifty levels - Jun 09, 2025Nifty support and resistance levels are valuable tools for making informed trading decisions, specifically when combined with the analysis of 5-minute timeframe candlesticks and VWAP. By closely monitoring these levels and observing the price movements within this timeframe, traders can enhance the accuracy of their entry and exit points. It is important to bear in mind that support and resistance levels are not fixed, and they can change over time as market conditions evolve.
The dashed lines on the chart indicate the reaction levels, serving as additional points of significance to consider. Furthermore, take note of the response at the levels of the High, Low, and Close values from the day prior.
We hope you find this information beneficial in your trading endeavors.
* If you found the idea appealing, kindly tap the Boost icon located below the chart. We encourage you to share your thoughts and comments regarding it.
Wishing you success in your trading activities!

Nifty Analysis EOD – June 5, 2025 – Thursday🟢 Nifty Analysis EOD – June 5, 2025 – Thursday 🔴
🎭 Trap and Manipulation on Expiry Day
As discussed in yesterday’s note—a calm before the storm—today delivered the volatility, but not in the form anyone truly expected. Nifty opened with a 53-point gap-up, filled the gap in the first 5 minutes, and then marched upwards to hit a day high of 24,761.
But that wasn't the end…
Within just 20 minutes, Nifty spiked to 24,899—a sharp and unexpected move that defied recent technical context. Why?Because just two sessions ago (June 3), the 24,800 level was a clear rejection zone, yet today the price cut through that zone like butter, crossing the highs of the past 6 sessions—only to fall just as sharply.
📉 That’s not strength—it’s classic expiry day manipulation.
The past 16 sessions have shown candles with unusual shadows, and today added another one to the list. For swing traders, this market structure has been offering no clean entry triggers. The message is loud and clear: focus only on intraday setups and stay cautious.
🛡 5 Min Chart with Levels
🕯 Daily Time Frame Chart
🕯 Daily Candle Breakdown
Open: 24,691.20
High: 24,899.85
Low: 24,613.10
Close: 24,750.90
Net Change: +130.70 (+0.53%)
📊 Candle Structure Breakdown
Real Body: 59.70 pts (Green)
Upper Wick: 148.95 pts
Lower Wick: 78.10 pts
🔍 InterpretationThe candle paints a story of early optimism followed by profit booking or supply absorption near 24,900. Though the day closed green, the long upper shadow shows sellers dominating higher levels, leaving buyers with little to celebrate by the close.
🔦 Candle Type
🟢 Green Spinning Top with Long Upper Wick
Indicates indecision, with a bullish undertone that lacks conviction at higher levels.
📌 Key Insight
24,900 remains a psychological and technical barrier.
A bullish close above 24,900 might invite momentum traders, but until then—suspicion stays.
A breakdown below 24,600 may trigger downside interest again.
🛡 5 Min Intraday Chart
⚔️ Gladiator Strategy Update
ATR: 265.01
IB Range: 148.4 → Medium IB
Market Structure: imBalanced
Trades:✅ 11:00 AM – Long Triggered → Target Achieved (1:1.5)✅ 11:50 AM – Long Triggered → Trailing SL Hit, but Target Achieved (1:4.8)
📌 Support & Resistance Zones
Resistance Levels
24,768 ~ 24,800
24,820
24,882
24,894 (Strong Resistance)
Support Levels
24,727 ~ 24,737
24,660
24,625 ~ 24,640
24,600
24,530 ~ 24,480
24,460
💭 Final Thoughts
A day of deception more than direction.This expiry session was less about trend and more about clearing premiums, trapping both sides, and faking strength in the middle of a boxed consolidation.
📌 “Not every green candle is bullish. Some are just well-disguised traps.”
✏️ Disclaimer
This is just my personal viewpoint. Always consult your financial advisor before taking any action.

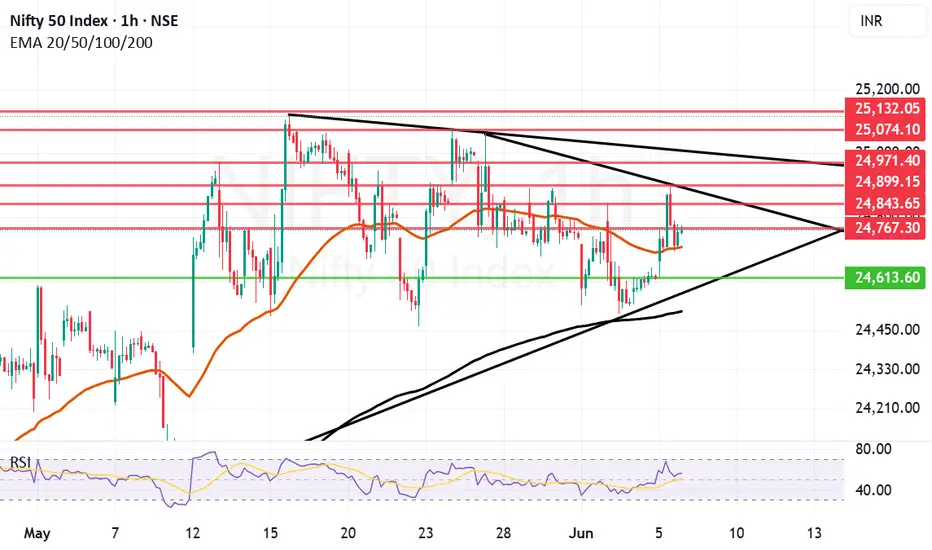
Nifty bounce between Trendline resistance and Mother lineWe Saw a jump of 130 points in Nifty today. The jump could have been higher if trend line resistance would not have come into play. This trend line resistance which came into effect is exactly around 24899 as it can be seen in the chart which was also the day's high. After making this high Nifty fell again until Mother line support present near 24706 again came into act for Nifty to close near 24750.
Thus the supports for Nifty now remain at: 24706 (Mother Line Support), 24613 (Low of today) and Father line Support near 24508. Below 24508 there will be further weakness and Bears will take control of the market.
The Resistances for Nifty now remain at: 24767, 24843, 24899 (trend line resistance), and 24971(Another Trend line resistance). Above 24971 closing Nifty will gain strength again and Bears can pull the market upwards towards 25074 or 25132. Closing above 25132 will be very good for the market as there seems to be a pure Bull territory above this zone.
Disclaimer: The above information is provided for educational purpose, analysis and paper trading only. Please don't treat this as a buy or sell recommendation for the stock or index. The Techno-Funda analysis is based on data that is more than 3 months old. Supports and Resistances are determined by historic past peaks and Valley in the chart. Many other indicators and patterns like EMA, RSI, MACD, Volumes, Fibonacci, parallel channel etc. use historic data which is 3 months or older cyclical points. There is no guarantee they will work in future as markets are highly volatile and swings in prices are also due to macro and micro factors based on actions taken by the company as well as region and global events. Equity investment is subject to risks. I or my clients or family members might have positions in the stocks that we mention in our educational posts. We will not be responsible for any Profit or loss that may occur due to any financial decision taken based on any data provided in this message. Do consult your investment advisor before taking any financial decisions. Stop losses should be an important part of any investment in equity.
Nifty levels - Jun 06, 2025Nifty support and resistance levels are valuable tools for making informed trading decisions, specifically when combined with the analysis of 5-minute timeframe candlesticks and VWAP. By closely monitoring these levels and observing the price movements within this timeframe, traders can enhance the accuracy of their entry and exit points. It is important to bear in mind that support and resistance levels are not fixed, and they can change over time as market conditions evolve.
The dashed lines on the chart indicate the reaction levels, serving as additional points of significance to consider. Furthermore, take note of the response at the levels of the High, Low, and Close values from the day prior.
We hope you find this information beneficial in your trading endeavors.
* If you found the idea appealing, kindly tap the Boost icon located below the chart. We encourage you to share your thoughts and comments regarding it.
Wishing you success in your trading activities!

Nifty Analysis EOD – June 4, 2025 – Wednesday🟢 Nifty Analysis EOD – June 4, 2025 – Wednesday 🔴
A Pause with a Purpose: Calm Before the Storm?
Today’s Nifty price action was quiet and composed. The index opened with a mild 33-point gap-up, only to find resistance around the 24,600 mark—tested multiple times through the day. Eventually, it retraced to fill the gap, took support near the 24,500 zone, and spent most of the session within a tight initial balance of just 82 points.
A mid-session breakout attempt gave bulls a fleeting 30-point push, but the rally fizzled at the 24,625–24,640 resistance zone, and the index settled at 24,620.20, wrapping up the day in a 114-point range.
While the range was narrow, the price structure hints at a market in wait mode, possibly anticipating upcoming events or news flow. Patience is the key here.
🛡 5 Min Chart with Levels
📦 Bigger Picture: Still Trapped in the Box
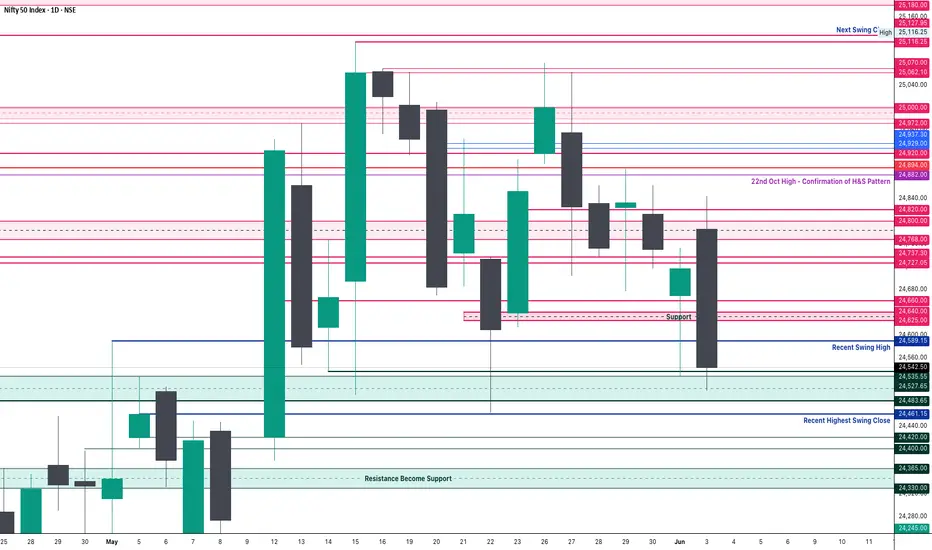
This was the 14th session and 20th trading day stuck in a 653-point box range (24,462–25,116) formed since the 15th May breakout candle.
Nifty is now near the bottom of that range, and the 15th May Master Candle low of 24,494 is becoming crucial.
🔴 A close below that level could potentially unlock lower zones near 24,000 or even 23,800.
No need to pre-empt the move—let the market trigger, then respond.
🕯 Daily Time Frame Chart
🕯 Daily Candle Breakdown
Open: 24,560.45
High: 24,644.25
Low: 24,530.45
Close: 24,620.20
Net Change: +77.70 (+0.32%)
Candle Structure
Real Body: 59.75 pts (Green)
Upper Wick: 24.05 pts
Lower Wick: 30.00 pts
Interpretation
A quiet session with modest gains. The candle shows buyers stepping in after yesterday's sell-off, but the recovery lacked strength. The small body and limited wicks signal a day of balance—neither bulls nor bears fully in control.
Candle Type
🟩 Neutral Bullish Candle / Basic Continuation Bar
Indicates pause in selling pressure, but not yet a confirmation of bullish reversal.
Key Insight
A close above 24,645 is needed to validate any recovery attempt.
As long as 24,530–24,500 holds, short-term sentiment stays cautiously optimistic.
Tomorrow’s session will be crucial to set the tone.
🛡 5 Min Intraday Chart
⚔️ Gladiator Strategy Update
ATR: 262.59
IB Range: 82.3 → Small IB
Market Structure: Balanced
Trades:
❌ No trade triggered today
📌 Support & Resistance Zones
Resistance Levels
24,625 ~ 24,640
24,660
24,727 ~ 24,737
24,768 ~ 24,800
24,820
24,882
24,894 (Strong Resistance)
Support Levels
24,600
24,530 ~ 24,480
24,460
24,420 ~ 24,400
24,365 ~ 24,330
24,245 ~ 24,240
💭 Final Thoughts:
A day of controlled consolidation in a narrow range. While the broader market may look indecisive, this could be accumulation or energy build-up for the next big directional move. Stay observant—levels are speaking louder than volume right now.
📌 "When markets whisper, smart traders listen. The quiet days often precede the loudest moves."
✏️ Disclaimer
This is just my personal viewpoint. Always consult your financial advisor before taking any action.

Nifty levels - Jun 05, 2025Nifty support and resistance levels are valuable tools for making informed trading decisions, specifically when combined with the analysis of 5-minute timeframe candlesticks and VWAP. By closely monitoring these levels and observing the price movements within this timeframe, traders can enhance the accuracy of their entry and exit points. It is important to bear in mind that support and resistance levels are not fixed, and they can change over time as market conditions evolve.
The dashed lines on the chart indicate the reaction levels, serving as additional points of significance to consider. Furthermore, take note of the response at the levels of the High, Low, and Close values from the day prior.
We hope you find this information beneficial in your trading endeavors.
* If you found the idea appealing, kindly tap the Boost icon located below the chart. We encourage you to share your thoughts and comments regarding it.
Wishing you success in your trading activities!

#NIFTY Intraday Support and Resistance Levels - 04/06/2025Nifty is opening with a gap-up near the 24700 level, placing it right at a key decision zone. If the index sustains above the 24750–24800 resistance band, it could trigger a bullish breakout with intraday upside targets of 24850, 24900, and 24950+.
However, if Nifty fails to hold this gap-up and slips back below 24700, it could quickly turn into a false breakout. A breakdown below 24700 may invite selling pressure with targets at 24650, 24600, and 24550.
Since the gap-up is near a resistance threshold, early volatility is expected. Wait for confirmation of direction with price-action and volume before taking any directional trade. Use strict stop-loss and consider partial booking around each target zone.

Nifty Analysis EOD – June 3, 2025 – Tuesday🟢 Nifty Analysis EOD – June 3, 2025 – Tuesday 🔴
Opening Sentiment vs. Reality: A Day of Dual Personality
Nifty opened with a 70-point gap-up above the previous day’s high, carrying a positive vibe. In just one minute, it surged another 57 points, marking the day’s high at 24,845. However, that bullish momentum didn’t last. The index faced strong resistance, leading to a sharp 243-point drop within 15 minutes, breaching CPR and the previous swing low to hit the first Current Day Low (CDL) at 24,601.30.
Despite the jolt, Nifty showed resilience—bounced back from the 24,625–24,640 zone, recovered to VWAP, and even retested the PDH. Yet again, it failed to hold above 24,700, echoing the morning's rejection. A second wave of selling took Nifty to a fresh low of 24,502.15 mid-session.
The closing wasn’t any better. Nifty quietly slid again, retested the breakout zone, and closed at 24,542.50, nearly at the intraday low—a day that started with hope ended on a pessimistic note.
Interestingly, India VIX also dropped, despite the downward market move—signalling premium crush and a double whammy for option buyers who got the direction right but profits wrong.
🛡 5 Min Chart with Levels
📊 Daily Summary Highlights
✅ Gap-up Start but sharp reversal
📉 Both PDH and PDL tested intraday
📉 Marubozu Engulfing Candle
⚠️ Closed below Higher Swing Low – a potential trend-shift signal
🕯 Daily Time Frame Chart
🕯 Daily Time Frame Chart
🕯 Daily Candle Breakdown
Open: 24,786.30
High: 24,845.10
Low: 24,502.15
Close: 24,542.50
Net Change: −174.10 (−0.70%)
🕯 Candle Structure
Real Body: 243.80 pts (Big red candle)
Upper Wick: 58.80 pts
Lower Wick: 40.35 pts
Interpretation
A classic bearish reversal day. Price opened higher, reached a new high, but was aggressively sold off, closing near the day’s low. This large-bodied red candle with small wicks shows clear control by the bears.
Candle Type
🟥 Bearish Marubozu-like Candle
Strong rejection at highs
Bearish dominance confirmed
Lower close signals momentum continuation to the downside
Key Insight
24,845 now acts as a firm resistance.
Break below 24,500 could accelerate correction.
Bulls need to defend 24,500–24,520 zone decisively to avoid further weakness.
🛡 5 Min Intraday Chart
⚔️ Gladiator Strategy Update
ATR: 279.13
IB Range: 243.80 → Medium IB
Market Structure: Balanced
Trades:
🔻 12:50 PM – Short Triggered → 📍 1:1 Target Achieved, but timeout
📌 Support & Resistance Zones
Resistance Levels
24,600
24,625 ~ 24,640
24,660
24,727 ~ 24,737
24,768 ~ 24,800
24,820
24,882
24,894 (Strong Resistance)
Support Levels
24,530 ~ 24,480
24,460
24,420 ~ 24,400
24,365 ~ 24,330
24,245 ~ 24,240
💭 Final Thoughts
The market showcased a classic reversal and punished emotional entries. Despite the gap-up euphoria, technical levels reigned supreme. The break below swing low could signal caution for bulls in the coming sessions.
📌 "Respect the levels, not the emotions. Every bounce is not a bottom; every fall isn’t a crash."
✏️ Disclaimer
This is just my personal viewpoint. Always consult your financial advisor before taking any action.
Bull Rally Losing steam as international factors weigh in. The Bull rally that we saw in Nifty in the last one month or so is losing a little steam as international factors related to escalating Russia and Ukraine war and International Tariff war start to weigh in. This made it difficult for Nifty to hold on to levels above 25000 after making a high of 25116 in the current rally. After making a high it is any substantial rally would try to consolidate and find a reasonable bottom from where it can launch again. Verifying a solid support is necessary for rally to move forward.
The supports for Nifty currently are at: 24515, 24185 (Mother line important support), 23945, 23689 (Father line important support). If 23689 is broken the bears will be very active again and can potentially drag down nifty to 23214, 22902 or even 22666. So 24185 and 23689 are important levels for Nifty to hold.
The Resistances for Nifty currently are at: 24838, 25116 (Important Resistance level, recent high). Sustaining above 25116 and Nifty closing above it can enable next leg of the rally which can take us in future to next resistance levels of 25438, 25641, 25845 and 26K+ levels.
The market might be speculating Russian response to Ukraine Drone attack. The scale of Russian attack if it happens will determine the movement of market. The local factors are mostly in favour of Indian markets. So long term investors should not worry. Traders and short term investors should avoid taking unnecessary risk as situation on international front. Geo-Political risk in the subcontinent, at Israel front and Between Russia and other EU nations should be on the hindsight of any decision making. Additionally there are rising number of COVID cases in India which can also become a factor which can effect market sentiment.
Disclaimer: The above information is provided for educational purpose, analysis and paper trading only. Please don't treat this as a buy or sell recommendation for the stock or index. The Techno-Funda analysis is based on data that is more than 3 months old. Supports and Resistances are determined by historic past peaks and Valley in the chart. Many other indicators and patterns like EMA, RSI, MACD, Volumes, Fibonacci, parallel channel etc. use historic data which is 3 months or older cyclical points. There is no guarantee they will work in future as markets are highly volatile and swings in prices are also due to macro and micro factors based on actions taken by the company as well as region and global events. Equity investment is subject to risks. I or my clients or family members might have positions in the stocks that we mention in our educational posts. We will not be responsible for any Profit or loss that may occur due to any financial decision taken based on any data provided in this message. Do consult your investment advisor before taking any financial decisions. Stop losses should be an important part of any investment in equity.

Nifty levels - Jun 04, 2025Nifty support and resistance levels are valuable tools for making informed trading decisions, specifically when combined with the analysis of 5-minute timeframe candlesticks and VWAP. By closely monitoring these levels and observing the price movements within this timeframe, traders can enhance the accuracy of their entry and exit points. It is important to bear in mind that support and resistance levels are not fixed, and they can change over time as market conditions evolve.
The dashed lines on the chart indicate the reaction levels, serving as additional points of significance to consider. Furthermore, take note of the response at the levels of the High, Low, and Close values from the day prior.
We hope you find this information beneficial in your trading endeavors.
* If you found the idea appealing, kindly tap the Boost icon located below the chart. We encourage you to share your thoughts and comments regarding it.
Wishing you success in your trading activities!

Today 3june 2025 nifty prediction and trade plan 🔼 Upside Scenario (Bullish Bias)
Above 24,820:
➤ "Above positive trade view" zone → Bullish momentum expected.
➤ Target Zone: 24,930
➤ Further target: 25,128
(Strong resistance & short-cover possible).
Above 25,128:
➤ Strong breakout area → Possible aggressive short covering.
➤ Bullish continuation possible if it sustains above this level.
🔽 Downside Scenario (Bearish Bias)
Below 24,630:
➤ Breaks opening support.
➤ Next support: 24,538 → Opening resistance turned into potential support.
Below 24,534 – 24,518:
➤ Enters PE (Put Entry) zone.
➤ Weakness increases below 24,516 → Safe zone for PE traders.
➤ Final bear trigger: Below 24,397 → Unwinding possible.
➤ Target zone for heavy downside: 24,300–24,200.
🟡 Sideways / Choppy Zone
Between 24,630 to 24,820:
➤ No clear trend unless breakout.
➤ Stay cautious → scalp only at levels.
📣 Summary View:
Trend Trigger Level Target Range
Bullish Above 24,820 24,930 → 25,128+
Bearish Below 24,630 24,534 → 24,397 → 24,300
Sideways 24,630 – 24,820 Wait for breakout

Nifty Bounces from Channel Bottom. Amidst escalation in Ukraine and Russia tussle with Ukraine going on major Drone offensive and Russia likely to respond anytime this week. The escalation can lead to NATO involvement and this can spell a major downside for Global market. The above is just speculation and things can take a different trajectory as well. During such global negative news Indian markets made a low of 24526 but recovered 190 points to close near 24716. This shows the strength of Indian market and shows that we are quiet buoyant.
Resistance for Nifty Remain near: 24763 (Mother Line of Hourly Chart), 24887, 25041 (Mid channel resistance and 25151.
Supports For Nifty Currently remain at: 24637, 24519 (Parallel Channel Bottom) and 24474 (Father Line of Hourly Chart).
If we get a closing below 24474 Bears will have an upper hand and can drag market further down we give the downside levels if we reach there. If we get a closing above 25151 Bulls Will have an Upper hand and can pull the index further upwards we give further upside levels once we reach there.
Disclaimer: The above information is provided for educational purpose, analysis and paper trading only. Please don't treat this as a buy or sell recommendation for the stock or index. The Techno-Funda analysis is based on data that is more than 3 months old. Supports and Resistances are determined by historic past peaks and Valley in the chart. Many other indicators and patterns like EMA, RSI, MACD, Volumes, Fibonacci, parallel channel etc. use historic data which is 3 months or older cyclical points. There is no guarantee they will work in future as markets are highly volatile and swings in prices are also due to macro and micro factors based on actions taken by the company as well as region and global events. Equity investment is subject to risks. I or my clients or family members might have positions in the stocks that we mention in our educational posts. We will not be responsible for any Profit or loss that may occur due to any financial decision taken based on any data provided in this message. Do consult your investment advisor before taking any financial decisions. Stop losses should be an important part of any investment in equity.

Nifty levels - Jun 03, 2025Nifty support and resistance levels are valuable tools for making informed trading decisions, specifically when combined with the analysis of 5-minute timeframe candlesticks and VWAP. By closely monitoring these levels and observing the price movements within this timeframe, traders can enhance the accuracy of their entry and exit points. It is important to bear in mind that support and resistance levels are not fixed, and they can change over time as market conditions evolve.
The dashed lines on the chart indicate the reaction levels, serving as additional points of significance to consider. Furthermore, take note of the response at the levels of the High, Low, and Close values from the day prior.
We hope you find this information beneficial in your trading endeavors.
* If you found the idea appealing, kindly tap the Boost icon located below the chart. We encourage you to share your thoughts and comments regarding it.
Wishing you success in your trading activities!

Nifty Analysis EOD – May 30, 2025 – Friday🟢 Nifty Analysis EOD – May 30, 2025 – Friday 🔴
Whatever gain on Thursday, wiped out... today! classic trap reset day
📌 Opening Note:After Thursday’s expiry surprise rally, today’s session turned out to be a mean reversion reality check. With a 44-point gap-down, Nifty attempted a recovery but failed to cross the previous day’s high — just 27 points shy, and rolled over into selling pressure.
📊 Nifty Summary:
Today’s price action stayed entirely within yesterday’s range, forming an inside bar pattern — a classic sign of indecision before a breakout. The morning attempt towards the high was quickly sold into, and the index retraced straight to PDL, where the previous day’s swing low came to the rescue at 24,717.40. From there, it bounced back to VWAP and stayed rangebound (~60–70 points) for the rest of the session.
By the close, intraday gains of Thursday were completely erased — ending exactly at the breakout zone of yesterday: 24,736.65.
🛡 5 Min Chart with Levels
🪞 Mirror Candle Alert!Interestingly, today’s candle (May 30) closely mimics the May 28 candle in structure and price levels:
High: 24,864.25 ~ 24,863.95 (🔁 0.30 pt diff)
Close: 24,752.45 ~ 24,750.70 (🔁 1.75 pt diff)
Low: 24,737.05 ~ 24,717.40 (🔁 19.65 pt diff)
This pattern alignment forms a diamond shape across the last 3 days (May 28–30), visible clearly on Daily and 5-min charts. This diamond formation + inside bar combo could be a powerful breakout setup — direction to be confirmed by the next session’s range expansion. Check out 5 min and Daily candle chart for visual insight.
🛡 5 Min Chart with Patterns
🕯 Daily Time Frame Chart
📉 Daily Candle Breakdown:
Candle Type: Inside Bar
Structure:
Real Body: Very small
Wick Sizes: Decent on both ends, implying indecision
Interpretation:
Inside bar at the top of a move with a prior hammer-like candle signals pause or reversal.
A break of 24,717 on downside = bearish confirmation
A break of 24,893 on upside = bullish breakout
🛡 5 Min Intraday Chart
⚔️ Gladiator Strategy Update:
ATR: 276.90
IB Range: 83.95 → Small
Market Structure: Balanced
Total Trades: 3
🔹 10:15 – Short triggered → Trailing SL hit @ 1:1.6
🔹 11:30 – Short triggered → 1:1.5 achieved
🔹 13:40 – Short triggered → SL Hit
📌 Support & Resistance Zones:
Resistance:
24,768 ~ 24,800
24,820
24,882
24,894
24,920
24,972 ~ 25,000
25,062 ~ 25,070 (5th rejection!)
25,116 ~ 25,128
25,180 ~ 25,212
25,285 ~ 25,399
Support:
24,737 ~ 24,727
24,700
24,660
24,640 ~ 24,625
24,590
24,530 ~ 24,480
24,460
📌 What’s Next? / Bias Direction:
Nifty has compressed into a tight 3-day structure — with a diamond and an inside bar pattern.🎯 Watch for breakout beyond 24,894 or breakdown below 24,677 for directional clarity.Bias remains neutral until price decisively exits this range.
💬 Final Thoughts:
“Breakouts don't lie. Ranges prepare. Patience pays.”
Today was a classic trap reset day. Tomorrow, the trigger might fire. Stay sharp.
✏️ Disclaimer:
This is just my personal viewpoint. Always consult your financial advisor before taking any action.

Nifty levels - Jun 02, 2025Nifty support and resistance levels are valuable tools for making informed trading decisions, specifically when combined with the analysis of 5-minute timeframe candlesticks and VWAP. By closely monitoring these levels and observing the price movements within this timeframe, traders can enhance the accuracy of their entry and exit points. It is important to bear in mind that support and resistance levels are not fixed, and they can change over time as market conditions evolve.
The dashed lines on the chart indicate the reaction levels, serving as additional points of significance to consider. Furthermore, take note of the response at the levels of the High, Low, and Close values from the day prior.
We hope you find this information beneficial in your trading endeavors.
* If you found the idea appealing, kindly tap the Boost icon located below the chart. We encourage you to share your thoughts and comments regarding it.
Wishing you success in your trading activities!

#NIFTY Intraday Support and Resistance Levels - 30/05/2025Nifty is expected to open flat around the 24800–24850 range. The market has shown signs of recovery from lower levels, and if it manages to hold above the 24800–24850 support zone, we can expect a continuation of upward momentum. In that case, possible intraday upside targets are 24900, 24950, and a breakout beyond 25000 could extend the rally toward 25150, 25200, and 25250+ levels.
However, if Nifty fails to sustain above 24800 and faces resistance near 24900–24950, a pullback may occur. A confirmed breakdown below 24700 would signal weakness and could trigger a fresh round of selling. In such a scenario, downside targets would be 24650, 24600, and possibly 24550.
Today’s session may start off sideways with consolidation between key levels. Wait for clear confirmation above 24850 for longs or below 24700 for shorts. Keep trailing your stop-loss and book partial profits near every target zone.

Nifty Analysis EOD – May 29, 2025 – Thursday🟢 Nifty Analysis EOD – May 29, 2025 – Thursday 🔴
Tricky Expiry Day Rollout… Catch or Caught?
🗞 Nifty Summary:
Nifty opened with a gap-up of 88 points at 24,846, making a quick move to 24,889.70—but the bulls couldn’t hold for long. By 10:30, the key support zone at 24,800–24,768 was breached, dragging the index to an intraday low of 24,677.30.
Just when things seemed to be settling into a narrow expiry-day range, a sharp 65-point spike in 3 minutes surprised both sides—creating a mean-reversion V-shape move right back to VWAP and BC levels.
The real twist? A sudden domino-effect breakout at 15:00, marking a fresh high of 24,892.60 and closing at 24,880.85, nearly at the day’s peak.
⏪ Yesterday’s Note Recap:
"Most probable scenario: range-bound day between 24,660 and 24,882... Tricky expiry day."✔️ Spot on. Nifty respected the projected boundaries almost precisely.
🛡 5 Min Chart with Patterns and Levels
📈 Intraday Walk:
09:15 – Gap-up start, optimism in the air.
10:25 – Support at 24,800–24,768 tested and breached.
10:29 – IB Low Break and Day’s low at 24,677.30, bears step in.
12:38 – Surprise spike of 65 points in 3 min
Midday – Consolidation around VWAP and BC levels.
15:00 – Final push leads to breakout above day high → 24,892.60.
Close – Ends at 24,880.85, just below the day high.
🔍 Chart Observations:
✅ Inverse Head & Shoulders pattern formed around 24,768 on the 5-min chart—target achieved.
📦 Box Consolidation Zone repeated from yesterday and respected.
⚠️ Volatility spikes despite being an expiry day—tricky traps for both sides.
🛡 5 Min Chart with Patterns
🕯 Daily Time Frame Chart
🕯 Daily Candle Breakdown:
Open: 24,825.10
High: 24,892.60
Low: 24,677.30
Close: 24,833.60
Change: +81.15 (+0.33%)
Candle Structure:
Real Body: +8.50 pts → Tiny green body
Upper Wick: 59.00 pts
Lower Wick: 147.80 pts
Interpretation:A classic Hammer-like candle, showing strong intraday buying from lower zones. Although bulls couldn’t extend gains, they clearly defended 24,700 levels well.
🔔 Pattern Insight:
Outside Bar pattern on Daily → Often a bullish reversal sign
Bullish confirmation comes above 24,890+
Breakdown below 24,677 would invalidate the bullish signal
🛡 5 Min Intraday Chart
⚔️ Gladiator Strategy Update:
ATR: 291.38
IB Range: 110 → Medium
Market Structure: Balanced
Total Trades: 1
🕐 10:25 AM – 1st trade triggered→ Trailing SL hit at 1:3 risk-reward
🧱 Support & Resistance Levels:
Resistance Zones:
24,882
24,894
24,920
24,972 ~ 25,000
25,062 ~ 25,070 (5th rejection!)
25,116 ~ 25,128
25,180 ~ 25,212
25,285 ~ 25,399
Support Zones:
24,820
24,768 ~ 24,800
24,737 ~ 24,727
24,700
24,660
24,640 ~ 24,625
24,590
24,530 ~ 24,480
24,460
🧭 What’s Next?
Above 24,890 → May trigger short-covering rally toward 25,000, 25,065, and 25,116 levels.
Below 24,677 → Expect downside toward 24,625, 24,590, and possibly 24,530.
With expiry behind, volatility may remain elevated tomorrow as new series begins.
📌 Bias: Mild bullish, but needs confirmation above 24,890.
🧠 Final Thoughts:
“Markets don’t trap you; your bias does.”Stay sharp. Today was a day full of whipsaws—but also full of lessons.
✏️ Disclaimer:This is just my personal viewpoint. Always consult your financial advisor before taking any action.

Nifty levels - May 30, 2025Nifty support and resistance levels are valuable tools for making informed trading decisions, specifically when combined with the analysis of 5-minute timeframe candlesticks and VWAP. By closely monitoring these levels and observing the price movements within this timeframe, traders can enhance the accuracy of their entry and exit points. It is important to bear in mind that support and resistance levels are not fixed, and they can change over time as market conditions evolve.
The dashed lines on the chart indicate the reaction levels, serving as additional points of significance to consider. Furthermore, take note of the response at the levels of the High, Low, and Close values from the day prior.
We hope you find this information beneficial in your trading endeavors.
* If you found the idea appealing, kindly tap the Boost icon located below the chart. We encourage you to share your thoughts and comments regarding it.
Wishing you success in your trading activities!
My Recent Trade In Nifty 50 ... On 1 hour time frame nifty is coming to get liquidity on FVG drew here.. after it may go to 25,000. let's see what happens...
