BUY NIFTY, GO LONGNIFTY 50 has been taking support continuously on 50EMA.
Whenever 50EMA is broken, 200EMA works as SUPER SUPPORT.
NIFTY has already taken support on 200EMA yesterday,
& today it has bounced somewhat.
The market scenario for NIFTY 50 is presently suggesting BUY.
YOU CAN GO LONG ON NIFTY 50
Niftylong

nifty 50 up trend path can follow same bar patten of 31 jan 2018 to 21jan 2020 again
it is confirm bullish trend
lets see ,follow the trend and buy your stocks
no indicators is used in it
pure technical chart formation
there is no 100% in stock market 😅
except your returns 😎

NIFTY 50NSE:NIFTY
NIFTY BULLISH BIAS , looks like heading for all time high again , may take some time but ATH is on....

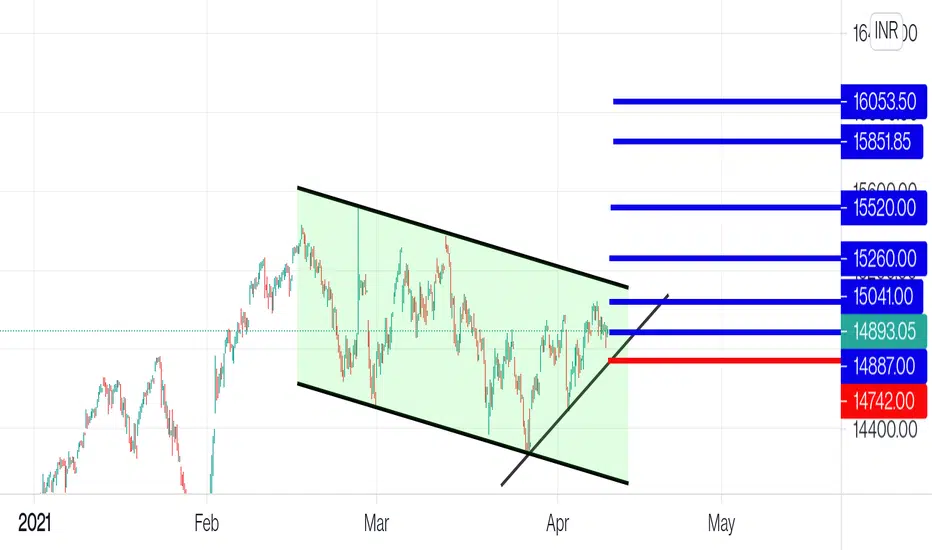
Nifty Future Nifty Future looking bullish
One can go Long now or in dips with stoploss of 14990
All the key levels are mentioned in chart with Stop-loss and Targets
Key Levels
Upper Bollinger
Macd in daily positive
Macd in hourly positive
Adx in daily positive
ADX in hourly positive
Rsi in daily above 60
Rsi in hourly above 60
Disclaimer
I am not sebi registered analyst
My studies are Educational purpose only
Please consult with your Financial advisor before trading or investing

Nifty Future Nifty looking to start a new impulse
All the key levels are mentioned in chart with Stop-loss and Targets
Disclaimer
I am not sebi registered analyst
My studies are Educational purpose only
Please consult with your Financial advisor before trading or investing

Nifty Future Looks Bullish
All the key levels are mentioned in chart with Stop-loss and Targets
Disclaimer
I am not sebi registered analyst
My studies are Educational purpose only
Please consult with your Financial advisor before trading or investing
NIFTY LONG PLAN FOR SMALL RISKY PLAYERS AND SAFE PLAYERS ZOONNIFTY LONG PLAN FOR SMALL RISKY PLAYERS AND SAFE PLAYERS ZOON

NIFTY COMMENTARY by Kiran WEEK 26.. WAITING FOR CRASH???Hi Friends,
As I explained in last week we will get a small correction, Nifty already showed some of it.
Lot of people asking me is this right time to short? I just answered NO. It require lot of analysis to come to a conclusion.
So my advice for this week is Buying the dip.
I will go with the same option 1 BUYing opportunity.
Your humble trader
KIRAN
If you liked my analysis, just give me thumbs up or comment, it will boost me to analyze more stocks.
follow my profile for new trading ideas (kiransunku2016)
---------------------------------------------------------------------
The five conditions I watch regularly are.
1. BUYing opportunity
2. BUY hold
3.Wait for trend confirmation
4. SELLing opportunity
5. SELL hold.
--------------------------------------------------------------------

Nifty, What are you trying to say us ?Nifty current level look Bearish but its possible that can break the levels and move upward
.
.
.
thanks
god bless you all
have a profitable week a head

NIFTY COMMENTARY by Kiran WEEK 18, ABOVE 13,000-bubble rally?Hi Friends,
Two weeks back on week 16 commentary (check below), I warned there will be JERK with not so big reason. I thought the crash would come last week, but it came weak after. LOT of people still in mesmerizing state of mind what to do, only traders with lot of experience can able to absorb the shock and able to take the next trade.
Ok what is now on the table? and why this crash happen?
here is the answer, market always shake the tree before advancing, all the loose hands will drop out and only strong hands clinch on to the rally.
This market is still not finish until final rally in stocks. (may be i am wrong, but numbers will decide)
I will go for the same option, which is 2 BUY HOLD. in fact last week it gave us buying opportunity also.
Your humble trader
KIRAN
If you liked my analysis, just give me thumbs up or comment, it will boost me to analyze more stocks.
follow my profile for new trading ideas (kiransunku2016)
---------------------------------------------------------------------
The five conditions I watch regularly are.
1. BUYing opportunity
2. BUY hold
3.Wait for trend confirmation
4. SELLing opportunity
5. SELL hold.
--------------------------------------------------------------------


NIFTY COMMENTARY by Kiran WEEK 16, ABOVE 13,000-bubble rally?Hi Friends,
What an amazing last week, it is almost kind of roller costar ride for the intraday players.
Nifty is going to corner of the upward triangle. So CAUTION is advised.
THERE is a possibility of JERK (like one day correction) before big rally. It is like shaking of the tree, weak hands will loose the grip and fall down. MARKET always do this to trap majority of the people.
So look for stoploss 13400-13300 range.
I will go for the same option, which is 2 BUY HOLD.
Your humble trader
KIRAN
If you liked my analysis, just give me thumbs up or comment, it will boost me to analyze more stocks.
follow my profile for new trading ideas (kiransunku2016)
---------------------------------------------------------------------
The five conditions I watch regularly are.
1. BUYing opportunity
2. BUY hold
3.Wait for trend confirmation
4. SELLing opportunity
5. SELL hold.
--------------------------------------------------------------------

#NIFTY eyeing 13450-13500#NIFTY eyeing 13400-13500, we can see it next week.
Pick some 13400 calls for next week @ 38

NIFTY COMMENTARY by Kiran WEEK 15, ABOVE 13,000-bubble rally?Hi Friends,
NIFTY sustained above 13000, so do we see bubble rally?
Not yet we have uptrend resistance line is there, once brake of this uptrend blue line, WILL give us beautiful rally. I AM EAGERLY WAITING FOR THAT RALLY.
it is like once in decade opportunity.
so this week I will go with option 2 BUY HOLD
Your humble trader
KIRAN
If you liked my analysis, just give me thumbs up or comment, it will boost me to analyze more stocks.
follow my profile for new trading ideas (kiransunku2016)
---------------------------------------------------------------------
The five conditions I watch regularly are.
1. BUYing opportunity
2. BUY hold
3.Wait for trend confirmation
4. SELLing opportunity
5. SELL hold.
--------------------------------------------------------------------

NIFTY COMMENTARY by Kiran WEEK 14, ABOVE 13,000-bubble rally?Hi Friends,
Nifty is facing stiff resistance at 13150-13250 range. This consolidation is needed before brakeout.
THIS IS LIKE CALMNESS BEFORE STROAM.
MY option for this week is same as last week.
I will go for the option 2. BUY hold.
TRADING ADVICE : avoiding BIG losses makes your trading carrier success. The reason for big losses from my personal experience is that, after certain level of loss, A HOPE come which makes the small losses BIGGER ONES.
SO don't pray for market to come to your direction but be merciless with market. IF your trade is in loss, get out immediately. My saying for the TRADERS is THERE IS ALWAYS TOMORROW .
Your humble trader
S. KIRAN
QUOTATION : LEARN FROM EACH AND EVERY POSSIBLE SOURCE AND LET THE COMMON SENSE MAKES THE DECISION.
---------------------------------------------------------------------
follow my profile for new trading ideas (kiransunku2016)
---------------------------------------------------------------------
The five conditions I watch regularly are.
1. BUYing opportunity
2. BUY hold
3.Wait for trend confirmation
4. SELLing opportunity
5. SELL hold.
--------------------------------------------------------------------

NIFTY COMMENTARY by Kiran WEEK 13, ABOVE 13,000-bubble rally?Hi Friends,
Last week I gave the option Buy hold strategy and it worked beautifully hitting the target of 12950 to 13000 range.
It seems to me market is preparing for bubble rally.
You can ask me " what is bubble rally"?
BUBBLE RALLY: you cant predict the nature and targets, it is parabolic move.......... this is the time FOR people TO make BIG profit or losses. SO BETTER TO USE TIGHTER STOPLOSS.
I will go for the option 2. BUY hold.
Your humble trader
S. KIRAN
QUOTATION : LEARN FROM EACH AND EVERY POSSIBLE SOURCE AND LET THE COMMON SENSE MAKES THE DECISION.
---------------------------------------------------------------------
follow my profile for new trading ideas (kiransunku2016)
---------------------------------------------------------------------
The five conditions I watch regularly are.
1. BUYing opportunity
2. BUY hold
3.Wait for trend confirmation
4. SELLing opportunity
5. SELL hold.
--------------------------------------------------------------------

Nifty can Reverse Nifty can change the trend any time sooner.
not at all a good idea to be bullish...it can rally a bit further but the correction will be very sharp...
symptoms :when the nifty move Sideways its time to close the long position and get ready for the Short. The fall may or may not be crash...depends on the DOW JONES

NIFTY COMMENTARY by Kiran WEEK 8 (WILL MAKE IT OR BRAKE IT)Hi Friends,
It is like a roller coaster ride for nifty in last few weeks. Nifty making huge swings in both directions.
Now it is at decision point. If it hold the pink of blue trend line then it is buying opportunity otherwise if it brakes it is selling opportunity.
I will vote for buying opportunity with stoploss just below the trend lines on closing basis.
Then the stop loss for bulls now is 11584 on closing basis. Last week also I mentioned the same stoploss.
This week I will go for option 1. which is BUYing opportunity
Your humble trader,
KIRAN
---------------------------------------------------------------------
follow my profile for new trading ideas (kiransunku2016)
---------------------------------------------------------------------
The five conditions I watch regularly are.
1. BUYing opportunity
2. BUY hold
3.Wait for trend confirmation
4. SELLing opportunity
5. SELL hold.
--------------------------------------------------------------------

NIFTY COMMENTARY by Kiran WEEK 7Hi Friends,
What a amazing last week. Nifty gave 5% return in one week. It broke the long term down trend line with ease. it is very very bullish sign.
I gave the stop loss for shorts last week which is 11525 . Now my view is changed from bearish to bullish.
Remember a trader must change according to market conditions.
AGILITY IS THE KEY, ADOPTING NEW CONDITIONS WILL MAKE YOUR TRADING CAREER STRONGER.
Then the stop loss for bulls now is 11584 on closing basis.
You may think it is too far (3.2%) from current levels. But we need to know where we are wrong.
This week my option is 2 BUY HOLD.
Your Humble trader
KIRAN
---------------------------------------------------------------------
follow my profile for new trading ideas (kiransunku2016)
---------------------------------------------------------------------
The five conditions I watch regularly are.
1. BUYing opportunity
2. BUY hold
3.Wait for trend confirmation
4. SELLing opportunity
5. SELL hold.
--------------------------------------------------------------------

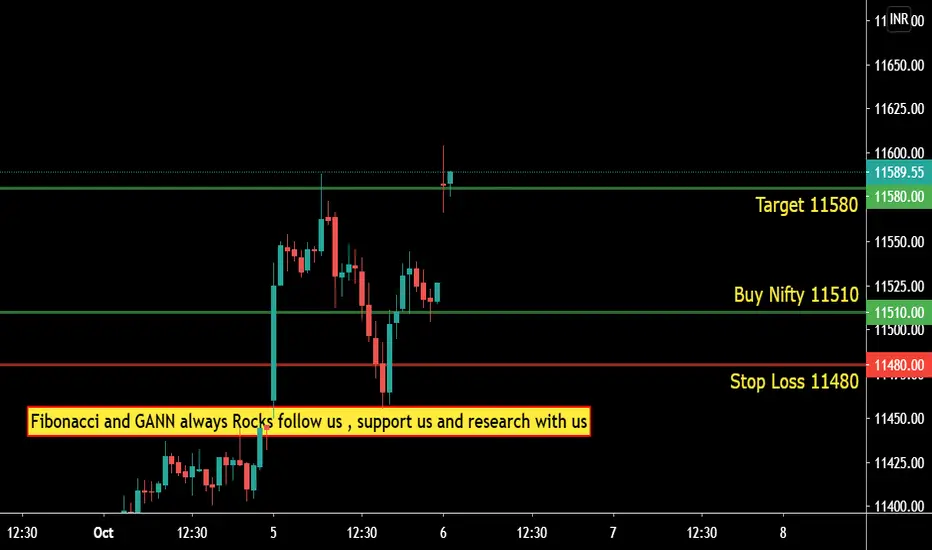
Nifty Buy / Sell Based on FIBO and GANNBuy at 11510 stop loss 11480 and target 11580
fibonacci and gann always rocks follow us, support us and research with us
Nifty 50 can touch 12000 in the coming week or a twoNifty as shown in the chart has made an inverted head and shoulder on charts and can break out on higher levels


NIFTY COMMENTARY by Kiran WEEK 2Hello friends,
Last week I started the commentary with five conditions, they are listed below.
1. BUYing opportunity
2. BUY hold
3.Wait for trend confirmation
4. SELLing opportunity
5. SELL hold.
We might be in the middle of trend reversal.
So, here both bulls and bears should take care.
If NIFTY cannot able to close above the red trend line then it signals the correction is underway. It will be confirmed this week.
Any dare people can short the NIFTY at red line which can act as resistance line.
my view about the NIFTY
3.Wait for trend confirmation
When it will confirm the down trend?
Simple, new lower low will confirm it. it is now at 11150-11300 range and not able to go above 11500 -11600 range.
Thats it
Have a nice weekend. SEE YOU NEXT WEEK.
Your humble trader,
Kiran
