#NIFTY Intraday Support and Resistance Levels -22/12/2023Nifty will be gap up opening in today's session. After opening nifty sustain above 21300 level and then possible upside rally up to 21420 level in today's session. in case nifty trades below 21250 level then the downside target can go up to the 21130 level.
Niftyoptions

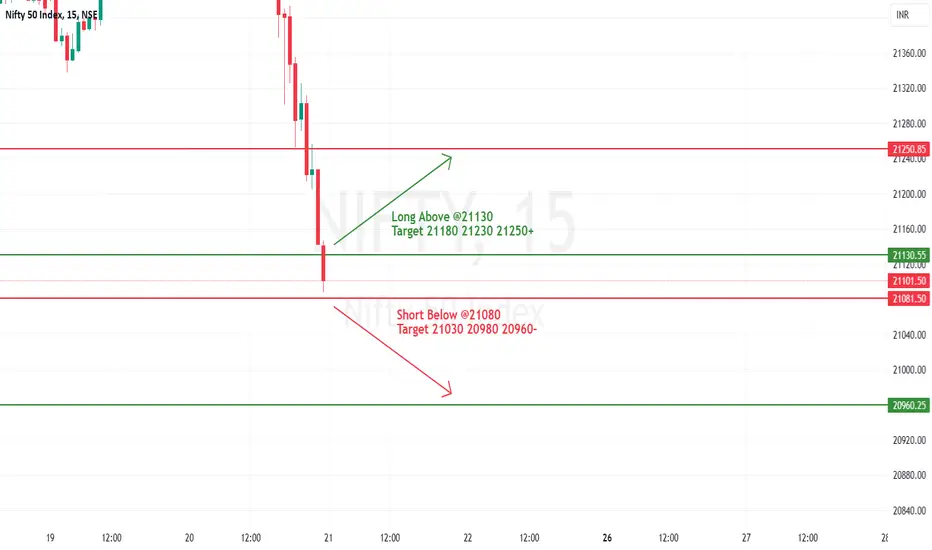
#NIFTY Intraday Support and Resistance Levels -21/12/2023Nifty will be gap up opening in today's session. After opening nifty sustain above 21130 level and then possible upside rally up to 21250 level in today's session. in case nifty trades below 21080 level then the downside target can go up to the 20960 level.
NIFTY prediction for today 20 Dec 23As we discussed, nifty will be forming a double top. It has completed the double top, and 21500 worked a nice resistance. Now, for today, 21500 will be acting as a nice deciding line. If it breaks above and consolidates upside, then it might go higher; otherwise, 21500 might work as a turning reversal point for Nifty.
Reasons:
DOUBLE Top formation is already completed. In the last 30 minutes, there was a lot of pressure from sellers with great power. (Bearish)
Ascending triangle pattern completion is there, which shows the trend might continue.
OI has PCR 0.99, is bullish, and 21400 has quite nice additional PE writing. (bullish)
RSI is 40-60, which means it is mostly sideways.
Price > EMAs(13,50,200) shows bulls are still having market control. (Bullish)
21300 will be providing a nice price action support point.
If it breaks to the upside, 21650 will provide a nice target point.
Verdict:
If it breaks to the upside, Sideways or Bearish might go bullish.
Plan of action:
Observe 15-minute candles and be on the selling side. Follow the analysis.

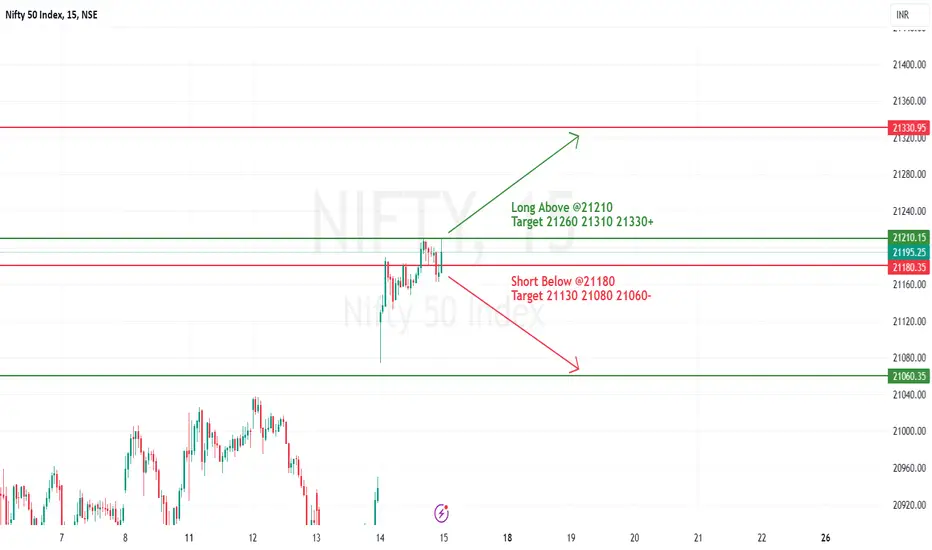
#NIFTY Intraday Support and Resistance Levels -15/12/2023Nifty will be gap down opening in today's session. After opening nifty start trading below 21180 level and then possible downside rally up to 21060 in today's session. in case nifty trades above 21210 level then the upside target can go up to the 21330 level.
NIFTY Prediction for tomorrow 12 Dec 23As we discussed yesterday, NIFTY did take resistance from the given resistance line and was sideways the whole day. For tomorrow, Nifty is expected to move into the inner zone. Two possible cases are explained in the chart. In case 1, it will be sideways in close range. If case 2, it might give you a little momentum to the downside.
Reasons:
EMA 50 is providing a nice support.
on the upside trendline provides a nice resistance trendline.
20850 will be acting as a good Price action support point.
PCR 0.93, which is bullish, but if we check OI the whole day, it was more of a round-off. Few new positions were created. People are waiting unless it's direction to be decided.
RSI is 40-60, which is mostly sideways.
according to OI 21000, it is working as MAX Pain, which is also a good psychological level.
Price > EMAs, which means bulls are strong.
Verdict :
Sideways
Plan of action:
Sell 21000 CE and protect it with hedging.

NIFTY Bull prediction for tomorrow As in my last analysis we discussed, NIfty has given the breakout to bulls side it has broken the highest high. Now it's expected to move higher HIGH. most levels have been marked on chart.
I am exxpecting it to retrace to 20200 levels and then once bulls take the charge nifty is going to touch above resistance trendline. It's having mild Bearish deivergence. but that can be fixed during consolidation or retesting the 20200 level.
I am expecting it to retest and than move to 20500.
Reasons:
NIFTY has aleady given the breakout. trading all time high. (Bullish)
PCR = 1.19 (Bullish)
20200 is having huge PE writing means good strong support level. (Bullish)
Upside we have good CE writing at 20400. So, traders are waiting for retest to sell lower point. (Bullish)
RSI is already in the Bullish zone. (Bullish)
Verdict:
Strong Bullish
Plan of action:
Sell 20200 PE and Buy 20250 CE once Bull trend confirms after retest.

India VIX seems UP-trendingNifty nearing all-time-high, and India VIX is rising too!
VIX>13 and up-trending.
In Feb 2023 we saw India VIX climbing up to 18. Purely because of National Event - Budget.
This time we have even more sensational National Event - Elections!
Will it breach 2023 high?
All the best Option Sellers. The dance of Volatility starts!

NIFTY ANALYSIS EXPLAINED FOR A SHORT POSITION
This is a Daily Source Supply to Daily Destination Demand downtrend.
Equilibrium and the Location of the Price on the Equilibrium.
Short position with an amazing Reward to Risk ratio
ENJOY THE RIDE !!!

NIFTY--19500 Is Resistance?? price broken the trendline and retested...then gap down or gap up.
we have a strong demand zone at 19360level...price may again rise from this level..
previously 19500 is a strong resistance,
if price again acts as resistance in this zone will observe a fall up to 19300 and 19200 levels.
otherwise price breaks the resistance and have chances of testing the 19600 and 19700 levels.
keep safe before short....wait until it touches the resistance resistance level @19500.

NIFTY Prediction for 9th NovAs we discussed, a neutral view of NIFTY moved sideways the whole day by gaining +36 points.
Right now, NIfty is at a really crucial point where it might go from the 19550 to the upside, where it might face the 4H-TH trendline as resistance. Tomorrow's nifty has expiry, which means it might be sideways with high probability. Expiry is likely to end in 19350-19450.
Reason:
Expiry day for Nifty (Mostly Sideways)
50 EMA day TF resistance to upside. (Resistance)
Price > EMAs (Bullish)
RSI is 40-60 mostly Sideways.
Price action resistance to upside at 19460.
PCR = 0.88 (Neutral) (Put:Call Ratio)
Verdict:
Sideways
Plan of action:
don't go for option Buyiing. let it make the range and then make iron condor.

Nifty Head and shoulder patternNifty formed a Head and shoulder pattern and now in retesting area, new sellers can enter with conservative mind. Target mentioned in chart kindly check it.

Nifty prediction, Will Continue the Bullish trend?As Nifty has been continuously increasing for the past four days, it has been purely seller day. The market is consolidating in a range of 70-80 Points. We have performed Top a top-to-bottom approach where we see a trendline that is marked over the chart. Nifty seems to touch the 19550 levels by this week's expiry.
Reason:
Price > EMA(13,50,200) (Bullish)
Golden crossover (Bullish)
PCR = 1 (Bullish)
RSI > 60 (Bullish)
200 EMA support downside.
Verdict:
Bullish
Plan of Action:
Sell PE on lower Points. Don't go for option Buying based on the last four days moment.

NIFTY detailed Prediction analysis for 2nd Nov NIFTY was quite Bearish yesterday as we discussed the levels and trendlines respected quite well. A trendline is broken to downside and selling presure was more to downside, by looking of the trend yesterday nify seems bearish for this week.
Reason:
200 EMA Resistance (Good Resistance) (Bearish)
Price Action Resistance (Red Zone upside) (Bearish)
Yesterday Heavy selling presure
Price < (13,50) EMA (shows bearish)
PCR = 0.68 (mild Bearish), MAX Pain = 19100
RSI < 40 (Bearish)
Verdict:
Bearish
Plan of action:
as its expiry it might be sideways. so play based on levels

NIFTY Prediction today 1st Nov 23NIFTY was quite Bearish yesterday as we discussed the levels and trendlines respected quite well. a short trendline is broken to downside and selling presure was more to downside, by looking of the trend yesterday nify seems bearish for this week.
Reason:
200 EMA Resistance (Good Resistance) (Bearish)
Price Action Resistance (Red Zone upside) (Bearish)
Yesterday Heavy selling presure
Price < (13,50) EMA (shows bearish)
PCR = 0.75 (mild Bearish), MAX Pain = 19100
RSI > 40-60 (Sideways)
Verdict:
Bearish
Plan of action:
look for initially 15 min. follow the trend. Sell high levels.

NIFTY S/R LevelsI am sharing the important levels of Support and Resistance. These levels play a crucial role in trading decisions, as they act as reliable markers of price movements.
------>>Support levels are price points where an asset tends to find buying interest, preventing it from falling further.
---->Resistance levels, on the other hand, are points where selling pressure typically prevents the asset from rising higher.
They serve as key reference points for technical analysis

Will nifty take support or Fall?Nifty have been falling for last whole week. Now it has come to the zone where it has a nice support zone. Nifty might take support near 19250 as shown in the chart.
Nifty seems to be roaming in Range of 19250 - 19500.
Reason:
Price < EMAs(13,200) (Bearish)
15 < RSI < 30 shows oversold zone. but having Less strength means weak bull power.
PCR = 0.55 (Bearish)
Price < 200 EMAs shows in bearish zone. (Bearish)
Price < VWAP (Bearish)
it has been a heavy fall might consolidate here.
Verdict :
Bearish, but also having price action level where it might take support.
Plan of action:
Wait for market to show a bullish signal like double bottom or bullish hammer. once direction is confirm then make the postion.
if break to downside let it retrace and then go Bearish.

NIFTY--Liquidity lies @19500I am sharing the important levels of Support and Resistance. These levels play a crucial role in trading decisions, as they act as reliable markers of price movements.
------>>Support levels are price points where an asset tends to find buying interest, preventing it from falling further.
---->Resistance levels, on the other hand, are points where selling pressure typically prevents the asset from rising higher.
If price breaks the resistance, we have a chance of filling the bearish gap, soo keep in buyside until it touches the zone of resistance and bearish gap.
Take a look at these levels and trade accordingly. Recognizing and respecting these support and resistance levels can help traders make informed decisions and manage risk effectively. They serve as key reference points for technical analysis and are vital tools in successful trading strategies.
Trade safe...Thank you guys for your support

NIFTY--Near its Trendline??I am sharing the important levels of Support and Resistance. These levels play a crucial role in trading decisions, as they act as reliable markers of price movements.
------>>Support levels are price points where an asset tends to find buying interest, preventing it from falling further.
---->Resistance levels, on the other hand, are points where selling pressure typically prevents the asset from rising higher.
If price breaks the resistance, we have a chance of filling the bearish gap, soo keep in buyside until it touches the zone of resistance and bearish gap.
Take a look at these levels and trade accordingly. Recognizing and respecting these support and resistance levels can help traders make informed decisions and manage risk effectively. They serve as key reference points for technical analysis and are vital tools in successful trading strategies.
Trade safe...Thank you guys for your support

What after nifty breakout now?As per out last analysis nifty has breakout that falling wedge pattern. yesterday as it was expiry it was range bound in the range 19780-19830. today's momentum will decide which side nifty is going to move. so we have to keep our bias neutral.
Reason :
Sideways range bound moment whole day yesterday. (Neutral)
nifty has given the breakout of falling wedge. ( Bullish)
Option chain PCR = 1.01 (Bullish but its initial 1st day of week)
RSI < 50 downtrend (Bearish)
Price < EMA(13) (Bearis)
Verdict
As Biases are both side Its Neutral
Plan of Action:
wait for 15 min candle and then make positions as marked on the chart.

NIFTY ANALYSIS FOR 11th OCT 2023-FOR EDUCATION PURPOSENIFTY ANALYSIS FOR 11th OCT 2023-FOR EDUCATION PURPOSE
This video is for educational purpose and my personal view . We are NOT SEBI registered Advisor, we only give the level on our practical trading experience. Kindly take the trade according to your risk and reward position and consulting your advisor. It is advisable to take the advice of SEBI registered advisor.
@vijayanjum
#nse
#nsebse
#Nifty
#niftyfifty
#bankniftytrading
#nfitybank
#niftypredictionfortomorrow
#niftyoptions
#NiftyBank
#nifty50
#nifty500
#niftytomorrow
#niftytoday
#NiftyCE
#bankniftyoptions
#sensex
#sensexindia
#sensextoday
#bankniftytips
#bankniftyanalysis
#bankniftytrading
#bankniftyoptions
#finnifty
#bankniftystrategies
#niftystrategies
#bse#bseindia
#bsesensex
#nsenifty
#nsebse
#nseindia
#STOCKMARKETEDUCATION
#STOCKMARKETUPTODATE
#STOCKMARKETTODAY
#stockmarkets
#tommorrowMarketPrediction
#nfityoutlookfornextweek
#bankniftyoutlookfornext week
#bankniftyoutlookformonday
#niftyforecast
#bankniftyforecast
#niftyshareprice
#bankniftyshareprice
#tommorrowniftyprediction
#tommorrobankniftypredicton
#niftytargettommrrow
#bankniftytargettommrrow
#bankniftylive
#banknifty
#bankniftyoptions
#bankniftystrategies
#bankniftyfuture
#bankniftyoptionstrategy
#bankniftycalls
#bankniftyintraday
#bankniftylivetrading
#bankniftyweeklyexpiry
#bankniftycrash
#bankniftytomorrow
#bankniftypredictions
#bankniftychart
#bankniftytips
#bankniftypremium
#bankniftyoptions
#bankniftyfuture
#bankniftytomorrowprediction
#bankniftyoption
#niftyweeklyexpiry
#stockmarketinindia
#derivatives
#niftypredictions
#niftytips
#bank nifty analysis,
#bank nifty prediction for tomorrow,
#bank nifty analysis
#bank nifty tomorrow,
#nifty prediction for tomorrow,
#nifty prediction,
#nifty analysis,
#banknifty tomorrow,
#bank nifty tomorrow analysis,
#nifty tomorrow,
#bank nifty analysis for tomorrow,
#nifty analysis for tomorrow,
#stock market crash,
#stock market latest news today,
#bank nifty live,
#live trading bank nifty,
#nifty live trading,
#live trading,
#bank nifty live trading

NIFTY ANALYSIS FOR 9TH OCT 2023-FOR EDUCATION PURPOSENIFTY ANALYSIS FOR 9TH OCT 2023-FOR EDUCATION PURPOSE
This video is for educational purpose and my personal view . We are NOT SEBI registered Advisor, we only give the level on our practical trading experience. Kindly take the trade according to your risk and reward position and consulting your advisor. It is advisable to take the advice of SEBI registered advisor.
@vijayanjum
#nse
#nsebse
#Nifty
#niftyfifty
#bankniftytrading
#nfitybank
#niftypredictionfortomorrow
#niftyoptions
#NiftyBank
#nifty50
#nifty500
#niftytomorrow
#niftytoday
#NiftyCE
#bankniftyoptions
#sensex
#sensexindia
#sensextoday
#bankniftytips
#bankniftyanalysis
#bankniftytrading
#bankniftyoptions
#finnifty
#bankniftystrategies
#niftystrategies
#bse#bseindia
#bsesensex
#nsenifty
#nsebse
#nseindia
#STOCKMARKETEDUCATION
#STOCKMARKETUPTODATE
#STOCKMARKETTODAY
#stockmarkets
#tommorrowMarketPrediction
#nfityoutlookfornextweek
#bankniftyoutlookfornext week
#bankniftyoutlookformonday
#niftyforecast
#bankniftyforecast
#niftyshareprice
#bankniftyshareprice
#tommorrowniftyprediction
#tommorrobankniftypredicton
#niftytargettommrrow
#bankniftytargettommrrow
#bankniftylive
#banknifty
#bankniftyoptions
#bankniftystrategies
#bankniftyfuture
#bankniftyoptionstrategy
#bankniftycalls
#bankniftyintraday
#bankniftylivetrading
#bankniftyweeklyexpiry
#bankniftycrash
#bankniftytomorrow
#bankniftypredictions
#bankniftychart
#bankniftytips
#bankniftypremium
#bankniftyoptions
#bankniftyfuture
#bankniftytomorrowprediction
#bankniftyoption
#niftyweeklyexpiry
#stockmarketinindia
#derivatives
#niftypredictions
#niftytips
#bank nifty analysis,
#bank nifty prediction for tomorrow,
#bank nifty analysis
#bank nifty tomorrow,
#nifty prediction for tomorrow,
#nifty prediction,
#nifty analysis,
#banknifty tomorrow,
#bank nifty tomorrow analysis,
#nifty tomorrow,
#bank nifty analysis for tomorrow,
#nifty analysis for tomorrow,
#stock market crash,
#stock market latest news today,
#bank nifty live,
#live trading bank nifty,
#nifty live trading,
#live trading,
#bank nifty live trading

Nifty for 6th October 2023 - Weekly ClosingAs Expected ( Please refer to the linked post) Nifty opens with an up gap at 19521, which is near immediate resistance i.e. 19544-19550.
Since it was a gap-up opening of approximately 100 points and near resistance, creating new long positions immediately makes no sense.
Why was I expecting a Gap-up opening today?
1. Prices bounced twice from the support area during the day.
2. Prices closed well ( in spite of weakness during the day)
3. RSI was at support ( 40 levels)
4. Hammer-like candle formed at support
Today's Price Action
1. Opened Gap up
2. Prices Halted at resistance during the first hour.
3. No sell-off from resistance.
4. Prices consolidated around the resistance area( 19544-19550)
5. Higher High, higher low, gap up indecisive candle.
Expectation for Tomorrow - Friday, 6th October 2023
1. Prices might open with an up gap tomorrow, how far don't know.
2. Immediate Resistance @ 19638
3. Prices should sustain the 19543 level for a move towards 19638 levels.
4. Expecting 80-100 points move tomorrow.
Why am I Expecting a Gap up tomorrow
1. No sell-off after a gap-up opening near resistance
2. Prices consolidated well on the hourly and 15-minute chart

NIFTY ANALYSIS FOR 5th OCT 2023-FOR EDUCATION PURPOSENIFTY ANALYSIS FOR 5th OCT 2023-FOR EDUCATION PURPOSE
This video is for educational purpose and my personal view . We are NOT SEBI registered Advisor, we only give the level on our practical trading experience. Kindly take the trade according to your risk and reward position and consulting your advisor. It is advisable to take the advice of SEBI registered advisor.
@vijayanjum
#nse
#nsebse
#Nifty
#niftyfifty
#bankniftytrading
#nfitybank
#niftypredictionfortomorrow
#niftyoptions
#NiftyBank
#nifty50
#nifty500
#niftytomorrow
#niftytoday
#NiftyCE
#bankniftyoptions
#sensex
#sensexindia
#sensextoday
#bankniftytips
#bankniftyanalysis
#bankniftytrading
#bankniftyoptions
#finnifty
#bankniftystrategies
#niftystrategies
#bse#bseindia
#bsesensex
#nsenifty
#nsebse
#nseindia
#STOCKMARKETEDUCATION
#STOCKMARKETUPTODATE
#STOCKMARKETTODAY
#stockmarkets
#tommorrowMarketPrediction
#nfityoutlookfornextweek
#bankniftyoutlookfornext week
#bankniftyoutlookformonday
#niftyforecast
#bankniftyforecast
#niftyshareprice
#bankniftyshareprice
#tommorrowniftyprediction
#tommorrobankniftypredicton
#niftytargettommrrow
#bankniftytargettommrrow
#bankniftylive
#banknifty
#bankniftyoptions
#bankniftystrategies
#bankniftyfuture
#bankniftyoptionstrategy
#bankniftycalls
#bankniftyintraday
#bankniftylivetrading
#bankniftyweeklyexpiry
#bankniftycrash
#bankniftytomorrow
#bankniftypredictions
#bankniftychart
#bankniftytips
#bankniftypremium
#bankniftyoptions
#bankniftyfuture
#bankniftytomorrowprediction
#bankniftyoption
#niftyweeklyexpiry
#stockmarketinindia
#derivatives
#niftypredictions
#niftytips
#bank nifty analysis,
#bank nifty prediction for tomorrow,
#bank nifty analysis
#bank nifty tomorrow,
#nifty prediction for tomorrow,
#nifty prediction,
#nifty analysis,
#banknifty tomorrow,
#bank nifty tomorrow analysis,
#nifty tomorrow,
#bank nifty analysis for tomorrow,
#nifty analysis for tomorrow,
#stock market crash,
#stock market latest news today,
#bank nifty live,
#live trading bank nifty,
#nifty live trading,
#live trading,
#bank nifty live trading
