The Nifty spot intraday trend forecast for December 09, 2024According to my analysis, On December 09, 2024, the Nifty spot may begin with a Gap up opening and the intraday trend looks bullish till 1.30pm then may likely to take a sideways momentum. The Nifty may close on a bullish note. Technical confirmation is a must and trade with strict Stop-Loss.
The information provided here is only for the educational purposes.
Niftyoptions

NIFTY Surges 900+ Points: Massive Gains Unlocked!NIFTY on the 1-hour timeframe displayed an exceptional bullish momentum, achieving 900+ points in profit so far. This long trade setup, captured using the Risological Swing Trading Indicator , has already hit TP1 and TP2, with the remaining targets likely to be reached soon.
NIFTY Key Levels:
TP1: 24204.50 ✅
TP2: 24786.30 ✅
TP3: 25368.10 🔄
TP4: 25727.65 🔄
NIFTY Technical Analysis:
The trade initiated at 23844.95 with a stop-loss at 23554.05, providing an excellent risk-to-reward ratio.
The price consistently respected the Risological trend line, confirming the strength of the uptrend. Both TP1 and TP2 have been achieved, showcasing the precision of the system.
The breakout above key resistance levels hints at a continuation towards the upper targets.
This setup reflects how effectively the Risological Swing Trading Indicator identifies profitable opportunities with minimal risk.
Namaste!

Nifty technical analysis for tomorrow (06/Dec/2024)Nifty moments for option and future trading 06/Dec/2024
follow us for more updates information.
message us for any stocks related information

NIFTY : Trading Plan and levels for 06-Dec-2024Trading Plan for Nifty – 06-Dec-2024
Intro to the Previous Day's Chart Pattern:
On 05-Dec-2024, Nifty exhibited a volatile session but from the level (excatly where I mentioned in yesterday's trade pan) a significant rally towards the Wave C completion zone but a huge volatility in the prices seen in the last trading hour, . A sharp rejection from this zone reinforced bearish pressure, driving the index back to the Opening Support/Resistance zone at ₹24,697 . The chart highlighted three critical zones:
Red Trend: Bearish resistance around Wave C completion ( ₹25,050 ).
Yellow Trend: Sideways consolidation in the Opening Resistance Zone (₹24,882–₹24,697) .
Green Trend: Bullish momentum originating from the Initial Support Zone (₹24,412) .
Trading Plan for 06-Dec-2024
Gap Up Opening (+100 Points):
If Nifty opens above ₹24,882 , it will likely face immediate resistance at the Wave C completion zone (₹25,050) .
Action Plan:
Look for bearish rejections or reversal candlestick patterns near ₹25,050 . A failure to sustain above this level indicates a shorting opportunity, targeting ₹24,697 and ₹24,412 .
If Nifty sustains above ₹25,050 for at least two 15-minute candles, it signals a breakout. Go long, aiming for ₹25,300 and ₹25,450 .
Risk Management Tip:
Use a trailing stop-loss once the trade moves in your favor. For options, consider selling OTM puts below ₹24,700 to benefit from time decay.
Flat Opening (Near ₹24,697):
A flat opening will test the Opening Support/Resistance zone (₹24,697) .
Action Plan:
If Nifty holds above ₹24,697 , expect a bullish move towards ₹24,882 . Breakout above this level can lead to ₹25,050 .
Failure to sustain ₹24,697 could drag Nifty towards the Initial Support Zone (₹24,412) . Monitor for price rejection at ₹24,412 for potential long entries.
Risk Management Tip:
For flat openings, avoid aggressive entries. Let the first 30 minutes establish the trend, then act accordingly. Use spreads (e.g., bull call spreads) to cap your risk in options.
Gap Down Opening (-100 Points):
A gap-down opening near ₹24,412 or below will test key supports.
Action Plan:
If Nifty finds support at ₹24,412 , look for bullish price action. Enter long positions targeting ₹24,697 and ₹24,882 .
If Nifty breaks ₹24,412 , the next critical zone lies at ₹24,224–₹24,142 . Watch for signs of demand in this deep retracement zone for potential reversals.
Risk Management Tip:
In case of high volatility, trade with reduced position sizes. Use iron condors or straddles to take advantage of elevated option premiums during gap-down scenarios.
Summary and Conclusion:
Resistance Levels: ₹24,882, ₹25,050
Support Levels: ₹24,697, ₹24,412, ₹24,224
Key levels to watch: A breakout above ₹25,050 or a breakdown below ₹24,412 will dictate intraday momentum.
Use proper risk management strategies like trailing stop-losses and avoid over-leveraging in volatile markets.
Disclaimer:
The above analysis is for educational purposes only . I am not a SEBI-registered analyst. Please perform your own research or consult a financial advisor before making any trading decisions. Markets involve risk; trade responsibly.

Waiting for 24540 area break NSE:NIFTY
I am not SEBI registered :) This is not a trading advice.
An upward break and close above the 24,540 level could signal more upside, indicating strong buying momentum and a potential continuation of the uptrend.
Let me know your thoughts or if you have any suggestions/questions.

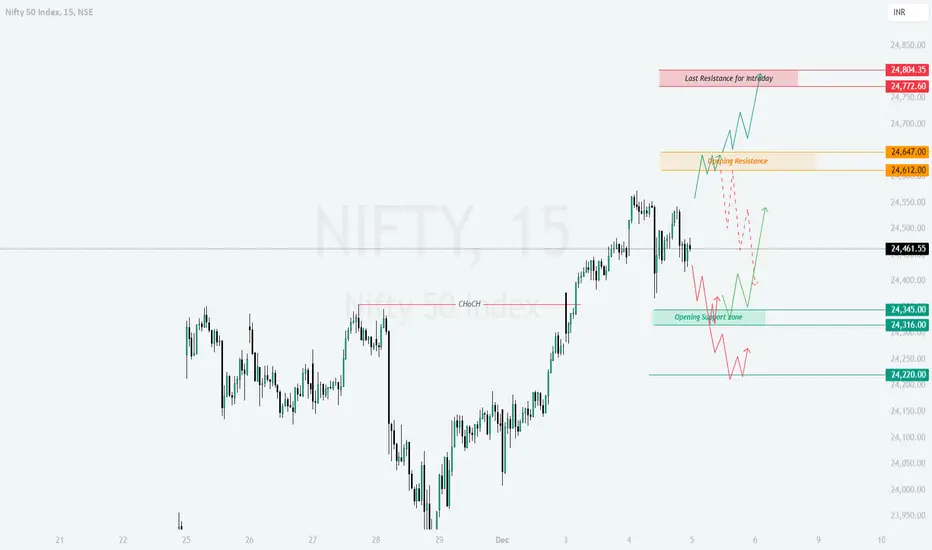
NIFTY : Trading levels and Plan for 05-Dec-2024Trading Plan for Nifty – 05-Dec-2024
Intro: Previous Day's Chart Pattern
Nifty on 04-Dec-2024 displayed mixed momentum, with a clear rejection from the upper resistance zone near ₹24,550 - 24,570. The Yellow trend highlighted a consolidation phase, the Green trend signaled bullish potential during upward retracements, and the Red trend indicated bearish pressure around resistance levels. Key levels such as ₹24,345 acted as support, while the intraday resistance remained prominent at ₹24,772.
Plan for Different Opening Scenarios:
1. Gap-Up Opening (Above ₹24,647 by 100+ points)
If Nifty opens significantly above ₹24,647:
Key Resistance Levels: ₹24,772 and ₹24,804 will be the major zones to watch for profit booking and potential reversals.
Action Plan: Allow the first 15–30 minutes for price discovery. Look for pullbacks near ₹24,647 for entry into long positions, with a stop loss below ₹24,612. Targets will be ₹24,772 and ₹24,804.
Failure to Sustain Above ₹24,647: If prices fail to hold above ₹24,647, avoid longs and observe price action near ₹24,612 for re-entry possibilities.
Risk Management: Tighten stop losses when approaching the resistance zone to secure profits. Avoid aggressive long positions unless the bullish trend sustains.
2. Flat Opening (Within ₹24,316 to ₹24,461)
If Nifty opens near its previous close:
Key Support and Resistance Levels: ₹24,345 serves as opening support, while ₹24,461 and ₹24,647 are the immediate resistance zones.
Action Plan: Wait for a clear breakout or breakdown.
Long positions can be initiated above ₹24,461, targeting ₹24,647 and ₹24,772, with a stop loss below ₹24,345.
Short positions should be considered if the index breaks below ₹24,345, targeting ₹24,316 and ₹24,220, with a stop loss above ₹24,461.
Risk Management: Trade cautiously within this range as the price may exhibit false breakouts. Use smaller position sizes during consolidation phases.
3. Gap-Down Opening (Below ₹24,345 by 100+ points)
If Nifty opens below ₹24,316:
Critical Support Levels: ₹24,220 will act as a critical support. Failure to sustain this level could lead to extended selling towards ₹24,100.
Action Plan:
Monitor the first 15–30 minutes. If prices rebound from ₹24,220, consider long positions for targets of ₹24,316 and ₹24,345, with a stop loss below ₹24,200.
If prices sustain below ₹24,220, initiate short positions for targets of ₹24,100 and ₹23,950, with a stop loss above ₹24,316.
Risk Management: Avoid catching falling prices; confirm reversals before entering trades. Keep positions light in volatile conditions.
Tips for Risk Management in Options Trading:
Time Decay Awareness: Avoid holding out-of-the-money options close to expiry as premium erosion accelerates.
Defined Risk Strategies: Use options spreads like bull call or bear put spreads to cap risk.
Avoid Overleveraging: Limit position sizes to avoid large losses during sudden market movements.
Monitor Volatility: Consider implied volatility before entering positions; high volatility may lead to expensive premiums.
Summary and Conclusion:
Nifty’s price action for 05-Dec-2024 revolves around key levels of ₹24,647 on the upside and ₹24,220 on the downside. Traders should focus on these zones for clear directional movements. Proper risk management and a disciplined approach are essential, especially during volatile market conditions. Always confirm the trend before initiating trades and avoid overexposure to options positions.
Disclaimer:
I am not a SEBI-registered analyst. This analysis is purely for educational purposes and should not be treated as financial advice. Consult your financial advisor before making trading decisions.
Nifty 50 Weekly Elliot wave analysisNifty 50 Weekly Elliot wave analysis-
Nifty 50 is expected to continue its downward correction.

Nifty technical analysis for tomorrow (04/Dec/2024)Nifty moments for option and future trading 04/Dec/2024
follow us for more updates information.
message us for any stocks related information

NIFTY : Trading levels and Plan for 04-Dec-2024Before I begin, I kindly ask you to hit boost or like if you enjoy my analysis. Your support keeps me motivated to dedicate my time to creating these charts for you, completely free!
Nifty Trading Plan for 04-Dec-2024 📈
On the previous trading day, Nifty witnessed a significant rally towards the completion zone of Wave C, form the the Opening important range for buyer's and Sellers (mentioned in yesterday's Plan. For upcoming trading session, the structure also highlighted a Change of Character (ChoCH) near ₹24,483, which now acts as an opening support/resistance level. Key levels such as ₹24,355 (opening resistance) and ₹24,189 (last intraday/swing support) indicate pivotal areas for monitoring price action. Yellow indicates a sideways trend, green represents bullish momentum, and red marks bearish trends.
Here’s a structured trading plan for all opening scenarios:
Gap Up Opening (+100 points or more above ₹24,445)
Profit Booking Zone (₹24,650-₹24,692): A gap-up opening near or within this zone could face sideways consolidation or immediate rejection, as it aligns with the first target of Wave C completion.
Action Plan:
Entry: Short near ₹24,692 after observing bearish reversal patterns like shooting stars or bearish engulfing.
Target: ₹24,483 (opening support/resistance zone) and ₹24,413.
Stop Loss: Above ₹24,730 to avoid false breakout risks.
Breakout Potential Above ₹24,692: Sustained buying above ₹24,692 with strong momentum could trigger bullish continuation.
Action Plan:
Entry: Long above ₹24,692 after a 15-minute candle closes above this level.
Target: ₹24,800-₹24,850.
Stop Loss: Below ₹24,600 to safeguard against pullbacks.
Flat Opening (Near ₹24,445)
Opening Support/Resistance Zone (₹24,413-₹24,483): Flat openings indicate indecision. If Nifty sustains above ₹24,483, it may show bullish strength; otherwise, a fall back to ₹24,413 is likely.
Action Plan for Bullish Scenario:
Entry: Long above ₹24,483 with strong buying pressure.
Target: ₹24,650-₹24,692.
Stop Loss: Below ₹24,413 for risk management.
Action Plan for Bearish Scenario:
Entry: Short below ₹24,413 after confirming selling pressure.
Target: ₹24,355 and ₹24,300.
Stop Loss: Above ₹24,483 to limit losses.
Retracement Monitoring at ₹24,355: If the price consolidates near ₹24,355, observe breakout patterns for direction.
Gap Down Opening (-100 points or more below ₹24,445)
Testing Swing Support (₹24,189): A gap-down opening below ₹24,300 will test the last intraday/swing support around ₹24,189. Failure to hold this level may result in further downside momentum.
Action Plan:
Entry: Short below ₹24,189 after confirming a bearish breakdown.
Target: ₹24,100 and ₹24,050 (extended downside levels).
Stop Loss: Above ₹24,250 to reduce risk.
Reversal Potential at ₹24,189: Watch for bullish reversal signals such as hammer candles or bullish engulfing near ₹24,189.
Action Plan:
Entry: Long near ₹24,189 with a confirmed reversal signal.
Target: ₹24,300 and ₹24,355.
Stop Loss: Below ₹24,150 to manage risk.
Risk Management Tips for Options Trading
Trade with limited risk strategies like vertical spreads or butterfly spreads to minimize premium losses.
Monitor implied volatility and avoid buying options in high IV environments to prevent premium erosion.
Always hedge directional trades, especially near pivotal resistance or support zones.
Avoid over-trading; focus on quality setups rather than quantity.
Keep risk per trade within 1-2% of your capital to preserve equity.
Summary and Conclusion
Nifty is approaching critical zones, with ₹24,650-₹24,692 as the profit booking/supply area and ₹24,189 acting as the last swing support. Adherence to key levels and disciplined execution will be critical for navigating intraday moves. Let price action confirm the direction before entering trades.
Disclaimer:
I am not a SEBI-registered analyst. This analysis is for educational purposes only. Kindly perform your research or consult a financial advisor before making trading decisions.

NIFTY Trade Setup for Tuesday (03-Dec-2024)NSE:NIFTY
Post Market Analysis by Srinivas Vemula
NIFTY Weekly Outlook
Economic Events :
USA Jobless Claims Data ( November 30)
India RBI Policy Repo Rate (06-Dec-2024)
Institutional Bias - Bearish ( NIFTY FUTURES)
Institutional Framework - Price Reversal
Institutional Reference Data Points - Premium Arrays
Institutional Price Delivery - ERL(BSL) to IRL( SSL)
ERL - External Range Liquidity
IRL - Internal Range Liquidity
BSL - Buy Side Liquidity
SSL - Sell Side Liquidity
Premium Arrays
Bearish Order block (H4)
Buy Side Liquidity (W1/H4)
Bearish FVG (H4)
Discount Arrays:
Bullish Breaker (H4)
Bullish Mitigation (M15)

nifty | 3rd Dec'202415m: Watch for a buy-side liquidity sweep, then await bearish confirmation to short.
Note: The overall 15m trend is bullish, but price is at a strong resistance and supply zone. If above case fails, expect an aggressive sell-side liquidity grab followed by a bullish move.

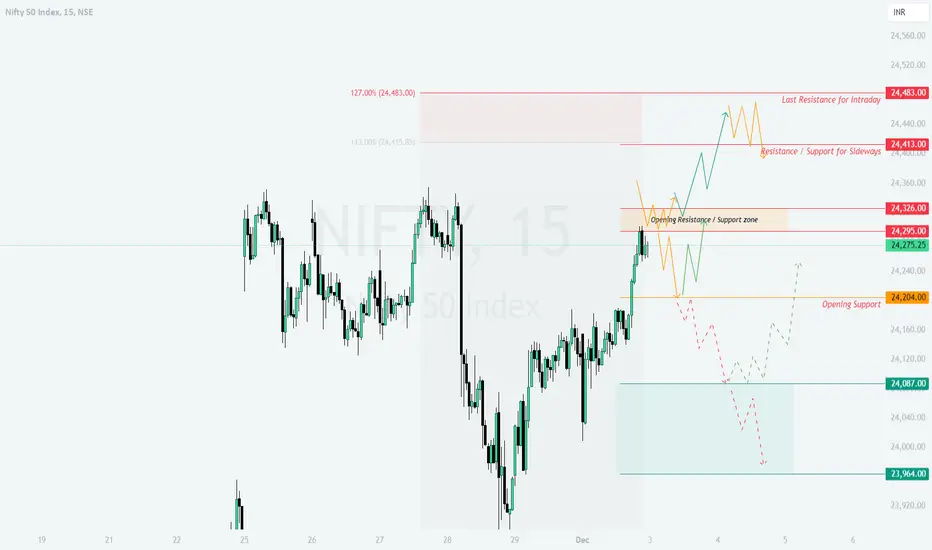
NIFTY : Levels and Plan for 03-Dec-2024Trading Plan for Nifty - 03-Dec-2024
Previous Day’s Chart Pattern Analysis:
On 02-Dec-2024, Nifty witnessed significant volatility after finding support from the mentioned support level and could manage to close near high. The index seeing resistance at 24,413, indicating profit booking near this level, while support was observed at 24,204, suggesting buyer accumulation. The yellow trend in the chart reflects sideways consolidation, green lines represent bullish moves, and red lines indicate bearish patterns. For today, the key zones from the chart will play a crucial role in determining market sentiment.
Opening Scenarios for 03-Dec-2024:
Scenario 1: Gap Up Opening (100+ Points Above 24,275)
If Nifty opens with a significant gap up above 24,375, monitor whether it sustains above the 24,413 Resistance/Support for Sideways.
- Action Plan:
- If the price stays above 24,413, look for bullish momentum towards the 24,483 Last Resistance for Intraday. Enter long positions with a target of 24,483, maintaining a stop-loss at 24,326.
- If Nifty fails to sustain above 24,413, a pullback towards 24,326 Opening Resistance/Support Zone is possible. Observe price action here before taking new trades.
- Risk Management Tip: Avoid chasing the market if the gap up is too steep, as it might lead to profit booking. Opt for spreads or hedge your positions with options.
Scenario 2: Flat Opening (Near 24,275)
In case of a flat opening around 24,275, focus on the Opening Resistance/Support Zone at 24,326.
- Action Plan:
- If Nifty breaks above 24,326 with strong volume, initiate long trades targeting 24,413, and then 24,483. Keep a stop-loss at 24,204 Opening Support.
- Conversely, if the price struggles to break 24,326 and slides below 24,275, a test of 24,204 is likely. In such a case, short positions can be considered with a target of 24,087, keeping a stop-loss at 24,326.
- Risk Management Tip: Allow the first 15-30 minutes for market stability to avoid false breakouts. Use options to trade breakouts conservatively.
Scenario 3: Gap Down Opening (100+ Points Below 24,275)
A gap-down opening below 24,175 would bring 24,087 Support Zone into focus.
- Action Plan:
- If the index holds above 24,087, expect a bounce towards 24,204 Opening Support. This could be an ideal point to go long with a stop-loss at 23,964.
- If Nifty breaches 24,087, further downside towards 23,964 is probable. In this case, short positions can be initiated with targets of 23,964, maintaining a stop-loss at 24,204.
- Risk Management Tip: In a bearish scenario, avoid aggressive trades and use protective puts to limit downside risk.
Risk Management Tips for Options Trading:/b]
Position size should be limited to 2% of your capital per trade.
Use options strategies like Iron Condors or Bull Put Spreads to manage risk in volatile conditions.
Always hedge directional trades with protective options to avoid heavy losses during sudden reversals.
Summary and Conclusion:
Today's trade revolves around key levels at 24,413, 24,326, and 24,204.
Bullish scenario: Sustained trades above 24,413 could lead to higher targets of 24,483.
Bearish scenario: A breakdown below 24,087 may open the door for further weakness towards 23,964.
Sideways scenario: Consolidation is likely between 24,204 and 24,326, requiring patience for a breakout.
Disclaimer:
I am not a SEBI-registered analyst. This analysis is for educational purposes only. Traders are advised to conduct their research or consult a financial advisor before making trading decisions.
The Nifty spot intraday forecast for December 03, 2024Nifty intraday trend for December 03, 2024 is bullish. Intraday Turning points are approximate. The price is not part of the forecast since calculations relate Time. Intraday levels may vary based on the price gaps on the either side.
Technical confirmation for entries and exits is a must and do not trade with stop-loss.
The information provided is only for the educational purposes.

The Nifty spot intraday forecast for December 02, 2024Market Outlook for Nifty Spot on December 02, 2024
Morning Movement:
Likely to see an upward move in the morning hours.
A potential drop of around 300 points is anticipated later.
Key Levels to Watch:
Resistance:
Strong resistance at 24,330.
If this level is broken, Nifty spot could rise to 24,385, provided there is no gap opening on either side.
Support:
On the downside, support levels are at 23,947 and 23,831.
Overall Sentiment:
The Nifty is expected to close on a bearish note.
Disclaimer:
These views are for educational purposes only.
Please use your own technical analysis for entry and exit decisions.
Always trade with a stop-loss to manage risks effectively.

nifty forecast for 2nd Dec'2024Market may grab sell-side liquidity, create an inducement, target buy-side liquidity, and then turn bearish.

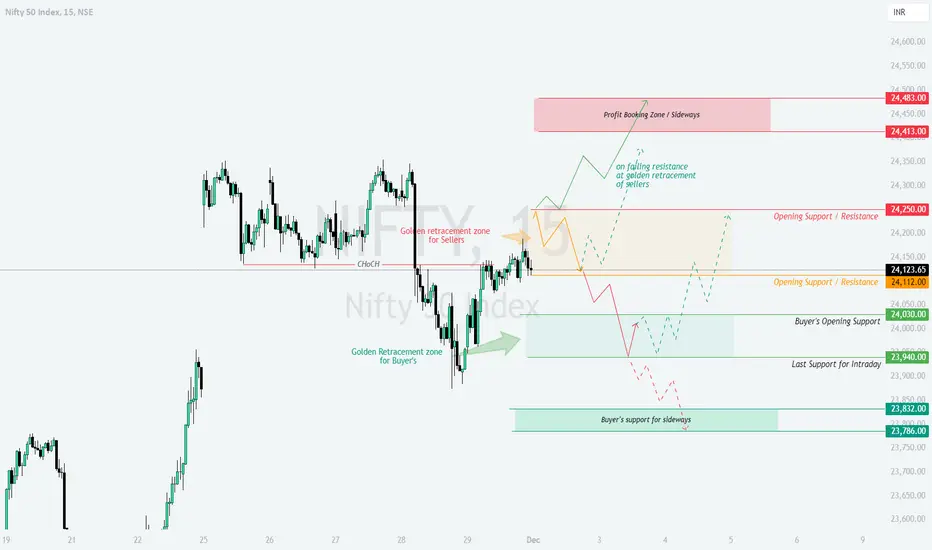
NIFTY : Levels and Plan for 02-Dec-2024Nifty 50 Trading Plan for 02-Dec-2024
On 01-Dec-2024, Nifty traded in a well-defined structure, oscillating between the Golden Retracement Zones for buyers and sellers. The market displayed a Change of Character (CHoCH), with price initially retesting the buyer's support zone near 23,786 before reversing toward the seller's resistance zone at 24,413. Key levels such as 24,250 and 24,112 acted as dynamic Opening Support/Resistance levels. The chart also highlighted a Yellow Zone for sideways movements, Green Zones for bullish trends, and Red Zones for bearish scenarios.
Detailed Trading Plan for 02-Dec-2024
Gap-Up Opening (Above 24,250, up to 100+ points)
If Nifty opens with a gap-up beyond 24,250, it will enter the Opening Resistance Zone. In this scenario:
Watch for rejection near 24,413 or higher. If rejection is confirmed, initiate short positions targeting 24,250 as the first support and 24,112 for extended profits.
For sustained bullishness, monitor an hourly candle close above 24,413. If this occurs, consider long positions with a target at the Profit Booking Zone around 24,483.
Avoid chasing trades immediately after the gap-up. Allow prices to stabilize for 15–30 minutes to validate the trend.
Flat Opening (Near 24,112 to 24,130 range)
In case of a flat opening, the Opening Support/Resistance at 24,112 will be critical:
If prices sustain above 24,112 with strong buying, consider initiating long positions, targeting 24,250 and 24,413.
If Nifty fails to hold 24,112, expect a test of 24,030 (Buyer's Opening Support) and potentially 23,940 (Last Support for Intraday).
Use tight stop losses when trading near the flat opening zone due to potential whipsaws.
Gap-Down Opening (Below 24,030, down to 100+ points)
A gap-down opening near or below 24,030 would signal bearish sentiment:
Observe buyer activity near 23,940. If support holds, initiate longs with targets of 24,030 and 24,112.
If 23,940 is breached, expect further downside toward 23,832 or even 23,786, the Buyer's Support for sideways action.
Manage risk effectively by waiting for hourly candle confirmation in case of volatile downward moves.
Risk Management Tips for Options Traders
Trade options with a defined stop loss and avoid overleveraging.
Use spreads (e.g., Bull Call Spread or Bear Put Spread) to reduce premium outflows and limit risk.
Monitor implied volatility (IV) levels, as sudden changes can impact option premiums significantly.
Summary and Conclusion
Nifty's key levels for 02-Dec-2024 include 24,413 (Profit Booking Zone), 24,250/24,112 (Critical Opening Support/Resistance), and 23,940/23,786 (Key Buyer Support Zones).
Focus on hourly candle confirmations for validating breakouts or breakdowns.
Stay cautious during initial market volatility and align trades with the prevailing trend as highlighted by the Yellow (sideways), Green (bullish), and Red (bearish) zones.
Disclaimer
I am not a SEBI-registered analyst. This analysis is for educational purposes only. Please consult your financial advisor before making trading decisions.
The Nifty Spot direction for the month of December 2024If you listen, you might forget. If you see, you will remember. Presenting the Nifty Spot Daily/End-of-Day Trend Forecast for December 2024. Pay close attention to the calculated turning dates and their directions, as these insights can guide traders in making informed decisions. Please note that price levels may vary, as the primary focus is on timing and trend direction.
In summary, December 2024 appears to be a bearish month for the Nifty. My Timing Analysis provides valuable insights to help traders closely assess market direction.
If you are a trader, do not trade without Stop-Loss.

The Nifty Spot Intraday view on November 29, 2024It is just my view on the Nifty Spot intraday on November 29, 2024. The support and resistance levels given in the picture may vary. However, I have a bullish view on Nifty Intraday. Please note that my view is only for educational purposes but not a recommendation to buy or sell.

The Nifty Spot Intraday forecast for November 28, 2024Technically, on November 28, 2024, the Nifty spot intraday trend looks bearish. The Nifty spot resistance is at 24330 and support is at 24070 with a stop-loss at 24365. It is better to avoid intraday buy signals for tomorrow that is on November 28, 2024 and focus on the sell signals.

NIFTY : Trading Levels and Plan for 26-Nov-2024Trading Plan for NIFTY - 26th November 2024
Previous Day's Chart Analysis:
NIFTY showed a volatile movement after hitting day high at 25351, and closed near resistance zone that I had already highlighted in yesterdays plan. (highlighted in Yellow ) within the "No Trade Zone," respecting the resistance at 24,432 and support near 24,243 . Bullish momentum ( Green ) was seen towards the upper resistance zones, while bearish ( Red ) price action retraced near the support zones. The key levels of 24,609 (Profit Booking Zone) and 24,041 (Best Buy Zone at Retracement) acted as crucial points for traders.
Trading Plan for 26th November 2024:
Gap-Up Opening (Above 24,432):
If NIFTY opens with a Gap-Up above the critical resistance of 24,432 , it is crucial to observe the price behavior near 24,609 .
A sustained breakout above 24,609 indicates bullish continuation, targeting higher levels.
However, if rejection is observed near 24,609 , a pullback towards 24,432 is likely, which could act as support. Wait for a retest before entering long positions.
Flat Opening (Near 24,250):
A flat opening within the "No Trade Zone" requires patience.
A breakout above 24,325 (upper range of the zone) signals bullish momentum, with targets of 24,432 and beyond.
Conversely, a breakdown below 24,243 could lead to bearish moves targeting 24,105.95 and 24,041 . Avoid trading within the zone to minimize false signals.
Gap-Down Opening (Below 24,243):
A Gap-Down opening below 24,243 will turn the focus to key support levels.
If prices stabilize near 24,105.95 or 24,064.15 , look for signs of recovery to enter long trades.
Failure to hold these supports could trigger further bearish moves towards 23,899 . Aggressive traders can short with tight stop losses.
Risk Management Tips for Options Trading:
Avoid aggressive positions during the first 30 minutes of opening to let the trend settle.
Use strict stop losses and avoid over-leveraging.
Monitor the option's premium decay and implied volatility if the price remains within the "No Trade Zone."
Diversify between directional and non-directional strategies depending on market conditions.
Summary & Conclusion:
The key to successful trading lies in patience and discipline. Focus on the levels discussed ( 24,609 , 24,432 , 24,041 ) for directional trades, and avoid trading within the "No Trade Zone" ( 24,325–24,243 ) to prevent unnecessary risks. Both bullish ( Green ) and bearish ( Red ) scenarios offer opportunities, provided traders respect the levels and manage their risks effectively.
Disclaimer:
I am not a SEBI-registered analyst. The above analysis is for educational purposes only. Please consult with your financial advisor before making any trading decisions.

NIFTY : Trading Levels for 25-Nov-2024Nifty Trading Plan for 25-Nov-2024
Introduction:
In the previous session, Nifty displayed a recovery after testing lower support levels mentioned in plan and closed near day high, with buyers stepping in near the retracement zone ( Green ). The index faced resistance in the 23,873–23,920 range ( Yellow ), leading to sideways movement. For today, the market behavior will depend on how Nifty reacts to key levels, with breakout potential to 24,261 or breakdown risks toward 23,411 .
Trading Scenarios for 25-Nov-2024:
Gap-Up Opening (100+ points):
If Nifty opens above 23,920 , the focus will be on the immediate resistance level at 24,261 :
A breakout above 24,261 could lead to a strong bullish trend, with potential targets at 24,350 and beyond. Look for price consolidation above 24,261 before entering long trades.
Failure to sustain above 24,261 may result in a pullback toward 23,873 , offering a short-term reversal opportunity.
Wait for confirmation of the breakout before entering trades to avoid whipsaws.
Flat Opening:
A flat opening near 23,873 will bring the "Opening Support / Resistance Zone" ( 23,845–23,920 ) into focus:
A bullish breakout above 23,920 could target 24,261 as the next resistance.
A bearish breakdown below 23,845 may trigger selling pressure toward 23,759 or 23,684 .
Avoid trading within the range ( 23,845–23,920 ) until the trend direction becomes clear.
Gap-Down Opening (100+ points):
If Nifty opens below 23,759 , the immediate support lies at 23,684 , followed by 23,605 :
A breakdown below 23,605 may lead to accelerated selling, targeting 23,411 . Monitor volume and price action for confirmation.
A bounce from 23,684 or 23,605 could indicate a recovery, with potential upside back to 23,759 and 23,845 .
Be cautious, as a gap-down opening may lead to heightened volatility.
Risk Management Tips for Options Trading:
Use strike prices close to the spot price for better liquidity and responsiveness.
Implement strict stop-losses based on support and resistance zones.
Avoid trading during the initial 15-30 minutes after market opening, as volatility may produce false signals.
Limit your position size to manage risk effectively during uncertain market conditions.
Summary and Conclusion:
Nifty is at a critical juncture with key levels at 23,920 and 23,845 acting as immediate resistance and support. A breakout above 23,920 could drive bullish momentum, while a breakdown below 23,845 may lead to bearish continuation. Follow the trading plan and avoid impulsive trades. Always prioritize risk management to safeguard capital.
Disclaimer: I am not a SEBI-registered analyst. The analysis shared is for educational purposes only. Please consult your financial advisor before making any trading decisions.

NIFTY : Trading Levels for 22-11-2024Nifty Trading Plan for 22-Nov-2024
Introduction:
In the previous session, With a Opening Drop in Nifty displayed a consolidation pattern near the support zone with a lack of strong follow-through on either side. The index closed near 23,346.75, hinting at indecision among traders. Key levels have been identified for today's trading, with distinct zones marked: Yellow for sideways movements, Green for bullish trends, and Red for bearish trends.
Trading Scenarios for 22-Nov-2024:
Gap-Up Opening (100+ points):
If Nifty opens above 23,414 , it will likely face resistance near 23,522 . Look for price action in this zone:
If rejection occurs at 23,522 , a retracement towards the 23,414 level is possible, offering a shorting opportunity.
If an hourly candle sustains above 23,522 , it can target the next resistance at 23,669 .
Wait for clear breakouts or rejections before entering trades. Avoid chasing prices in a strong gap-up scenario to minimize risk.
Flat Opening:
In case of a flat opening near 23,346 , monitor the immediate support at 23,295 :
A breakdown below 23,295 can lead to a bearish move towards 23,231 .
If Nifty holds the 23,346 level and moves above 23,414 , a bullish momentum toward 23,522 is likely.
Trade cautiously in the flat opening zone, as the initial price action might remain range-bound.
Gap-Down Opening (100+ points):
If Nifty opens below 23,231 , the 23,120 support zone will be crucial:
A breach of 23,120 could trigger a sharp sell-off towards 22,986 .
If prices reverse from the 23,120 level, expect a recovery rally back to 23,231 or 23,295 .
Watch for rejection or reversal candlestick patterns at these levels before entering trades.
Risk Management Tips for Options Trading:
Avoid trading during the first 15 minutes of market opening to let volatility settle.
Use defined stop losses based on hourly candle closings.
Focus on at-the-money options for higher liquidity and better premiums.
Limit your risk to 1-2% of your total trading capital per trade.
Summary and Conclusion:
The market's direction today hinges on how it reacts to key levels around 23,414 (resistance) and 23,295 (support). Keep an eye on broader trends and ensure to wait for confirmation signals before initiating trades. Practice strict risk management to safeguard against market volatility.
Disclaimer: I am not a SEBI-registered analyst. The above analysis is for educational purposes only. Please consult your financial advisor before making any investment or trading decisions.

NIFTY : Trading Levels and Plan for 21-Nov-2024Nifty Trading Plan for 21-Nov-2024
Intro:
On 20-Nov-2024, Nifty displayed a volatile session, with the index struggling to sustain above 23,712 , the last intraday resistance. A yellow-shaded "No Trade Zone" highlighted indecisive price action between 23,561 and 23,622 . The index tested support near 23,296 , which aligns with an SMC entry zone and buyer’s support after a liquidity sweep. The green trend depicted potential bullish moves, while the red trend reflected bearish reversals, helping traders prepare for possible outcomes in the upcoming session.
Trading Plan for 21-Nov-2024:
Gap Up Opening (100+ points above 23,561):
If Nifty opens above 23,622 , monitor for a breakout above 23,712 . Sustained movement here could target the Profit Booking Zone (23,815–23,860) .
Wait for the first 15–30 minutes to gauge market direction.
Failure to hold above 23,622 might indicate a reversal, pushing the index back into the "No Trade Zone."
Flat Opening (Near 23,561):
A flat opening within the "No Trade Zone" requires patience. Look for a breakout above 23,622 to go long, targeting 23,712 .
A breakdown below 23,468 may trigger bearish momentum toward 23,296 or lower.
Avoid entering trades in the yellow-shaded zone to reduce risk from whipsaws.
Gap Down Opening (100+ points below 23,468):
A gap down below 23,441 may result in bearish momentum towards 23,296 , where buyers could provide support.
If 23,296 holds, watch for a pullback toward 23,468 or higher.
A breakdown below 23,296 could open doors to deeper bearish moves, targeting 22,964 . Use tight stop-losses for short positions.
Risk Management Tips for Options Traders:
Use stop-losses based on the hourly candle close to avoid getting trapped by intraday volatility.
Avoid trading large positions in the "No Trade Zone"; focus on directional confirmation.
For gap openings, consider strategies like spreads to manage premiums and volatility.
Limit risk to 1–2% of your capital per trade to safeguard against sudden market moves.
Summary and Conclusion:
Key levels to watch are 23,712 on the upside and 23,296 on the downside.
Trade cautiously within the "No Trade Zone" ( 23,561 – 23,622 ).
Let the price action guide your trades, with trends expected to be influenced by intraday volatility.
Disclaimer:
I am not a SEBI-registered analyst. This trading plan is for educational purposes only. Traders are advised to conduct their analysis or consult a financial advisor before making any trading decisions.
