NIFTY--Supply zone@21700 ??After a strong fall, expecting some retracement in nifty.
on topside supply zone is identified at 21650-21700 levels.
so liquidity is lies above and below this levels,
after testing these levels again have a chance of fallback to test the demand zones at 21300 levels and at 20800 levels.
If 21300 level fails to push it upside, quick drop and rise will see in coming sessions.
so this week mostly in this range 21700-21300 levels.
Be careful, long after 21700 short below 21300.
Niftyoutlook

Nifty trapped between strong support and strong resistanceRight now Nifty seems to be trapped between strong support and strong resistance. The support zone is 21415 to 21581. Resistance zone is 21670 to 21847. Nifty needs little bit of consolidation in the range. Results from various companies will drive the nifty forward in either direction. The interim budget is also around the corner that can also be a guiding light for Nifty. Wild swings in either direction in addition to Geo-Political events can also turn the fate of Nifty and things can turn cloudy in a session or two. My advice for now will be stick to large caps and selective mid and small caps with ethical management and strong fundamentals and avoid companies with low durability, high debt, high pledging and questionable ethics. Which should be the case anyway but more so with Macro and Micro global situations and events which are in progress and around the corner.

Nifty trying to form bottom after taking channel bottom supportNifty trying to form a bottom after taking channel bottom support. Nity touched the bottom of our hourly channel and trying to consolidate in the zone. Major support for Nifty from here will be 21405 (200 Hours EMA) (Father Line) and Channel bottom 21285. If 21285 is broken Nifty may fall further till 21089 or even 20967. On the way up major resistances that Nifty will face now are 21544, 21650 and 21715 (Major Resistance 50 Hours EMA). Also note that Mid channel channel resistance is also near 21740 region. So 21715 to 21740 will be major resistance on the way up. Nifty might try to stage a recovery tomorrow but let us see if the levels hold. Weekly closing is important with Geo-Political tensions rising between Iran and Pakistan. As well as Afghanistan and Pakistan.

NIFTY--Breakout or Fakeout??Nifty is trending higher and higher...
Closing is given above the ATH again,
If this is a breakout, in the next session it will continue its momentum higher again.
If it is a fakeout,buyers trapped in today's bullish move.
If a retest to the previous ATH Is given,and continues, go long, otherwise keep in short side, below the channel again.

NiftyNifty 1hr chart nifty forming like Ascending Triangle Pattern nifty if will be go upside only one condition it have to break trendline firstly then it will be sustain on 21755 with good green candle..

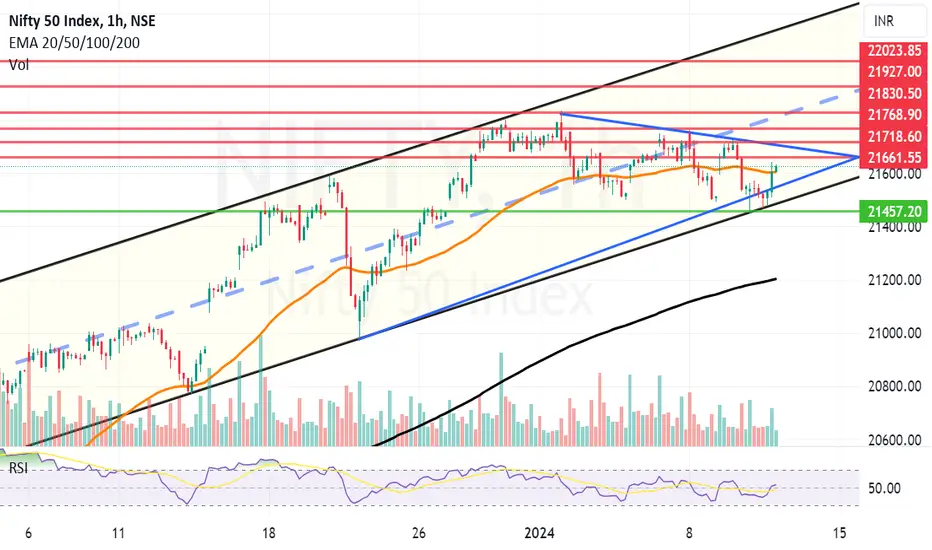
Nifty closed strongly above 50 hours EMA more upside possibleNifty closed strongly above 50 hours EMA after testing exactly the channel bottom drawn and shown by us from last few days more upside is possible but important resistances for Nifty to cross on the way up will be 21661, 21718 and 21768. closing above 21768 will open the doors for 22K+ again with resistances at 21830 and 21927. Supports for Nifty on the lower side are at 21604, 21514 and 21457. Below 21457 bears wake up again. Things look positive for a good start tomorrow but later in the day there can be some resistance + Selling pressure at 21661 and 21718 or 21768.
Nifty felt the heat again in the trend line resistance. As you can see in the chart Nifty started the day brilliantly jumped above 50 Hours EMA and was going up in a rapid pace wiping all the losses of yesterday till it hit the trend line resistance which was near 21725 and immediately fell relentlessly giving a big red candle for the day. Only saving grace was it ended in Green at the close of the day again finding the support near 21500 this time at 21517. Support and resistance for Nifty now will be at 21619 50 Hours EMA (tough resistance), 21700 and 21768 another tough mid channel resistance. Supports on the lower side are near 21500, 21389 and finally 21235. Volatility and Profit booking at higher levels in selected counters in addition to buying at lower levels again may remain the theme for some time now.

Nifty Showing weakness and near important support level.Nifty was repelled from the resistance zone near 21768 and got thrashed throughout the day as RSI had to cool down. Further downside is possible if support zone of 21500 to 21425 is broken. In this case further down side upto 21389 or 21235 is possible. The worst case scenario as of now looks near 21143. In case 21143 is broken Bears can strengthen their grip and bring the index under their control. Resistances zone on the up side is between 21593 and 21613. Further upside upto 21686 or 21768 can be seen in case we are able to close above 21613 level.

Nifty Daily Chart Nifty also form hh and hl first resistance 21755 & second resistance 21834. It's very important nifty will be sustain on 21755 1hr chart or gap up on 21755 with strong candle then breakout it's will be make new high again..

Regression Channel - Nifty - Day & 1hr timeframe1. Change in the regression trend at day timeframe, 1st Dec 23
It occurred with Gap formation, which will act as good support
2. Another Regression channel can be observed at 1hr time frame
3. Spinning Top Formation at the weekly timeframe, implicates bearish sentiment in the last week's price movement
Another "change in the trend" is expected

NIFTY--Trading in a channel??Nifty is still trading in a channel...
wait until price breaks this channel for complete bearishness...
as of now no sign of bearishness is observed in NIFTY...
If price failed to move again from the channel bottom then will think of bearishness.

Nifty live prediction for today 3rd Jan 24As we have discussed, Nifty has been moving upwards in the channel. Now, it has broken down to the lower channel, which shows a bearishness in the NIFTY behavior. There is a high probability that it will now continue in the lower channel as a bearish trend. OI data also confirms its bearish nature with PCR = 0.70. it will be bearish for now.
Reasons:
It has entered the bearish channel side. Now, fall might be sharp. (Bearish)
Price < EMAs that show the bearishness in the market. also it has given crossover(ema(13,50)) which always shows reversal of the trend.
RSI = 40 shows the weak bulls and might enter <40 that will be the start of heavy bearishness.
if we see the OI data PCR = 0.70 which shows bearishness in the market.
21500 will be acting as a nice support level to the downside. Upside 21600 will be acting as a nice resistance zone; OI data also confirms that.
Verdict:
Bearish
Plan of action:
Sell 21550 CE and hedge it with a small CE premium.

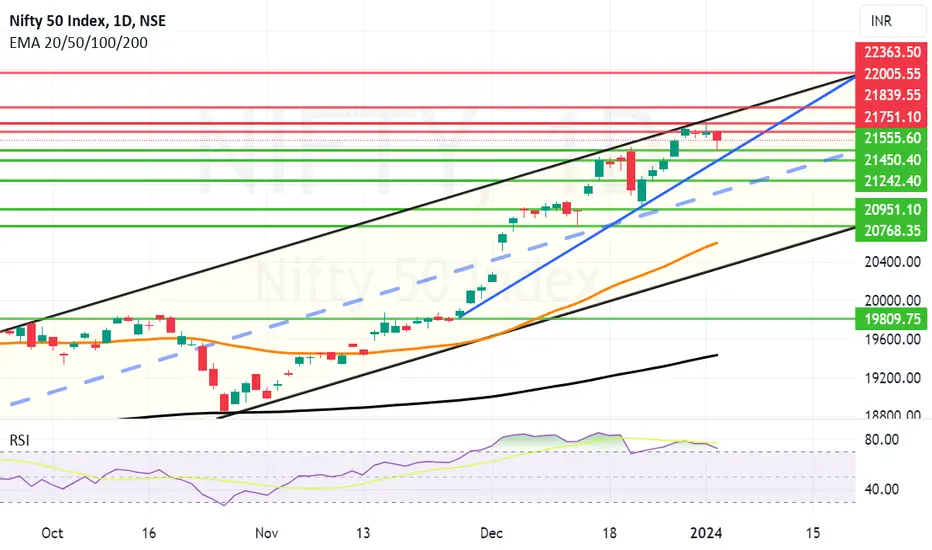
Weakness can continue if important levels breached. Two key levels for Nifty to hold on in this market weakness triggered by some global events and Profit booking are 21555 and 21450. Closing below 21450 can lead to further weakness and Nifty can fall to the levels of 21242, 20951 or even 20768. The worst case scenario visible as of now seems to be 20592. In case 20592 is breached Bears will start calling the shots and pull Nifty back levels of 19809 are possible but not probable. (Major Negative News). In case Nifty takes support at 21555 or 21450, form a bottom and bounce resistance will be near 21751, 21839. Closing above 21839 will open the door towards channel top area which can lead Nifty to 22K or even 22363 levels.
#NIFTY Intraday Support and Resistance Levels -27/12/2023Nifty will be gap up opening in today's session. After opening nifty sustain above 21460 level and then possible upside rally up to 21580 level in today's session. in case nifty trades below 21430 level then the downside target can go up to the 21310 level.

Nifty continues good show, ends above mid-channel resistanceNifty continues good show and ended the day above mid-channel resistance. Nifty right now looks pretty fairly placed to touch the previous high or end making a new high. Top of the currently looks near 21800. The resistances on the way towards top of the channel are at 21483, 21541 and 21592. Crossing and closing above 21592 will open the doors for 21800. Supports on the down side are near 21397, 21303 (Major Support 50 Hours EMA), 21113 and finally channel bottom near 20980. Trend will change to negative if we get a closing below 20696.

NIFTY--@Golden Zone??After a strong rise price is given us retracement to enter long again....
Price is exactly closed in the golden zone.
there is no sign of reversal....
If consolidation happens at bottom side,
we have more chance of liquidity grab below 20800.
Ma be after clearing that liquidity price goes upside...keep looking for buy if price comes below this level.
If consolidation happens again at ATH, chances of breaking topside is more.
Keep safe before short.

NIFTY prediction for today 20 Dec 23As we discussed, nifty will be forming a double top. It has completed the double top, and 21500 worked a nice resistance. Now, for today, 21500 will be acting as a nice deciding line. If it breaks above and consolidates upside, then it might go higher; otherwise, 21500 might work as a turning reversal point for Nifty.
Reasons:
DOUBLE Top formation is already completed. In the last 30 minutes, there was a lot of pressure from sellers with great power. (Bearish)
Ascending triangle pattern completion is there, which shows the trend might continue.
OI has PCR 0.99, is bullish, and 21400 has quite nice additional PE writing. (bullish)
RSI is 40-60, which means it is mostly sideways.
Price > EMAs(13,50,200) shows bulls are still having market control. (Bullish)
21300 will be providing a nice price action support point.
If it breaks to the upside, 21650 will provide a nice target point.
Verdict:
If it breaks to the upside, Sideways or Bearish might go bullish.
Plan of action:
Observe 15-minute candles and be on the selling side. Follow the analysis.

#NIFTY: Next Possible target 24000?Hey Everyone,
In our view 19000 region remain important and I think price will fall within this week. once it falls at our region we can then take swing buy entry up towards 24000 region which will be area where sellers can aim at.
Please like and share!

NIFTY Prediction for tomorrow 12 Dec 23As we discussed yesterday, NIFTY did take resistance from the given resistance line and was sideways the whole day. For tomorrow, Nifty is expected to move into the inner zone. Two possible cases are explained in the chart. In case 1, it will be sideways in close range. If case 2, it might give you a little momentum to the downside.
Reasons:
EMA 50 is providing a nice support.
on the upside trendline provides a nice resistance trendline.
20850 will be acting as a good Price action support point.
PCR 0.93, which is bullish, but if we check OI the whole day, it was more of a round-off. Few new positions were created. People are waiting unless it's direction to be decided.
RSI is 40-60, which is mostly sideways.
according to OI 21000, it is working as MAX Pain, which is also a good psychological level.
Price > EMAs, which means bulls are strong.
Verdict :
Sideways
Plan of action:
Sell 21000 CE and protect it with hedging.

Nifty holding above 20900 is a good sign but one dip is overdue Nifty holding above 20900 is a good sign but one dip towards 20500 or 19900 is overdue now. The RSI is indicating overbought zone requiring a time consolidation or correction. In case of correction the supports for Nifty will be around 20851, 20708, 20506 (Strong Support), 20259 or 19903 (Major Support). If Nifty manages to close below 19903 this month Bears can write their own comeback story. Resistances on the upper side are at 21026, 21292 and 21436. Long Term Target for Nifty in 2024 will be 22746.

Much needed consolidation for Nifty at the top.Nifty is giving a much needed consolidation at the top before shifting gears and moving towards 21K or even 22K in the short to medium term. The Relative Strength Index of Nifty is still 82 which indicates things are pretty hot to handle still and need of more cooling down. Little bit of consolidation/correction would be ideal for a strong rally. But as said earlier market can remain irrational more than a an investor can remain rational. Closing of the week tomorrow will be important. Supports on the lower side remain at 20852 (Strong support), 20715, 20518 and 20315. Resistance on the upper side are at 20961, 21068, 21132 and 21183.

NIFTY Bull prediction for tomorrow As in my last analysis we discussed, NIfty has given the breakout to bulls side it has broken the highest high. Now it's expected to move higher HIGH. most levels have been marked on chart.
I am exxpecting it to retrace to 20200 levels and then once bulls take the charge nifty is going to touch above resistance trendline. It's having mild Bearish deivergence. but that can be fixed during consolidation or retesting the 20200 level.
I am expecting it to retest and than move to 20500.
Reasons:
NIFTY has aleady given the breakout. trading all time high. (Bullish)
PCR = 1.19 (Bullish)
20200 is having huge PE writing means good strong support level. (Bullish)
Upside we have good CE writing at 20400. So, traders are waiting for retest to sell lower point. (Bullish)
RSI is already in the Bullish zone. (Bullish)
Verdict:
Strong Bullish
Plan of action:
Sell 20200 PE and Buy 20250 CE once Bull trend confirms after retest.

Nifty Give a Breakout of Life time.Nifty has given a proper lifetime breakout on Friday. This Breakout has opened channel which can take Nifty towards 20700+. Resistances on the way will be at 20445 and further at 20734. Supports for Nifty will be at 20013 and 19675 on a weekly chart. These projections will be valid if Election results will be similar to Exit Poll results. If there are results which are against the popular trend and in antithesis to the Exit Poll results, we can see a mild or massive sell off too. So be watchful of the Assembly Election results.
