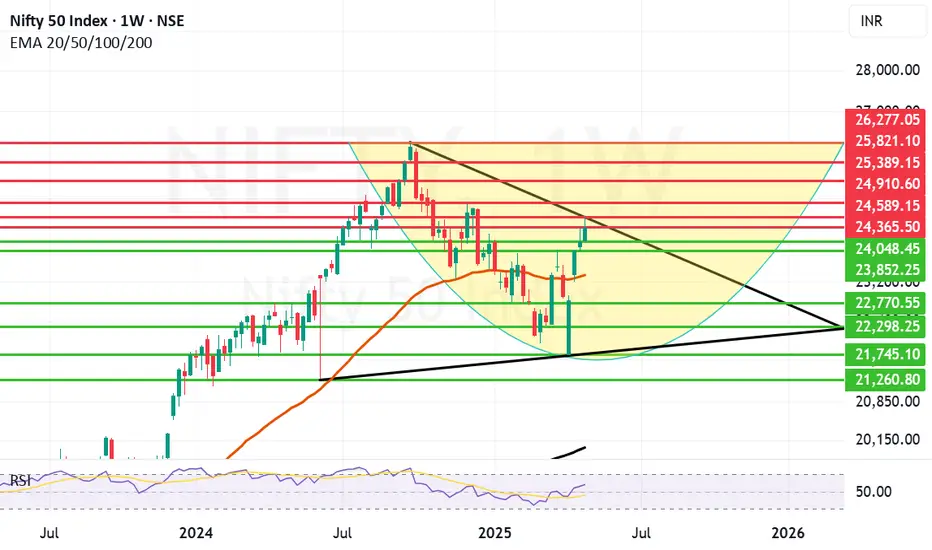
NIFTY1! (NIFTY50) Wyckoff ConsolidationNifty has most probably recorded a selling climax. Now, it's in the consolidation phase, and we're expecting a shakeout, too. It's very unlikely to go further down, but you never know. You must plan for both scenarios to stay in the game. Be market with you.
Niftyoutlook

Nifty Futures Intraday Analysis for May 13, 2025According to our Market Timing indicator, it looks bearish trend for the day. The Support levels are at 24788 and 24395 while Resistance is at 25096.
I am waiting for Sell Signal confirmation from MastersCycle indicator with a proper stop-loss to take my short position.
This is only my view. Traders are suggested to follow own technical analysis and trade with proper risk management.

Brahmos Candle took off today. The situation was delicate on Friday but weekend brought a news that was favorable for the market. The news related to Ceasefire always helps the business and give a relief to the investors. We are yet to see how things shape up when the 'war of fog' disperses but things are coming back on track it seems as of now. Trade talks between US and China are also yielding some positive vibes. Thus the market today took off like a BRAHMOS Missile and had given one of the strongest candles which is very rare to see. Things are looking very bullish as of now if everything remains calm.
The Nifty supports right now seem to be near 24802, 24621 (Trend line Support) 24361, 23849, 23648 (Mother line on Daily chart) and 23498 (Father line on Daily chart).
The Nifty Resistances right now seem to be near 24944, 25062, 25245, 25505 and 25772. Once we close above 25772 if everything remain positive we can think of regaining even 26K levels and going deeper just like our missiles. But before we reach the Euphoria zone there are a lot of resistances to be crossed.
Shadow of the candle is Bullish however there can be chances of Profit booking as well where investors can tend to take their short / medium term profit.
Disclaimer: The above information is provided for educational purpose, analysis and paper trading only. Please don't treat this as a buy or sell recommendation for the stock or index. The Techno-Funda analysis is based on data that is more than 3 months old. Supports and Resistances are determined by historic past peaks and Valley in the chart. Many other indicators and patterns like EMA, RSI, MACD, Volumes, Fibonacci, parallel channel etc. use historic data which is 3 months or older cyclical points. There is no guarantee they will work in future as markets are highly volatile and swings in prices are also due to macro and micro factors based on actions taken by the company as well as region and global events. Equity investment is subject to risks. I or my clients or family members might have positions in the stocks that we mention in our educational posts. We will not be responsible for any Profit or loss that may occur due to any financial decision taken based on any data provided in this message. Do consult your investment advisor before taking any financial decisions. Stop losses should be an important part of any investment in equity.

Nifty Analysis EOD - May 12, 2025 - Monday🟢 Nifty Analysis EOD - May 12, 2025 - Monday 🔴
🚀 Peace Talks & Policy Push – Bulls Break Chains, Nifty Soars to New Heights!
Opening Mood:
Relief from geopolitical tension and global trade optimism lit a fire under the bulls—marking one of the most powerful sessions in recent weeks.
🧭 Nifty Summary:
Following positive developments—ceasefire between India and Pakistan and trade policy easing between China and the US—Gift Nifty signaled a sharp gap-up.
Nifty opened at 24,420 (▲ 412 points | 1.72%), jumping above multiple resistance levels: 24,400~24,420 and 24,365~24,300. The first 5-minute candle alone posted a 184-point rally—and from there, bulls never looked back.
By breaching the 24,800 resistance and making a new swing high at 24,944.80, the day stamped bullish dominance. The close just 20 points below the high reflects strong buying interest and minimal profit booking.
🕯️ Daily Candle Breakdown:
Today’s Candle: Bullish Marubozu (full-bodied, tiny/no wicks) — high conviction buying
Close: 24,924.60 (Near day’s high)
Key Observations:
✅ Breakout above 24,800 resistance
✅ Closed above 22nd Oct 2024 candle high — a key Head & Shoulder confirmation level
✅ Strong volume and price confirmation
🔜 Watch for follow-through above 24,700–24,800 zone
What It Implies:
Clear strength from bulls with no hesitation. If follow-through sustains, we could be heading toward a fresh leg of upside—likely to test the psychological 25,000 mark and beyond.
⚔️ Gladiator Strategy Update
Strategy Parameters:
ATR: 355.76
IB Range: 358.95 → Extreme Large IB
Market Structure: ImBalanced
Trade Highlights:
Total Trades: 1
✅ Long Trigger @ 12:25 PM → Target 1:3.5 Achieved
📈 Intraday Walk (5-Min View):
Opened strong above multiple resistance zones
First candle: explosive 184-point rally
Smooth rally continued with no major retracement
A new swing high formed at 24,944.80
Day closed just shy of the high—strength intact
🔍 Support & Resistance Levels
🔼 Resistance Zones:
24,980 ~ 25,000
25,100 ~ 25,128
25,180 ~ 25,212
🔽 Support Zones:
24,882
24,800 ~ 24,768
24,730
24,660
24,590
24,530 ~ 24,480
📌 Final Thoughts:
"Markets love clarity. With news-driven fear subsiding, technicals are taking charge again. Follow momentum—but don't chase it blindly."
✏️ Disclaimer
This is just my personal viewpoint. Always consult your financial advisor before taking any action.

Weekly Market Wrap: Nifty Dips 340 Points Amid Global TensionsThis week, the Nifty 50 ended on a cautious note, closing at 24,008, down 340 points from the previous week's close. The index traded within a tight range, hitting a high of 24,526 and a low of 23,935—well within my anticipated levels of 24,900 to 23,800.
Silver Lining: Despite ongoing geopolitical tensions and negative news flow—including war-related developments—bulls managed to defend the critical psychological support of 24,000. That’s a sign of resilience in an otherwise shaky environment.
What’s Ahead?
For the upcoming week, expect high volatility. I see Nifty moving between 24,600 and 23,200. A weekly close below 23,800 could spell trouble for bulls, potentially opening the door for a drop toward major support zones at 23,200 and 23,000.
Technical Outlook:
Monthly & Daily Timeframes: Weak
Weekly Timeframe: Still bullish
So, while long-term charts show vulnerability, the weekly trend gives hope. I'm staying cautiously bullish—but will only turn aggressive once the monthly chart flips positive. Until then, it’s time to stay vigilant, not impulsive.
Global Cues: S&P 500 Holding Up Amid Uncertainty
The S&P 500 closed at 5,659, just 30 points down from the previous week, forming a doji candle—a clear sign of indecision. As long as the index holds above 5,532, there's no major cause for concern.
Bearish Trigger: Below 5,532, expect downside pressure toward 5,458 and 5,392, which could spill over into already fragile emerging markets like India.
Bullish Breakout: Above 5,770, bulls gain momentum, with potential upside targets of 5,821, 5,850, and 5,900. A rally here could bring relief to global equities, including Indian markets.

Nifty Analysis EOD - May 9, 2025 - Thursday🟢 Nifty Analysis EOD - May 9, 2025 - Thursday 🔴
🧨 Gap Down, Rebound & a Triangle Trap – Bulls Show Spine Amid Chaos
Opening Mood:
Overnight panic from geopolitical tensions shook the market’s foundation—but the bulls weren’t ready to surrender just yet.
🧭 Nifty Summary:
Gift Nifty had plunged to 23,760 late last night on news of escalating conflict—marking a 445-point fall. However, as the night wore on without further developments, markets began to stabilize. At the open, Nifty registered a gap-down of 338 points at 23,935, but the first 5-minute candle showed strength, racing to fill the gap.
After a brief attempt to break the Previous Day’s Low (PDL), Nifty failed to hold below and slid back to its origin. The rest of the day was a tug-of-war with sharp two-sided moves, eventually forming a descending triangle pattern—a sign of compression and directional indecision.
🕯️ Daily Candle Breakdown:
Today’s Candle: Wide-range doji with upper wick—signs of volatility and hesitation
Close: 24,008 (▲ Positive)
Key Observations:
✅ Above 24,000 Psychological Mark
✅ Held Support Zone: 24,000 ~ 23,950
✅ Above Recent Swing Low: 23,847.85
❌ Slightly Below Previous Week’s Low: 24,054.05
❌ Below Previous Swing Close: 24,036
What It Implies:
Buyers are stepping in at key supports, but conviction is still lacking. The market remains reactive to global cues, especially Mission Sindoor ones.
⚔️ Gladiator Strategy Update
Strategy Parameters:
ATR: 291.20
IB Range: 204.00 (Large IB)
Market Structure: ImBalanced
Trade Highlights:
Total Trades: 1
✅ Long Trigger @ 10:10 AM → Target 1:1.5 Achieved
📈 Intraday Walk (5-Min View):
Strong gap-fill in the first candle signaled bullish intent
Failed breakdown below PDL trapped weak shorts
Descending triangle emerged as price compressed
Market closed near resistance but above key support—neutral to slightly bullish tone
🔮 What’s Next?
This market is walking a tightrope between sentiment and structure. On one hand, technical levels are being respected—but on the other, global uncertainty is keeping participants hesitant.
“This is a news-driven market. Delivery trades are best avoided. Stay nimble, trade the levels, and protect capital. Remember, sometimes staying out is a profitable strategy.”
🔍 Support & Resistance Levels
🔼 Resistance Zones:
24,036 ~ 24,044
24,150 ~ 24,165
24,188 ~ 24,240
24,290
24,330 ~ 24,365
24,400 ~ 24,420
🔽 Support Zones:
24,000 ~ 23,950
23,935
23,890 ~ 23,870
23,848
23,820
23,710 ~ 23,660
📌 Final Thoughts:
“Structure is key. When levels work, respect them. When they break, adapt.”
In a market full of noise, discipline and level-based action is your edge.
✏️ Disclaimer
This is just my personal viewpoint. Always consult your financial advisor before taking any action.

So finally Nifty recedes a bit due to Indo-Pak tensions.Finally Nifty today receded a bit due to Indo-Pak tensions and war like situation/war between Indo-Pak. The support levels for Nifty now remains at 23924, 23809 important (Father line support of hourly chart), 23676 important mid channel support if this support is broken bears can drag Nifty further down to 23462, 23279, 22771 and finally 22579 which is the channel bottom support. If this level is broken there can be further free fall. Resistances on the upper side remain at 24111, 24247 (Mother Line resistance on the hourly chart), 24443, 24634 and 24892 (Channel top resistance). Situation remains fluid due to the Geo-Political situation no support can be very strong support as a lot can happen during the week end and no resistance can be a solid resistance if few things move in the anticipated direction.
Disclaimer:The above information is provided for educational purpose, analysis and paper trading only. Please don't treat this as a buy or sell recommendation for the stock or index. The Techno-Funda analysis is based on data that is more than 3 months old. Supports and Resistances are determined by historic past peaks and Valley in the chart. Many other indicators and patterns like EMA, RSI, MACD, Volumes, Fibonacci, parallel channel etc. use historic data. There is no guarantee they will work in future as markets are highly volatile and swings in prices are also due to macro and micro factors based on actions taken by the company as well as region and global events. Equity investment is subject to risks. I or my clients or family members might have positions in the stocks that we mention in our educational posts. We will not be responsible for any Profit or loss that may occur due to any financial decision taken based on any data provided in this message. Do consult your investment advisor before taking any financial decisions. Stop losses should be an important part of any investment in equity.

Surgical strike on Nifty call sellers at 24800-900Market Update: Nifty Outlook
Today, amid news of an Indian Army operation, Nifty opened with a significant gap down but swiftly recovered, showing strong upward momentum.
Currently, the chart structure indicates the need for a higher low to set the stage for the next leg of the uptrend towards the 24,800–24,900 zone. A flat opening in the next session could provide the ideal setup for a strong rally.
Notably, a sustained move above 24,500 could trigger a "surgical strike" on call sellers positioned at the 24,800–24,900 levels, potentially leading to sharp short-covering.
We recommend closely tracking price behavior near key support areas for confirmation of the next move.
Very Strong performance by Nifty to close in Positive todayDespite the fear of escalation of tensions at Indo-Pak border and Indian carrying out Operation Sindoor Nifty closed in Green today. This signifies the strength of Indian market, India as an Economy and India as a country. Very few would have imagined that Indian markets will close in Green today when the market begun early morning. The situation still remains fluid/dynamic and explosive. so still investors should keep stop losses and trailing stop losses in place.
Supports for Nifty remain at: 24315 (Strong Mother line for hourly chart), 24202, 24083, 23944 and 23754 (Strong Father Line support). Below 23754 Bears can take control of the market and drag it towards 23K.
Resistances For Nifty remain at: 24430, 24528, 24616 and 24863. Closing above 24863 can empower Bulls in a big way to Pull Index towards 25K+ levels.
Disclaimer: The above information is provided for educational purpose, analysis and paper trading only. Please don't treat this as a buy or sell recommendation for the stock or index. The Techno-Funda analysis is based on data that is more than 3 months old. Supports and Resistances are determined by historic past peaks and Valley in the chart. Many other indicators and patterns like EMA, RSI, MACD, Volumes, Fibonacci, parallel channel etc. use historic data which is 3 months or older cyclical points. There is no guarantee they will work in future as markets are highly volatile and swings in prices are also due to macro and micro factors based on actions taken by the company as well as region and global events. Equity investment is subject to risks. I or my clients or family members might have positions in the stocks that we mention in our educational posts. We will not be responsible for any Profit or loss that may occur due to any financial decision taken based on any data provided in this message. Do consult your investment advisor before taking any financial decisions. Stop losses should be an important part of any investment in equity.
Nifty Analysis EOD - May 6, 2025 - Tuesday🟢Nifty Analysis EOD - May 6, 2025 - Tuesday 🔴
📌 Opening Mood:
A deceptive start near resistance—buyers had a moment, but bears owned the day.
📊 Nifty Summary:
Nifty opened at 24,509, precisely at the psychological and structural resistance zone. The first candle itself (O=H) reflected immediate selling pressure, and the index slid quickly, dropping 140+ points in the first hour. It tested the support zone around 24,330 ~ 24,365, which had earlier acted as resistance—a polarity zone now holding as support.
Despite multiple attempts, Nifty couldn’t break back above the upper consolidation band (around 24,400–24,410). For most of the day, it traded in a tight 40–50 point range and eventually settled near the lower end of that range at 24,379.60, while intraday close came in at 24,331.80.
⏱ Intraday Walk (5-min Time Frame Highlights):
🔻 First hour: Quick 140-point drop straight into support
🔄 10:30 AM–2:50 PM: Multiple bounce-back attempts failed at 24,400 and 24350
🧊 3:00 PM–3:30 PM: High volatility zone, test both sides of the range and the day ends with a new low.
🔒 Close: Near day’s low—weak handoff for next session
🧭 Daily Candle Breakdown
📌 Today’s Candle Type: Strong Bearish Candle
📖 Know How of Candle Type:
This candle type signals strong seller dominance. The real body is wide with almost no upper wick, implying bears controlled the day from start to end. Appears frequently after a failed attempt to break resistance.
📌 Today’s OHLC:
Open: 24,500.75
High: 24,509.65
Low: 24,331.80
Close: 24,379.60
Change: –81.55 (–0.33%)
📐 Candle Structure:
🔹 Real Body: 121.15 points → Strong Red Body (Bearish Control)
🔹 Upper Wick: 8.90 points → No meaningful buying (Daily TF, Intraday No Wick)
🔹 Lower Wick: 47.80 points → Slight pullback, but bears still dominate(Daily TF)
📌 Interpretation:
Bears were in control from the opening tick
The candle sits near the bottom of the day’s range
Comes after a bullish candle at resistance → Potential short-term reversal signal
Watch for confirmation below 24,330 to trigger an extended downside
⚔️ Gladiator Strategy Update
📌 Strategy Parameters:
ATR: 290.90
IB Range: 129.85
IB Category: Medium IB
Market Structure: Balanced
📌 Trade Highlights:
🔹 Trade Count: 1
✅ Long Trigger @ 11:25 AM → Minor profit as Trade Time Exit Trigger
🔮 What’s Next?
🟥 Short bias: Only below 24,330 with conviction
🟩 Long bias: Only if the price crosses and sustains above 24,460 ~ 24,490
⚠️ Between these levels: Avoid directional bets. Look for scalping setups only.
🔍 Support & Resistance Levels
📌 Resistance Zones:
24,400 ~ 24,420 (Immediate hurdle)
24,480 ~ 24,530 (Key zone with 24,500 psychological level)
24,590
24760~24,800
📌 Support Zones:
24,365 ~ 24,330 (Immediate support)
24,290
24,245 ~ 24,240
24,188
24,050
24,000 ~ 23,950
23,820
23,710 ~ 23,660
🧠 Final Thoughts
"In tight ranges, patience is not just a virtue—it’s a strategy. Let the levels do the talking."
✏️ Disclaimer
This is just my personal viewpoint. Always consult your financial advisor before taking any action.

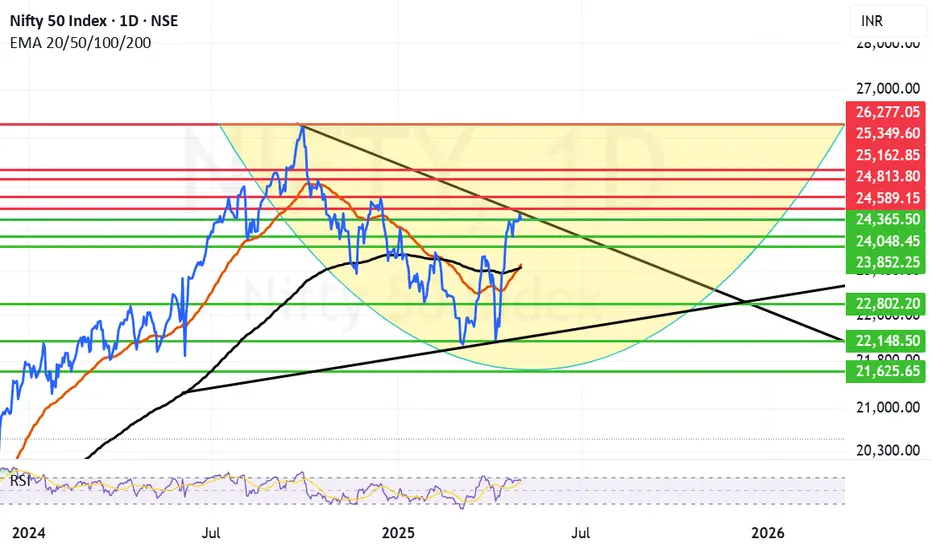
24589 proving to be a difficult resistance to conquerNifty once again tried to sustain the levels above 24500 but again faced resistance and pulled back. Amidst the drums of Ind-Pak war beating and ongoing tariff war the investors are afraid to take seriously long positions. Also we will have a US Fed rate decision coming up which is also adding to the investor anxiety. Mid and Small cap took the maximum brunt today due to all these factors. The Nifty resistance at 24589 is proving very difficult to be conquered with all the noise going around. Nifty resistance levels remain at 24509 and 24589 if we get a closing above 24589 Nifty can easily move for war 24813, and 25162. Supports for Nifty on the down side are at 24365, 24048, 23852 and the zone between 23515 (Mother line) and 23461 (Father line). If we get a closing below 23461, Nifty can again fall to the levels of 22802, 22148 or even 21625. (That is in adverse geo-political developments). A lot right now depends on Macro factors affecting the index and overall situation on Geo-Political front.
Disclaimer: The above information is provided for educational purpose, analysis and paper trading only. Please don't treat this as a buy or sell recommendation for the stock or index. The Techno-Funda analysis is based on data that is more than 3 months old. Supports and Resistances are determined by historic past peaks and Valley in the chart. Many other indicators and patterns like EMA, RSI, MACD, Volumes, Fibonacci, parallel channel etc. use historic data which is 3 months or older cyclical points. There is no guarantee they will work in future as markets are highly volatile and swings in prices are also due to macro and micro factors based on actions taken by the company as well as region and global events. Equity investment is subject to risks. I or my clients or family members might have positions in the stocks that we mention in our educational posts. We will not be responsible for any Profit or loss that may occur due to any financial decision taken based on any data provided in this message. Do consult your investment advisor before taking any financial decisions. Stop losses should be an important part of any investment in equity.
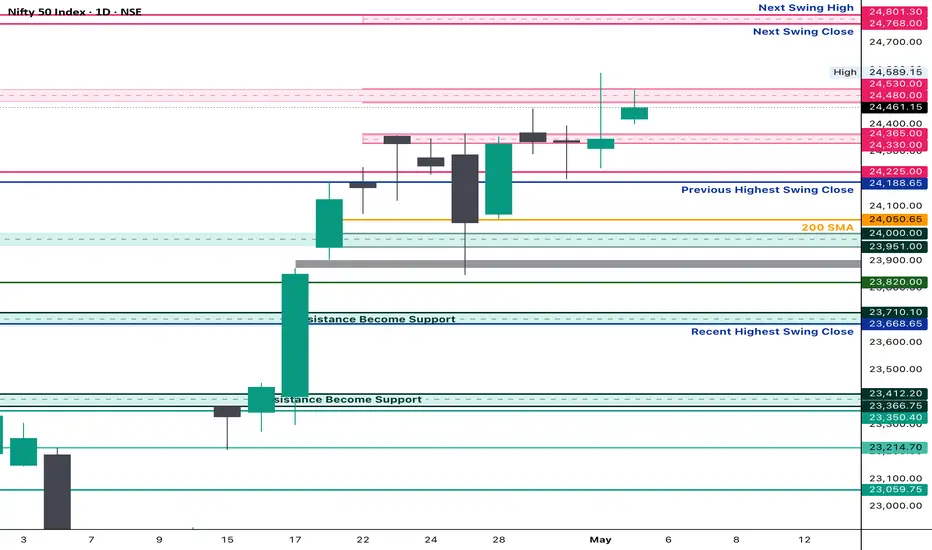
Nifty EOD Analysis – May 3, 2025 Monday🟢 Nifty EOD Analysis – May 3, 2025 Monday🔴
A positive open... but no follow-through. Still stuck in consolidation.
📊 Nifty Summary
Nifty opened with a gap up of 72 points at 24,420, marking the first open above 24,365 in the last 7 sessions — a positive sign. However, the enthusiasm lacked momentum. Price struggled to cross the resistance at 24,526, and the index drifted back toward the mean, trading the entire day between the initial balance (IB) range and hovering around VWAP.
🔹 Intraday Movement: Just 125 points, the smallest in the last 12 sessions — a clear sign of contraction.
🔹 Closing: 24461 closing is the first closing above 24365 in the last 7 sessions.
🔹 Structure: Daily candle formed an Inside Bar, signaling potential energy buildup.
📌 Strategy Forward: Stay alert for an expansion move from this coil — contraction often precedes sharp action.
📌 5 Min Time FrameChart
📌 Daily Time FrameChart
🕯️ Daily Time Frame Chart & Candle Breakdown
🔍 Today’s Candle Type: Spinning Top with a long upper wick
Candle Definition:
A Spinning Top reflects market indecision — both bulls and bears attempted moves, but neither gained dominance. A long upper wick with a narrow body often signals failed bullish momentum or fading enthusiasm.
📌 Today’s OHLC:
Open: 24,419.50
High: 24,526.40
Low: 24,400.65
Close: 24,461.15
Change: +114.45 (+0.47%)
🧱 Candle Structure:
🔹 Real Body:
🟢 Green candle with a modest body →
24,461.15 – 24,419.50 = 41.65 pts
🔹 Upper Wick:
24,526.40 – 24,461.15 = 65.25 pts
🔹 Lower Wick:
24,419.50 – 24,400.65 = 18.85 pts
📖 Candle’s Interpretation:
Despite a strong open and attempt to push higher, the resistance at 24,526 capped the move. The long upper wick shows that buyers lacked follow-through strength, and the close back near the middle of the range indicates a market still stuck in balance.
📉 The Inside Bar + Narrow Range combo is a potential signal for volatility ahead — traders should watch closely for a breakout from this range.
⚔️ Gladiator Strategy Update
📊 Strategy Parameters:
ATR: 303.46
IB Range: 110.65 pts
IB Category: Medium IB
Market Structure: Balanced
📌 Trade Highlights:
Trade Count: 0
❌ No Trigger generated by the system — a no-trade day.
🧠 Note: In contraction phases, it’s common to get fewer setups. Patience is key.
🔮 What’s Next?
Markets are coiling tightly, and an expansion move is likely around the corner. As long as price holds above the 24,330–24,360 band, bulls have hope — but conviction is needed above 24,540.
🧱 Support & Resistance Levels
🔺 Resistance Zones:
24,480 ~ 24,540 (Includes psychological level: 24,500)
24,590 (PDH – Immediate hurdle)
24,800
🔻 Support Zones:
24,400 (CDL)
24,330 ~ 24,360
24,190 ~ 24,225 (Immediate Support)
24,120
24,050
24,000 ~ 23,950
23,820
23,710 ~ 23,660
23,500
23,410 ~ 23,370
23,215
✏️ Disclaimer
This is just my personal viewpoint. Always consult your financial advisor before taking any action.

Weekly Market Wrap Nifty, Mid & Small Caps, and S&P 500 OutlookNifty ended the week on a strong bullish note, closing at 24,346, up by 307 points from the previous week. The index traded within a tight range, hitting a high of 24,589 and a low of 24,054, aligning perfectly with my projected range of 24,650–23,400.
📌 Key Technical Levels to Watch:
Nifty closed just below a crucial Fibonacci resistance at 24,414.
A daily close above 24,414 next week could open the door for a sharp move towards the next major resistance at 24,770.
While my system suggests a broader range of 24,900–23,800, I personally hope for a healthy consolidation to cool off some momentum—paving the way for a stronger, faster rally in the coming weeks.
Caution Zone:
A break below 23,800 might signal the return of bears, potentially dragging the index down to test critical support at 23,200/23,100.
Midcap & Smallcap Watch:
I’ve received a lot of queries about Midcap and Smallcap indices, and here’s the honest truth—they remain in a 'no-trade' zone. Despite Nifty's strength, the rally hasn’t lifted most Mid & Small Cap stocks.
👉 Investors holding quality, fundamentally strong stocks in these segments should stay calm, but avoid high PE or overvalued stocks until we get a clear monthly buy signal on the charts.
🌍 Global Markets – S&P 500 Analysis:
The S&P 500 closed the week at 5,686, just above the strong Fibonacci level of 5,637. Sustaining above this level could lead to a rally toward 5,770/5,821. However, a failure to hold this support might trigger a 2–3% pullback, which could ripple across global markets, including India.
📣 Bottom Line:
Nifty bulls need a close above 24,414 to push higher.
Mid & Small Cap space remains tricky—stay selective.
Watch global cues, especially from the US, for broader market direction.
Stay nimble, stay informed. ✅

Nifty EOD Analysis – May 2, 2025 - Friday🟢 Nifty EOD Analysis – May 2, 2025 (Friday)🔴
Another day... tug-of-war between buyers and sellers
📊 Nifty Summary
Another one-day tug-of-war between buyers and sellers. As usual, morning momentum — driven by buyers and short-covering — pushed the index into a bullish zone. However, profit booking and seller dominance dragged it back down, ultimately parking Nifty again in the 24,330 ~ 24,365 zone — now the 4th straight session closing within this narrow range.
Nifty opened on a bullish note at 24,311 and launched into a swift rally, breaching multiple resistance zones and clocking a new high at 24,589 within the first hour. However, the enthusiasm faded quickly. Sellers stepped in aggressively, and all the major support levels crumbled one by one. What started as a breakout turned into a breakdown.
The index drifted lower and spent the rest of the session stuck in a narrow zone of 24,330–24,365 — now for the fourth session in a row! The close at 24,346 reflects indecision and caution ahead of next week’s events.
📌 5 Min Time FrameChart
🕔 Intraday 5-Min Chart (Price Walkthrough)
🔹 Opened at 24,311 and rallied sharply to 24,589 — breaching multiple resistance zones.
🔹 Sellers took control and dragged the index back below 24,400.
🔹 Breakdown through all major support levels including PDH, CPR, and CDL.
🔹 Post-lunch session remained directionless between 24,330–24,365.
🔹 Fourth consecutive close inside this compression zone.
📌 75 Min Time FrameChart
⏱️ Intraday 75-Min Time Frame Chart
📐 First two candles formed a bullish setup, but the third candle completely reversed the gains, forming an Inside Bar breakdown trap. The remaining candles failed to break out of the previous range, with momentum fading.
⚠️ A breakout (or breakdown) from this compression is now imminent — keep your eyes on the next session for direction.
📌 Daily Time FrameChart
🕯️ Daily Time Frame Chart & Candle Breakdown
📈 Today’s Candle Type: Spinning Top with long upper wick
🟢 Open: 24,311.90
🔺 High: 24,589.15
🔻 Low: 24,238.50
🔚 Close: 24,346.70
📊 Change: +12.50 (+0.05%)
🧠 Know Your Candle:
A Spinning Top reflects market indecision — the long wicks show strong attempts by both bulls and bears, but neither managed to dominate.
Upper Shadow: 242.45 pts → Strong selling from highs
Lower Shadow: 73.40 pts → Mild buying near lows
Real Body: 34.80 pts → Modest positive close
🔍 Interpretation:
Despite an early morning breakout, the close back in the congestion zone signals a lack of directional strength. The long upper wick reflects failure to hold higher ground — bias slightly tilting bearish unless this zone is broken with conviction.
⚔️ Gladiator Strategy Update
📌 Strategy Parameters:
ATR: 317.21
IB Range: 270.30
IB Category: Medium IB
Market Structure: Balanced
📊 Trade Summary:
✅ 1st Trade (Long): Triggered at 9:25 – Target Achieved (1:2 RR)
❌ 2nd Trade (Short): Triggered at 12:25 – SL Hit
🔮 What’s Next?
The bias remains neutral to slightly bearish. Despite a strong upside in the first hour, the repeated failure to sustain above 24,400 and four closes within 24,330–24,365 suggest exhaustion.
A breakout from this tight coil should give a clear move — wait for confirmation.
📌 Support & Resistance Levels
🔺 Resistance:
24,330 ~ 24,360 (Immediate hurdle)
24,400 (PDH)
24,457
24,480 ~ 24,540
24,589 (CDH)
24760 ~ 24,800
🔻 Support:
24,190 ~ 24,225
24,120
24,050
24,000 ~ 23,950
23,820
23,710 ~ 23,660
23,500
23,410 ~ 23,370
23,215
💬 Final Thoughts
“Range traps continue to fool both sides — momentum without conviction is just noise.”
Watch the compression zone — a genuine breakout or closing above 24,365 or breakdown below 24,225 could bring clarity. Until then, trade light and watch levels.
✏️ Disclaimer
This is just my personal viewpoint. Always consult your financial advisor before taking any action.

Nifty eyeing Trendline breakout amidst uncertainty. Amidst uncertainty on Geo-Political front Nifty gave up 242 points it had gained earlier in the day. Also it bounced 108 points from the day's low to close 12 points in positive at 24346.7 in a highly volatile Friday.
Reliance remains start of the week after posting stellar results earlier in the week. The Trendline resistance zone between 24365 and 24589 remains difficult to conquer for Nifty. Once we get a closing above 24589 can the bulls try to pull Nifty further up towards 24910 and 25K+ levels.
Incase the trend line resistance is not crossed successfully the support for Nifty remains at 24048, 23852 and 23343. As of now it looks that the level of 23343 which is the Mother line of Weekly candle chart (strong Support) can be breached only if there is flare up of incidents on the Border or elsewhere.
The situation at Indo-Pak Border remains delicate and tense that might be one reason why investors did not carry long positions into the weekend and Nifty lost most of it's gains.
Right now a lot depends on what happens between the 2 nations and surrounding region. Investment in large cap companies remains the safest option looking at the uncertainty. Even in the case of flare-up at the border these companies will be the first to bounce back after situation normalises.
Disclaimer: The above information is provided for educational purpose, analysis and paper trading only. Please don't treat this as a buy or sell recommendation for the stock or index. The Techno-Funda analysis is based on data that is more than 3 months old. Supports and Resistances are determined by historic past peaks and Valley in the chart. Many other indicators and patterns like EMA, RSI, MACD, Volumes, Fibonacci, parallel channel etc. use historic data which is 3 months or older cyclical points. There is no guarantee they will work in future as markets are highly volatile and swings in prices are also due to macro and micro factors based on actions taken by the company as well as region and global events. Equity investment is subject to risks. I or my clients or family members might have positions in the stocks that we mention in our educational posts. We will not be responsible for any Profit or loss that may occur due to any financial decision taken based on any data provided in this message. Do consult your investment advisor before taking any financial decisions. Stop losses should be an important part of any investment in equity.
NIFTY Index View - May 02, 2025The index has been moving sideways since last few days this week but has moved upwards with fine volume as we had analyzed on Tuesday (April 29th).
The index still looks strong enough to continue the trend further upwards.

Nifty Analysis EOD - April 30, 2025 - Wednesday🟢 Nifty Analysis EOD - April 30, 2025 - Wednesday 🔴
🗓️ One more expiry day ended in suspense, surprise and a last-minute spike!
📊 Nifty Summary
Nifty opened slightly green at 24,342, just 6 points above the previous close. A quick dip below the previous day’s low was swiftly recovered, triggering a rally towards 24,400. However, most of the session turned into a slow grind between a narrow 40-point range as both bulls and bears hesitated.
As is typical on expiry days, a sudden burst in the last 5 minutes added 198 points to the move — a nightmare for option sellers but a jackpot for Hero-Zero traders. The day’s true intraday close stood at 24,243, while settlement was at 24,334, reflecting a wide 90-point gap traders must factor in.
🕔 Intraday 5 Min Time Frame Chart
🔁 Intraday Walk
🔹 Opened at 24,342 with a quick drop below PDL, then rebounded.
🔹 Rallied to 24,400 within the first 30 minutes.
🔹 Ranged for hours between 24,330–24,370 with no clear breakout.
🔹 A 198-point spike in the final 30 minutes caught most off-guard.
🔹 True intraday close = 24,243 vs. settlement = 24,334 → Huge difference!
⏱ Intraday 75 Min Time Frame Chart
📐 75-Min Chart Analysis / Zone Commentary
The last 3 sessions showed repeated failed attempts to close above 24,365 (the previous week's high). A symmetrical triangle was clearly visible and delivered a classic trap: a false breakout, a liquidity grab, and an immediate pullback to meet the pattern’s target. Unfortunately, the real breakout happened around 2:35 PM — just after most had packed up for expiry!
📅 Daily Time Frame Chart
🕯️ Daily Candle Breakdown
Today’s Candle Type: Spinning Top (Bearish Tilt)
Today’s OHLC:
Open: 24,342.05
High: 24,396.15
Low: 24,198.75
Close: 24,334.20
Change: –1.75 (–0.01%)
Know How of Candle Type:A Spinning Top reflects indecision — a small body with long shadows shows a battle between buyers and sellers with no clear winner.
Key Observation:
Real Body = 7.85 points → Minimal net movement
Upper Wick = 54.10 pts
Lower Wick = 143.30 pts → Stronger buyer defense but weak follow-through
What It Implies:Buyers showed strength at lower levels but couldn't close strong. Despite the strong lower wick, the red close tilts sentiment mildly bearish. The breach of previous day’s low confirms weakness unless reversed tomorrow.
⚔️ Gladiator Strategy Update
Strategy Parameters:
ATR: 313.49
IB Range: 126.40
IB Category: Medium IB
Market Structure: Balanced
Trade Highlights:
📉 No Trade Triggered
Gladiator system remained silent today amidst the choppy expiry behavior.
🔮 What’s Next? / Bias Direction
Although the larger bias had been mildly bullish, the breach of the 24,290 low shifts the short-term view to slightly bearish. However, one more session confirmation is needed before taking any aggressive stance.
📌 Support & Resistance Levels
🔺 Resistance Zones:
24,290 (PDL)
24,330 ~ 24,360 (Immediate hurdle)
24,396 (CDH)
24,457 (PDH)
24,480 ~ 24,540 (Incl. 24,500 psych level)
24,800
🔻 Support Zones:
24,190 ~ 24,225
24,120
24,050
24,000 ~ 23,950
23,820
23,710 ~ 23,660
23,500
23,410 ~ 23,370
23,215
💬 Final Thoughts
“Expiry days are for the patient and the prepared. Today was a perfect example of how calm waters can suddenly become tidal waves.”The pattern, structure, and volatility continue to show that structure is key — respect it when it holds, and adapt when it breaks.
✏️ Disclaimer ✏️
This is just my personal viewpoint. Always consult your financial advisor before taking any action.

Nifty trying to break trendline resistance. As depicted yesterday we are near the trendline resistance. These trendline resistance like Mother and Father resistances are not easy to break but once broken they become a massive support zone. Nifty as we saw today is trying to break this trendline resistance which is there near 24359. Once this resistance will be crossed and we get a closing above the same we can see Nifty move swiftly towards 24538 and 24816. After closing above 24816 Nifty can move towards capturing 25K level back. Supports for Nifty remain at 23980 and 23708. Below 23708 we have the Mother and Father line support near 23365 and 23424. To know more about Mother Father and Small Child theory. To learn it to master it. Read my book. The Happy Candles Way To Wealth Creation available on Amazon in Paperback and Kindle version.
Disclaimer: The above information is provided for educational purpose, analysis and paper trading only. Please don't treat this as a buy or sell recommendation for the stock or index. The Techno-Funda analysis is based on data that is more than 3 months old. Supports and Resistances are determined by historic past peaks and Valley in the chart. Many other indicators and patterns like EMA, RSI, MACD, Volumes, Fibonacci, parallel channel etc. use historic data which is 3 months or older cyclical points. There is no guarantee they will work in future as markets are highly volatile and swings in prices are also due to macro and micro factors based on actions taken by the company as well as region and global events. Equity investment is subject to risks. I or my clients or family members might have positions in the stocks that we mention in our educational posts. We will not be responsible for any Profit or loss that may occur due to any financial decision taken based on any data provided in this message. Do consult your investment advisor before taking any financial decisions. Stop losses should be an important part of any investment in equity.

Nifty Analysis EOD - April 29, 2025🟢 Nifty Analysis EOD - April 29, 2025🔴
One more day passed under uncertainty... Indecision takes the driver’s seat.
📈 Market Summary
Nifty opened on a positive note at 24,370, gaining 42 points, and swiftly climbed to an intraday high of 24,457.65. But the enthusiasm didn’t last long — sellers stepped in and pushed it down, filling the opening gap. The index found support near 24,290, and attempted a bounce, but once again failed to clear the critical 24,330–24,360 resistance zone.
📌 Intraday 5 Min Time FrameChart
The rest of the session saw price action trapped within a narrow 70-point range — a frustrating day for breakout traders or option buyers.
🔹 Impatient option buyers may have been trapped, stuck in hopes of a breakout.
🔹 Patient traders probably stayed away.
🔹 Scalpers and option sellers — this was your playground today.
📌 75 Min Time FrameChart
On the 75-minute chart, once again, rejection is clearly visible from the 24,330 ~ 24,360 zone. Until we see a decisive close above 24,365, this zone will continue to command respect in our trade plans.
📌 Daily Time Frame Chart
🕯 Daily Candle Structure
Candle Type: Spinning Top — a classic indecision candle
OHLC:
Open: 24,370.70
High: 24,457.65
Low: 24,290.75
Close: 24,335.95
Change: +7.45 points (+0.03%)
🔍 Candle Breakdown:
Real Body:
Small red body of -34.75 pts (close < open) → Indicates lack of strong directional move.
Upper Wick: 86.95 pts
Lower Wick: 79.95 pts
This candlestick reflects market hesitation, especially significant after a strong uptrend. Bulls and bears fought for control, but neither side won convincingly.
🧠 What the Spinning Top Tells Us:
Appears after a strong move → Suggests loss of momentum or possible pause
Small body + long wicks = Indecision
Needs confirmation in the next session
🔮 What Next?
Today’s spinning top doesn’t give a clear directional cue. However, context matters:
A close above CPR and previous session tilts the bias slightly bullish.
Bullish scenario: A breakout above 24,460 may resume the upward trend.
Bearish scenario: A breakdown below 24,040 could open the door for a pullback.
As always — trade with preparation, not prediction.
⚔️ Gladiator Strategy Update
ATR: 326.39
IB Range: 166.9 (Medium IB)
Market Structure: Imbalanced
Trade Highlights:
Positional Trade: Long Triggered Yesterday 15:20 – 1:2 Target Achieved
Intraday: No trade triggered during the session
📈 Index Performance Snapshot
Nifty 50: +7 Points (+0.03%)
Bank Nifty: -42 Points (-0.07%)
Nifty 500: +11 Points (+0.05%)
Midcap: +148 Points (+0.27%)
Smallcap: +62 Points (+0.37%)
🔍 Key Levels to Watch
🛑 Resistance Zones:
24,330 ~ 24,360 (Immediate hurdle)
24,457 (Today’s High)
24,480 ~ 24,540 (24,500 psychological level inside this zone)
24,800
🛡 Support Zones:
24,290 (Today’s Low)
24,190 ~ 24,225 (Immediate support)
24,120
24,050
24,000 ~ 23,950
23,820
23,710 ~ 23,660
23,500
23,410 ~ 23,370
23,215
💭 Final Thoughts
Another day where the market teased both bulls and bears alike. But remember — uncertainty is not your enemy; it’s your signal to slow down. When the candle speaks in spinning tops, the trader listens in silence. Discipline and patience are still your best tools, especially when the market isn't shouting direction clearly.
Tomorrow is the Weekly expiry — so prepare for volatility and don’t let noise disrupt your clarity. Your trade setup is your edge — trust it.
✏️ Disclaimer:
This is just my personal viewpoint. Always consult your financial advisor before taking any action.

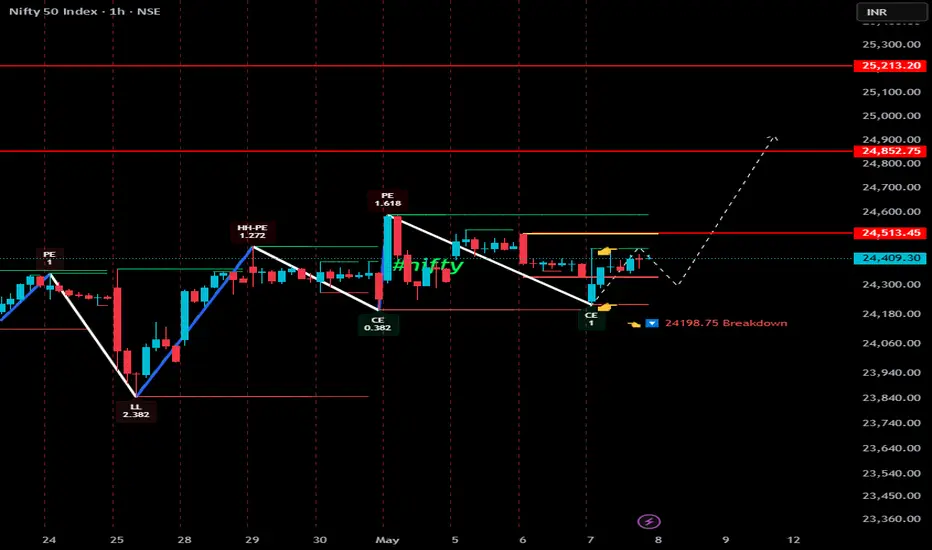
NIFTY: Impulse formationNifty is rising in an impulsive manner of which 4th wave is already concluded at 23847 zone and currently trading under wave-5. This shall take the index towards 24875 zone where wave-5 becomes equal to wave-1.

Nifty Elliott wave update for 29april Tuesday onwardsIn this Video I have explained Elliott wave analysis of Nifty on 3hour, 15 min chart and 5min chart in detail to conclude what are the possible scenarios possible in Nifty index from 29april Tuesday onwards.... Kindly watch full video for detail understanding. It will help you to understand how to use Elliott wave theory practically on charts.
Thank you for watching....

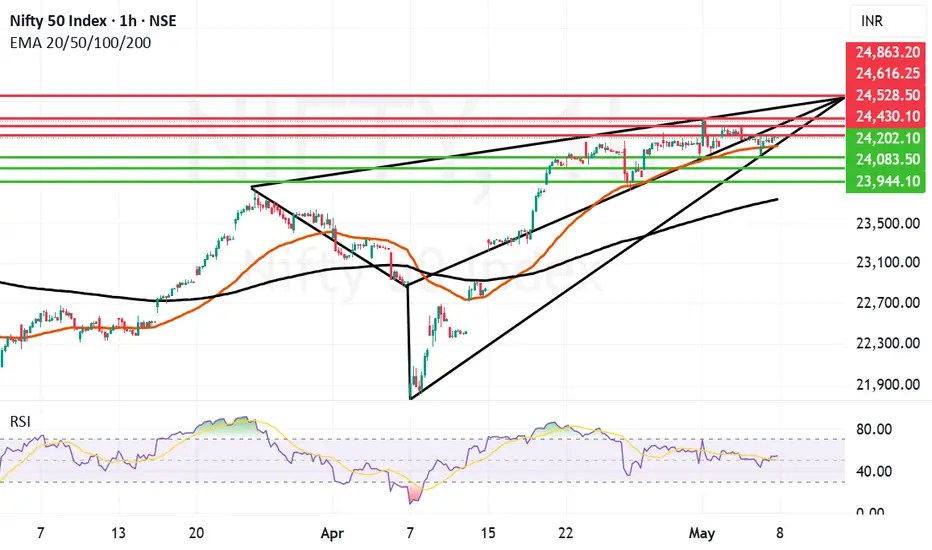
Nifty on the verge of Trendline Breakout. There is a major possibility of a Trendline Breakout amidst the rumblings on conflict with enemy nations. The main reason for Market rally today was Superb results posted by Reliance and a rally in PSU, Capital goods and defense related stocks. A lot of stocks that were oversold in the knee-jerk reaction on Friday also tried to catch-up. As the situation on the border remains tense we can have a sudden major decline as a reaction to the Geo-Political proceedings. Thus investors are asked to remains cautious and not to carry heavy derivative positions overnight. Even in the eventuality of a war actually happening one think of remaining invested in companies that can bounce back faster once the situation de-escalates.
Major Supports for Nifty on daily chart now remain at: 23988, 23708, 23415 (Major Father line support), 23325 (Major Mother Line Support) in case of Mother and Father line failing Bears can drag Nifty further down to 22875, 22142 and 21844.
Major Resistances For Nifty remain at: 24359 (Major Trend line resistance), 24538, 24816 (Is another major resistance on Fibonacci scale), If we get a closing above 24816 Nifty can easily flow towards 25183, 25399 and 25603.
Disclaimer: The above information is provided for educational purpose, analysis and paper trading only. Please don't treat this as a buy or sell recommendation for the stock or index. The Techno-Funda analysis is based on data that is more than 3 months old. Supports and Resistances are determined by historic past peaks and Valley in the chart. Many other indicators and patterns like EMA, RSI, MACD, Volumes, Fibonacci, parallel channel etc. use historic data which is 3 months or older cyclical points. There is no guarantee they will work in future as markets are highly volatile and swings in prices are also due to macro and micro factors based on actions taken by the company as well as region and global events. Equity investment is subject to risks. I or my clients or family members might have positions in the stocks that we mention in our educational posts. We will not be responsible for any Profit or loss that may occur due to any financial decision taken based on any data provided in this message. Do consult your investment advisor before taking any financial decisions. Stop losses should be an important part of any investment in equity.
