Nifty Analysis EOD - April 25, 2025🟢 Nifty Analysis EOD - April 25, 2025 🔴
"Inside Bar Alert — Calm Before the Storm"… And Then the Storm Hit!
📊 Market Recap: A Walk? No. A Sprint Downhill!
As we noted in yesterday’s report, the Inside Bar setup was hinting at a possible breakout—today, it delivered that breakout with thunder and lightning. And if you blinked, you probably missed it.
Nifty opened at 24,289, looked like it might test bullish waters by attempting PDH twice within the first 15 minutes, but the sellers were just getting warmed up. What followed was a merciless 400-point drop in just 30 minutes, slicing through level after level like a knife through butter.
Zone after zone fell like dominoes:
CDO
CPR Zone
PDH
S1, S2, S3, S4
24,225, 24,188
200 SMA at 24,052
24,000 ~ 23,951 Zone
Virgin Zone 23,905 ~ 23,872
Absolutely brutal sell-off. No mercy. No pause. Just raw momentum to the downside.
🕯️ Daily Candle Structure: Long-Legged Bearish
Today’s daily candle adds a strong bearish tone to the chart:
Open: Flat to Mild Gap-Up
High: 24,365.45
Low: 23,847.85
Close: Deep in red
Despite a small attempt at recovery near the lows, buyers couldn’t even regain the opening level. What’s left is a long-legged bearish candle, indicating volatility, intraday recovery attempt, and bear dominance.
📌 This type of candle often signals distribution or exhaustion, especially when it appears after a long rally. If the next session continues the bearish move, this might be the start of a short-term correction. If we get a bullish bounce, then today’s low may act as a temporary support.
🔍 Recalling the Setup:
We previously observed a Hanging Man on April 23, signaling a possible reversal. Then, the Inside Bar formed on April 24—a classic setup for a breakout.
✔️ Our expectation: 1x Mother Bar Range as a move
✔️ Bias: Slightly Bearish due to the Hanging Man and overall overextended rally
❌ Expectation: Didn’t expect this much bloodshed this fast!
📌 Gladiator Strategy Update
ATR: 347.27
IB Range: 405.4 (Extra Large IB)
Market Structure: Balanced
🎯 Trade Highlights:
No System Trade: Setup didn’t align with risk management rules
Additional Trade (Discretionary Contra):
Long Entry Triggered at 12:35 PM
✅ Target Achieved: 1:3.7 Risk-Reward
📉 Index Performance Snapshot:
Nifty 50: -207 Points (-0.86%)
Bank Nifty: -537 Points (-0.97%)
Nifty 500: -332 Points (-1.5%)
Midcap: -1399 Points (-2.5%)
Smallcap: -416 Points (-2.45%)
Midcaps and smallcaps took the biggest hit, showing broad-based weakness across the market.
📌 Key Levels to Watch
📍 Resistance Zones:
24,050
24,120
24,190 ~ 24,225
24,330 ~ 24,360
24,480 ~ 24,540
24,800
📍 Support Zones:
24,000 ~ 23,950 (Immediate)
23,820
23,710 ~ 23,660
23,500
23,410 ~ 23,370
23,215
🧭 Final Thoughts:
"The storm doesn't announce itself with thunder—it begins with silence. Yesterday was silent. Today was the thunder."
The Inside Bar setup has played out, but now eyes are on whether we get follow-through selling or a relief bounce. The next session’s first 30–45 mins might give a clue.
✏️ Disclaimer ✏️
This is just my personal viewpoint. Always consult your financial advisor before taking any action.
Niftyoutlook

#NIFTY Intraday Support and Resistance Levels - 25/04/2025Gap up opening expected in nifty. Expected opening near 24500 level. After opening if nifty starts trading above 24550 level then possible strong upside rally towards the 24750+ level in opening session. Downside 24300 level will act as a strong support for today's session. Any major downside only expected below 24200 level.

Nifty Spot Daily Trend Analysis from April 25, 2025Technical Outlook:
Nifty Spot is approaching a potential resistance near the Gann 720° level at 24,539. A minor correction appears likely, and we are currently awaiting short signal confirmation from one of our proprietary indicators. Should a decline occur, the index may find support around the Sine Wave level of 23,398. A break below this level could suggest a continuation of the bearish momentum.
At present, most indicators are still trending upwards. However, the bar formations on the chart hint at a possible reversal. Once the MastersSignal confirms a short setup, we will reassess confluence around the Gann 720° value to strengthen conviction.
Disclaimer: This is my personal technical view. Traders should conduct their own analysis and implement strict risk management before initiating any trades.

Nifty Analysis EOD - April 24, 2025🟢 Nifty Analysis EOD - April 24, 2025 🔴
Inside Bar Alert—Calm Before the Storm?
📊 Market Recap:
Nifty opened at 24,284, marking a Gap Down of 51 points (-0.21%) from the previous close. The day began on a surprisingly calm note, but that didn’t last long. Within just 15 minutes, Nifty spiked over 100 points, rushing toward PDH (Previous Day’s High)—only to reverse sharply in the next 15 minutes and create a new intraday low.
📉 This wild back-and-forth action in the first hour was nothing short of a nightmare for intraday traders—especially those trying to catch a trend early. If anything, scalpers might’ve had the best time, capitalizing on the swift movements in both directions.
For the remainder of the session, Nifty oscillated within the CPR zone, with a few false breakout candles that quickly retraced. The structure remained range-bound, indecisive, and tricky to navigate.
📅 Expiry Day Check: Deja Vu, Minus the Volatility
If we set aside the unusually directional move of April 17th expiry, today looked like a textbook expiry day, much like the past 10 before it:
Movement hugging VWAP
Small false breakouts on either side
No follow-through
Today’s range: 132 points
Avg range of last 10 expiries: 192 points
This time, however, the volatility was muted, despite early session fireworks.
🕯 Daily Candle Structure: Inside Bar + Shooting Star
On the Daily chart, today’s price action has formed a bearish Shooting Star–like candle, but here’s the kicker—it’s also an Inside Bar setup.
📌 What’s an Inside Bar?
An Inside Bar pattern occurs when today’s high and low are completely within yesterday’s range (the “mother bar”). This signals consolidation or indecision, and often precedes a strong breakout.
📖 How to trade it?
Wait for a decisive breakout above the mother bar high or below the mother bar low. Add confirmation with volume surge to gauge the strength of the breakout.
👉 Remember: The Inside Bar doesn’t predict direction—it just tells you a move is brewing.
📌 Gladiator Strategy Update
ATR: 328.34
IB Range: 108.40 (Small IB)
Market Structure: Balanced
🎯 Trade Highlights:
No Trade Opportunity Presented — The structure didn’t offer any valid setups within strategy rules.
🧠 Index Performance Snapshot:
Nifty 50: -82 Points (-0.34%)
Bank Nifty: -168.65 Points (-0.30%)
Nifty 500: -57 Points (-0.26%)
Midcap: -71 Points (-0.13%)
Smallcap: -6 Points (-0.04%)
📌 Key Levels to Watch
📍 Resistance Zones:
24,330 ~ 24,360
24,480 ~ 24,540
24,800
📍 Support Zones:
24,190 ~ 24,225
23,950 ~ 24,000 (Immediate)
23,820
23,660 ~ 23,710
23,500
23,400 ~ 23,430
23,200 ~ 23,190
🧭 Final Thoughts:
"Inside Bars are like market whispers—subtle, quiet, but worth listening to. The next breakout might just surprise you."
✏️ Disclaimer ✏️
This is just my personal viewpoint. Always consult your financial advisor before taking any action.

Nifty--Demand Zone and Liquidity @23400 Nifty index is broken the strong resistance at 23800 levels and taken the liquidity at 24220 levels...
now price action is sideways or trading in a range bound market.
expecting some pullback for further continuation....
wait for buyers exhaustion before short...
we have a clear demand zone at 23400 levels...
when price confirms the bullishness here, after the liquidity grab below the demand will observe a strong up move again...
there are bullish gaps @22800 levels...price has to give pullback for further upside move...
the above one is a clear buying plan for the targets of 24800 and 25200 liquidity.
--->>still we have no sign of bearishness is seen in Nifty.

Nifty Analysis EOD - April 23, 2025🟢 Nifty Analysis EOD - April 23, 2025 🔴
"Hanging Man Candle on Bullish Trend—Pause or Plot Twist?"
📊 Market Recap:
As anticipated from the ongoing bullish structure, Nifty opened with a strong Gap-Up at 24,357, adding +192 Points (+0.79%) to the charts. However, what looked like a continuation day quickly turned cautious. The initial candle marked the day’s high (Open = High scenario, nearly exact) and started a gap-filling move, pushing prices back to CPR.
The market respected CPR as a support, then moved back towards its mean (VWAP) where the PDH + R1 zone resisted price action effectively until 1 PM. Post that, Nifty finally broke out, sustained above the zone, and closed at 24,300—still holding gains despite a red candle, which visually seems bearish but technically closes above VWAP + PDH. Hence, a hidden bullish undertone remains.
🕯 Daily Candle Check: Is It a Hanging Man?
A textbook Hanging Man candle appears to have formed on the Daily Chart—a bearish reversal pattern that shows potential weakness at the top of a rally.
📌 Candle Stats:
Body: 28 points
Lower Shadow: 209 points
Upper Shadow: 2 points
Shadow-to-body ratio: 209 / 28 = 7.4x
✅ Trend Context: Yes, uptrend present
✅ Candle Structure: Meets all parameters
👉 Verdict: Confirmed Hanging Man Candle
This hints that selling pressure is gradually creeping in while buying strength might be exhausting. But a Hanging Man alone isn't a trade trigger—confirmation is key. So we watch tomorrow’s session to decide whether it’s just a pause or a trend shift.
📈 Intraday Insight: Head & Shoulders Pattern
During the session’s consolidation and bounceback phase, a Head & Shoulders pattern played out intraday with its target being 24,300—achieved successfully by EOD.
🔍 Pattern Recap:
This bullish reversal structure shows three dips, with the central one (head) being the deepest and two shallower ones (shoulders). A break above the “neckline” confirmed bullishness—supporting the rebound above VWAP.
📌 Gladiator Strategy Update
ATR: 350.19
IB Range: 94.75 (Small IB)
Market Structure: Imbalanced
🎯 Trade Highlights:
First Trade: Short – Triggered at 10:05 AM — ✅ 1:1.5 Target Achieved
Second Trade: Long – Triggered at 13:40 PM — ✅ 1:1.5 Target Achieved
Additional Trade (H&S Pattern): Long – Triggered at 11:40 AM — ✅ Pattern Target Achieved
🧠 Index Performance Snapshot:
Nifty 50: +161 Points (+0.67%)
Bank Nifty: -277 Points (-0.5%), but a new ATH at 56,098
Nifty 500: +152 Points (+0.69%)
Midcap: +644 Points (+1.18%)
Smallcap: +74 Points (+0.44%)
📌 Key Levels to Watch
📍 Resistance Zones:
24,330 ~ 24,360
24,480 ~ 24,540
24,800
📍 Support Zones:
24,190 ~ 24,225
23,950 ~ 24,000 (Immediate)
23,820
23,660 ~ 23,710
23,500
23,400 ~ 23,430
23,200 ~ 23,190
🧭 Final Thoughts:
"Reversal or Reset? Structure is key. When levels work, respect them. When they break, adapt."
✏️ Disclaimer ✏️
This is just my personal viewpoint. Always consult your financial advisor before taking any action.

Nifty Analysis EOD - 22nd April 2025🟢 Nifty Analysis EOD - 22nd April 2025 🔴
🧠 Market Background:
As highlighted in the previous session analysis, we were expecting a range-bound or narrow-range trading day — and that’s exactly what played out.
Nifty opened at 24,185, right below the resistance zone where yesterday’s session had consolidated heavily. Early in the session, price fell below the Previous Day Close (PDC) and took support exactly at the Central Pivot Range (CPR) before staging a sharp move up — breaking both Current Day High (CDH) and Previous Day High (PDH).
However, the 24,225 resistance zone acted as a speed breaker, pushing prices back down toward VWAP, which then provided a solid support base. Until around 2:45 PM, Nifty kept forming higher lows, giving hopes for continuation — but then broke the previous swing low, forming a new lower low into the close.
📊 Price Action Insight:
Day closed above the CPR zone, which still favors the bullish structure
However, on the daily timeframe, a near-perfect Doji candle has formed, with just a 9-point body, indicating indecision or a pause in the trend
The intraday range was 170 points, noticeably lower than Nifty’s average range, hinting at contraction
In such a case, trading the Doji becomes simple — wait for either high or low to break, but also consider nearby support/resistance confluence for better edge
🎯 Strategic Outlook:
A retracement towards 23,660–23,710 or even 23,200 can’t be ruled out — although it's early to confirm
Broader sentiment stays bullish, but this Doji suggests a pause or potential reversal — so caution near upper zones is advised
Keep tracking key global cues and sector rotation — especially with Midcaps and Smallcaps showing strong resilience
📌 Gladiator Strategy Update
ATR: 362.5
IB Range: 129.65 (Medium IB)
Market Structure: Balanced
Long Trade Triggered at 10:30 AM — ✅ 1:1.5 Target Achieved
Second Long Entry at 11:40 AM — ❌ SL Hit
📈 Index Performance
Nifty: +42 Points (+0.17%)
Bank Nifty: 🔼 New All-Time High at 55,961, closing at 55,647 (+342 pts / +0.6%)
Nifty 500: +79 Points (+0.36%)
Midcap: +422 Points (+0.78%)
Smallcap: +122 Points (+0.73%)
📌 Key Levels to Watch
🔺 Resistance Zones
• 24,190 ~ 24,225
• 24,330 ~ 24,360
• 24,480 ~ 24,540
🔻 Support Zones
• 23,950 ~ 24,000 (Immediate support)
• 23,820
• 23,660 ~ 23,710
• 23,500
• 23,400 ~ 23,430
• 23,200 ~ 23,190
🧘♂️ Final Thoughts
"Structure is key. When levels work, respect them. When they break, adapt."
Stay level-headed, stay prepared. Let the market show you the way.
✏️ Disclaimer ✏️
This is just my personal viewpoint. Always consult your financial advisor before taking any action.

Decoding NIFTYDear Traders,
I hope this message finds you well in your trading endeavours and personal pursuits. I am excited to share a compelling opportunity with you through a new NIFTY analysis that sheds light on the continuation of the market shift.
Preliminary Analysis Overview:
The downtrend from all-time highs has reached approximately 65% of its progression.
The recent upward surge is somewhat concerning due to concerns about a new trend or a correction within a correction in a larger degree (downtrend).
Let us discuss the key points to distinguish between these two scenarios:
The second leg of the downtrend is experiencing a correction, having completed approximately 89/90 days (which reinforces the interim trend’s completion).
The current correction is progressing rapidly, exhibiting limited sub-waves, which is typically not a characteristic of a motive wave (especially at the beginning of a trend).
The accompanying chart illustrates this point.
Let us elucidate the reasons behind this assertion:
Reason I:
As a staunch believer and ardent follower of Master WDG , the significance of time cannot be disregarded.
The primary downtrend commenced on September 27, 2024, and is poised to encounter a pivotal juncture, namely 180 days from its commencement on March 25, 2025 (Tuesday). This date also coincides with a cross-over with the Fibonacci value of 21 from March 4, 2025, where the interim correction commenced (21,964.60).
The 180D is a component of both the tetragram and the hexagram, and it also represents the midway point of a complete circle (360).
There is also another weird correlation, 4th MAR’25 & 25th MAR’25 both falls on Tuesday marking initiation & termination, the same day.
Reason II:
The geometric patterns of preceding and ongoing movements further support this analysis.
Analyzed both on a daily and weekly basis. The correction responded favorably to both Fibonacci retracements and trendlines. Upcoming resistance levels include:
RI: 23,590~23,600
RII:23,653 (23.6% of the downtrend)
RIII: 23,807
The previous support level is acting as a crucial resistance.
I also observe that there will not be a positive close in 3M charts.
Reference:
Important Dates to Remember:
As suggested, March 25, 2025, marks a significant juncture in the overall trend.
This is pure technical based analysis & does not involve any economic data releases other factors.
** Final Verdict: **
The market is anticipated to conclude its final leg of the downtrend, commencing from this Tuesday. However, the duration of this leg can range from 1 to 2 months.
I have identified several crucial dates for monitoring the upcoming trend. Stay informed!
**Strategy:**
Given the prevailing market conditions, adopting a bearish stance appears prudent.
Any sell positions executed after 23,550 will yield positive returns.
While it may seem counterintuitive to deviate from the prevailing trend, I am merely adhering to the established rules (without expressing any personal sentiment). However, it is inherently risky. Therefore, it is imperative to implement robust risk management strategies during such high-risk trades that are significantly influencing the market.
Additionally, please exercise caution regarding option buying. The low volatility environment is concerning, but it is anticipated to normalize as the downtrend progresses.
Fellow Traders,
The creation of this valuable analytical resource has required countless hours of dedication and effort. If you find it useful, I humbly request your support by boosting the idea and following me (updates will be provided via this post, new posts, and through minds). Your comments and thoughts on this idea are highly valued, and I am committed to engaging with each one personally.
Thank you for investing your time in reading this article.
Wishing you profitable and fulfilling trading endeavors!
Disclaimer:
Before concluding, I must emphasize that the insights shared are based on my analysis. It is crucial for you to conduct your own research and, if necessary, consult with a financial advisor before making any trading decisions. The dynamic nature of financial markets necessitates that your strategies align with your financial objectives and risk tolerance.

Nifty Closes 1000 Points Higher – Will It Catch Up with BNFIn a strong move, Nifty 50 surged by 1000 points to close at 23,851, compared to last week’s close. The index made a weekly high of 23,872 and a low of 23,207. As highlighted in last week's analysis, a breakout above 23,400 could push Nifty toward 23,900 — a target it missed by just 23 points.
However, an intriguing divergence has emerged between Nifty and Bank Nifty. While Bank Nifty has scaled a new all-time high, Nifty still trades significantly below its previous all-time high of 26,277. This sets the stage for an interesting dynamic: Will Nifty rally to close the gap, or will Bank Nifty face a correction?
What to Expect Next Week?
For the upcoming week, Nifty is expected to trade in a range between 23,200 and 24,414. Despite the bullish signals on the daily and weekly timeframes, the monthly chart remains weak, indicating that volatility is likely to persist until a broader trend confirmation.
S&P 500 Outlook: Bounce or Breakdown?
The S&P 500 index saw a mild pullback, closing around 80 points lower from the previous week’s close of 5,363. Our “sell on rise” strategy mentioned last week worked well, as the index dipped post-rally.
Now, things get technically interesting. On the weekly chart, the S&P 500 is forming a potential bullish W pattern and an inside bar. A breakout above the previous week's high of 5,481 could trigger upward targets of 5,551, 5,637, and 5,679.
However, on the downside, a break below 5,115 would reintroduce bearish pressure, which could have negative ripple effects across global markets.
Key Market Takeaways:
Nifty 50: Strong rally, but still below ATH. Watch 23,200–24,414 range next week.
Bank Nifty: At ATH, diverging from Nifty – crucial to monitor.
S&P 500: At a technical crossroads – potential for breakout or breakdown

Nifty Analysis EOD – 17th April 2025🟢 Nifty Analysis EOD – 17th April 2025 🔴
Weekly Expiry Surprise – A One-Sided Short Covering Rally!
📌 Market Background
Before jumping into today’s rally, let’s briefly revisit yesterday’s analysis:
“Tomorrow’s weekly expiry + a holiday on Friday = high chance of a rangebound expiry day. Even if we get a gap-up due to global cues or news, I’m not expecting a breach above 23,500.”
This view was based on the recent expiry behavior and range contraction, especially with the past two days showing just a 170-point range and the last 10 expiries averaging a 192-point intraday range.
But today, the market did what it does best – surprised everyone!
📌 Today’s Price Action
Nifty gave a one-sided, mind-blowing short-covering rally on the weekly expiry day.
IB High + PDH Breakout triggered a sharp move early in the session.
Sustained price action above 23,550 in the morning session activated aggressive short covering.
This momentum carried Nifty all the way to an intraday high of 23,872.
Closing at 23,852, Nifty registered a new swing breakout, moving above its previous highest swing close.
📊 Intraday Movement Stats
Total movement: 574 points 🔥
Nifty: +414 points (+1.77%)
Bank Nifty: +1172 points (+2.21%)
Nifty 500: +277 points (+1.3%)
Midcap: +312 points (+0.60%)
Smallcap: +61 points (+0.37%)
📌 Key Observations
Bank Nifty is now just 177 points away from its All-Time High closing.
Smallcap and Midcap underperformance suggests today’s rally was index-heavy – many portfolios might not reflect the same gains as Nifty.
📉 So, What’s Next at 23,850?
Honestly… don’t know!
Will it push to 24,050?
Or take a pause and pull back for a retracement?
With Friday being a holiday, we’ll have to wait until Monday for clarity.
📌 Important Levels to Watch
🔼 Resistance Zones
23,950 ~ 24,000
24,050
24,190 ~ 24,225
🔽 Support Zones
23,820
23,660 ~ 23,710
23,500
23,400 ~ 23,430
23,340
23,200 ~ 23,190
🧠 Strategy Insight
Don’t chase. Watch price action around 23,820–23,950.
Be flexible. Don’t marry a bias. Let Monday’s opening structure guide your next move.

Nifty Futures intraday analysis for April 17, 2025As explained yesterday, I foresee a bearish trend and the support1 zone at 23358 and Support 2 is at 23313. A breakout below 23313 will bring the Nifty Futures down to 23237. Our Market Timing indicator is in line to our analysis.
This is just my view for the day. Traders must use their own technical study before entering into trades. Stop-Loss is a must for every trade.

Nifty near the trendline resistance now after another good day.Nifty has cleared the 200 days EMA or the Father line on Daily chart. But in the hourly chart depicted here has hit a resistance zone which happens to be a trend line resistance.
RSI of Nifty is currently above 73 and the scope for upside is there but limited. With a shortened week tomorrow we will have a weekly closing. So a positive closing tomorrow can place us in a good space for a next week. However with everchanging trade war scenario it is difficult to guess if investors will encash their long positions or carry them forward into the next week.
The next resistances for Nifty remain at 23456, 23621, 23713, 23784 and 23915 before Nifty regains 24K levels. The support zones for Nifty remain at 23292, 23156, (Mother and Father lines of hourly chart are close by near) 23017 and 22980. So this zone will be a strong support. A closing below 22980 can drag Nifty down towards 22771 or even 22361 region.
Also one must keep an eye on Reliance result tomorrow. As it is a index power house it can single handedly make or break the weekly closing. Flat or positive closing tomorrow will be very helpful for the bull run to continue.
Disclaimer:The above information is provided for educational purpose, analysis and paper trading only. Please don't treat this as a buy or sell recommendation for the stock or index. The Techno-Funda analysis is based on data that is more than 3 months old. Supports and Resistances are determined by historic past peaks and Valley in the chart. Many other indicators and patterns like EMA, RSI, MACD, Volumes, Fibonacci, parallel channel etc. use historic data which is 3 months or older cyclical points. There is no guarantee they will work in future as markets are highly volatile and swings in prices are also due to macro and micro factors based on actions taken by the company as well as region and global events. Equity investment is subject to risks. I or my clients or family members might have positions in the stocks that we mention in our educational posts. We will not be responsible for any Profit or loss that may occur due to any financial decision taken based on any data provided in this message. Do consult your investment advisor before taking any financial decisions. Stop losses should be an important part of any investment in equity.

Nifty Futures Daily Trend analysis for April 17, 2025As mentioned in my post yesterday (April 15, 2025), we have been eyeing the Nifty Futures resistance level at 23,460. Today, the price is approaching this level. Our Masters Cycle has confirmed a buy signal today, with a stop-loss set at 21,859.
Now, how should we approach intraday trading for tomorrow (April 17, 2025)?
As highlighted in yesterday’s update, our Future Candle Reversal Projection indicator has signaled a reversal day for April 17. Additionally, the Dynamic Candle Reversal indicator (note the small blue line plotted today) has confirmed an intraday bearish setup for tomorrow.
Considering these signals, we will focus on intraday shorting opportunities for April 17. However, for positional trades, we continue to maintain a bullish bias.
Disclaimer:
The views shared here reflect my personal analysis and are intended for educational purposes only. Market conditions may differ in real-time. If you are a trader, please conduct your own research and analysis before making any trading decisions. Always ensure that you trade with a proper Stop-Loss in place.

Resistance Zone approaching. Can the bulls defy the odds?Nifty is rallying for the last few days along with global markets due to relief provided by US President Donald Trump due to Tariff pause but we are approaching a zone where the maniac rise might halt or it might take some time to relax and catch a breath or two.
The zone of concern starts from Father line of daily chart which is near 23360. Once we get a closing above this point the zone between 23569 and 23893 will be little difficult to cross as it has the trend line resistance. Once we get a closing above 23893 the Bulls can be in very strong space where they can try to pull the market further 500/800 points upwards.
However we comment about it when we reach there. The support for Nifty in case the Father line or the Resistance zone of 23569/23893 plays a spoil sport will be 23174, 23039 (Strong Mother Line Support of Daily chart).
If the Mother line is broken and we get a weekly closing below the same Bears will come back into action and can try to drag the Nifty towards 22675, 22353 and finally 21737.
Disclaimer:The above information is provided for educational purpose, analysis and paper trading only. Please don't treat this as a buy or sell recommendation for the stock or index. The Techno-Funda analysis is based on data that is more than 3 months old. Supports and Resistances are determined by historic past peaks and Valley in the chart. Many other indicators and patterns like EMA, RSI, MACD, Volumes, Fibonacci, parallel channel etc. use historic data which is 3 months or older cyclical points. There is no guarantee they will work in future as markets are highly volatile and swings in prices are also due to macro and micro factors based on actions taken by the company as well as region and global events. Equity investment is subject to risks. I or my clients or family members might have positions in the stocks that we mention in our educational posts. We will not be responsible for any Profit or loss that may occur due to any financial decision taken based on any data provided in this message. Do consult your investment advisor before taking any financial decisions. Stop losses should be an important part of any investment in equity.

Nifty Futures Daily Trend AnalysisNifty Futures has been in an uptrend since closing above the SSL level at 23,018. The MastersCycleSignal indicator is currently acting as resistance at 23,460. A breakout above this level could open the path toward the next resistance at 23,801.
The Future Candle Reversal Projection indicator highlights potential upcoming intraday opportunities that contrast with the intraday trend of the day prior to the reversal. This is my personal view and shared for educational purposes only. Please conduct your own technical analysis and always trade with a stop-loss.

Nifty50 Wkly Anlysis – Strong Reversal, But Volatility AheadThe Indian stock market closed the week on an interesting note. The Nifty 50 index ended at 22,828, just 70 points lower than last week's close, after forming a significant bullish reversal from a low of 21,743 to a high of 22,923.
As we mentioned in last week's market outlook, a base formation was underway—and this week's price action confirmed it. With the next week being truncated due to market holidays on Monday and Friday, traders should expect increased volatility and sideways movement.
Key Technical Levels:
Support: 22,200 – This is 50% of this week's candle; a break may bring bearish momentum.
Resistance: 23,400 – A close above this could ignite a rally toward 23,900, 24,100, and possibly 24,414.
On the global front, the S&P 500 respected the 4,800 support level, rebounding sharply to close at 5,363. However, underlying market weakness remains, so it's a sell-on-rise situation in U.S. equities.
Pro Tip:
Indian investors should keep an eye out for quality, fundamentally strong stocks. Any correction in the market may offer excellent long-term buying opportunities.

Nifty in the Short Term can try to stage further recovery. After the drastic Trump Tariff war shock Nifty is trying to recover it's lost territory closing at 22828. Right now the Nifty is trapped between Mother and Father lines of its Hourly chart. The supports for Nifty remain at 22761 (Mother Line Support), 22675, 22353 and 21859. Below 21859 Nifty becomes very week again. The resistance for Nifty on the upper side remain at 22924 (Strong Father line Resistance), 23174 (Strong Trend line Resistance), 23384, 23569 and finally 23783. Above 23783 closing Nifty will become very Bullish.

Recovery by Nifty, Resistance zone ahead. (Economic commentary)Nifty has given a strong closing amidst global uncertainty. The uncertainty and heavy volatility will remain in the market so traders are requested to be very cautious especially with regards to Futures and Options. Any positive news can trigger a huge upside at the same time any negative news can trigger a huge downside as well.
India is silently staying neutral and trying to chart it's own deal should be seen as a positive view for long term investors. The focus of Indian investors should remain on companies which procure local raw material and supply it locally these will be the safest bets. MET has predicted a normal Monsoon for India with 103% rainfall which can another shot in the arm for Local markets. FMCG, Specialty Chemicals and Fertilizers, Banks and Financial services should be the sectors to focus.
Along with these sectors commodities and Consumption and can also be the theme as these are dark horses which can benefit from volatility. As Crude is sliding down the companies related to energy and those which are dependent on Oil & Gas, Energy for power and raw material can also benefit. The choice of the stocks should be smart at this juncture to reap rewards.
Long term investors should use this opportunity to invest in Blue chips and High Dividend Yield PSUs and other companies if they are sitting on cash. If not you can use these times to reshuffle your portfolios and align them as per the changing needs of the time. Neutral stance from India can even benefit it by getting FDI (Foreign Direct Investment) if Indian Governments plays it's cards smartly. Too much fog, mist and clouds around on global economy currently for investors to get a clear vision of sunrise sectors. Geo-political uncertainties are also blinding and making the objects in front of us look fuzzy. Investors need to keep patience, avoid speculation and let the dust settle. Even after reconsideration of changing global scenarios Indian GDP will still clock 6%+ so do not have much to worry in the long term. This volatility too shall pass and horizon will definitely be visible in the near future.
To know about how to select good companies to invest in read my book THE HAPPY CANDLES WAY TO WEALTH CREATION. It will help you in making solid triumphant decisions during these uncertain times. It teaches you Behavioural Finance, Fundamental Analysis, Technical Analysis, Profit Booking and many such important topics. The book is one of the highest rated in it's category. The book is available in Amazon in Paperback and Kindle version. You can also contact me directly for getting the same.
Nifty supports remain at: 22270, 21743 (Channel Bottom Support), 21281 (52 week Low support), 20745 and 20236. Below 20236 weekly closing the bears can try to Bring Nifty down to 200 Weeks EMA or the FATHER LINE which is at 19893.
Nifty Resistances remain at: 22913, 23249 MOTHER LINE which will be a (Major resistance), 23499 (Strong Trend line resistance), Above 23499 Bulls can become more active and try to Pull Nifty upwards towards 23894, 24334, 24831 and 25419. After we get a monthly closing above 25419 we can think of regaining 26K levels.
Short Term Outlook : Brace for massive volatility.
Medium Term Outlook: Range Bound Nifty.
Long Term Outlook: Still Very Strong.
Disclaimer: The above information is provided for educational purpose, analysis and paper trading only. Please don't treat this as a buy or sell recommendation for the stock or index. The Techno-Funda analysis is based on data that is more than 3 months old. Supports and Resistances are determined by historic past peaks and Valley in the chart. Many other indicators and patterns like EMA, RSI, MACD, Volumes, Fibonacci, parallel channel etc. use historic data which is 3 months or older cyclical points. There is no guarantee they will work in future as markets are highly volatile and swings in prices are also due to macro and micro factors based on actions taken by the company as well as region and global events. Equity investment is subject to risks. I or my clients or family members might have positions in the stocks that we mention in our educational posts. We will not be responsible for any Profit or loss that may occur due to any financial decision taken based on any data provided in this message. Do consult your investment advisor before taking any financial decisions. Stop losses should be an important part of any investment in equity.

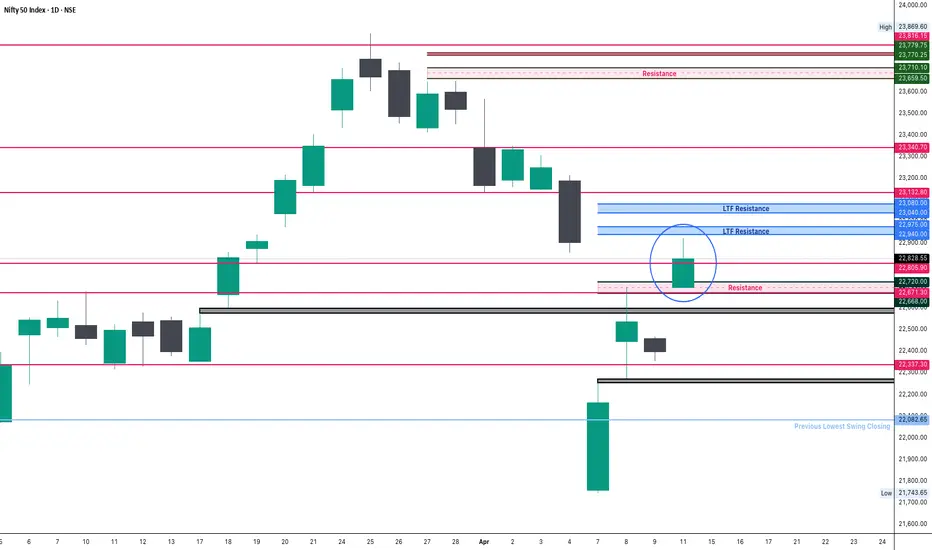
Nifty Analysis EOD - 11th April 2025📌 Background
After yesterday’s holiday, global cues were positive—especially from the US markets. SGX Nifty indicated a strong gap-up. As expected, Nifty opened at 22,695, right around the previous session’s high and within our marked Resistance Zone.
📌 Today’s Price ActionNifty opened with a sharp gap-up, and the Initial Balance (IB) high was formed at 22,875. The price managed to breach the IB high briefly, triggering a trade signal and filling the gap between 4th and 7th April sessions.However, the index failed to sustain above 22,875–22,900. Momentum fizzled out post-breakout, and Nifty retraced toward the opening zone.
🧊 Intraday range was 228 points, out of which 165 points occurred during the IB phase. Most of the move was already baked in early on.
📉 Despite gaining +429 points intraday, Nifty closed at 22,828, slightly below the previous week’s high of 22,857—which hints at a pause or temporary exhaustion.
📌 Technical OutlookNifty is still playing between supply and demand zones. Today’s rejection from above 22,900 and close below the weekly high indicates a need for further strength or a catalyst to push beyond 23,000 convincingly. A clean break above 22,900–23,000 remains key.
📌 Important Levels
🔼 Resistance Zones
22,857 (Weekly High)
22,900–23,040
23,182
23,340
🔽 Support Zones
22,668 (Breakout Zone)
22,337
22,082 (Previous Lowest Swing Close)
🧠 Strategy Going ForwardIf no negative news flow arises, a retest of 23,000–23,040 is likely. Traders should wait for sustained price action above 22,900 for fresh longs.Avoid aggressive shorts unless the price breaks down below 22,668 with momentum.
📋 Quick Recap✅ Gap-up opening on global cues✅ IB High breached and gap filled✅ 228-point range; majority in IB✅ Resistance at 22,900 held firm✅ Closed below weekly high
🧘 Patience is power. Wait for confirmation beyond resistance.
India along with the globe stages a recovery. Indian markets staged a recovery along with it's global peers. Although the market moved 374 points upwards. After making a high of 22697 the market closed at 22535 which is 162 points down. Which means it has formed a Bullish Doji. Now Doji candle irrespective of the colour means uncertainty, until we clear the Doji top further upside will not be possible. The doji top resistance is at 22697 and Doji bottom support is at 22270.
Doji works like a cage. The bird will fly either side once the cage is broken.
To know more about the kind of candles, Mother, Father lines, behavioural finance, Technical analysis, fundamental analysis read my book: The Happy Candles Way to Wealth creation.
Nifty Supports remain at: 22270 (Doji cage support), 21743 current low of Trump Tantrum, 21289, 20790 (Channel Bottom support) and 20320.
Nifty Resistances remain at: 22697 (Doji cage resistance), 23061 Mother line resistance, 23376 Father line resistance and 23894 recent market high.
Disclaimer: The above information is provided for educational purpose, analysis and paper trading only. Please don't treat this as a buy or sell recommendation for the stock or index. The Techno-Funda analysis is based on data that is more than 3 months old. Supports and Resistances are determined by historic past peaks and Valley in the chart. Many other indicators and patterns like EMA, RSI, MACD, Volumes, Fibonacci, parallel channel etc. use historic data which is 3 months or older cyclical points. There is no guarantee they will work in future as markets are highly volatile and swings in prices are also due to macro and micro factors based on actions taken by the company as well as region and global events. Equity investment is subject to risks. I or my clients or family members might have positions in the stocks that we mention in our educational posts. We will not be responsible for any Profit or loss that may occur due to any financial decision taken based on any data provided in this message. Do consult your investment advisor before taking any financial decisions. Stop losses should be an important part of any investment in equity.

Nifty Daily view on Friday (April 11, 2025)According to my analysis, the Nifty is still bearish on a daily basis. However, I foresee an opportunity in the bullish signals on April 11, 2025. Since I am considering the gaps on the either direction, traders should follow technical analysis before entering into trades.

The Nifty spot weekly analysisBased on my analysis, the Trend Trading indicator continues to signal a bullish outlook, with a strong support level at 22,150. However, if Nifty Spot closes below this level on a weekly basis, the next potential support could be around 20,241. Considering the influence of the time factor on price movements, market bearishness may persist until the end of June 2025, with a possible positive shift beginning in July.

Nifty’s Make-or-Break Zone: Will Bulls Charge or Bears Bite?www.tradingview.com
---
### 🧠 **1. Context at-a-glance**
- Recent bounce from a **Demand Zone (D1 Key Level)** around **21,800**.
- Strong bullish rally into a **Supply Zone (~22,600–22,750)**.
- Price is currently showing **hesitation within this resistance**, with smaller-bodied candles forming → potential reversal signals.
- The oscillator has **crossed bullish** from oversold but is nearing a decision zone.
---
### 🔮 **Future Move Scenarios**
#### 🟥 SCENARIO A: **Rejection from Supply Zone** (Most Likely Short-Term)
- **Why?** Price has hit a resistance with fading momentum and no breakout confirmation.
- **What happens?**
- Price retraces toward **22,200**, potentially even **21,800–21,900**.
- Retest of BOS level possible before the next directional leg.
- **Watch for:** Bearish candle formations (engulfing / long wicks), oscillator stalling below 50.
---
#### 🟩 SCENARIO B: **Bullish Breakout Above 22,750**
- **What confirms it?**
- A strong bullish candle closing above 22,750 with follow-through.
- **Next Targets:**
- 🔼 **23,000** (round level and minor resistance)
- 🔼 **23,300–23,500** (old supply zone)
- Eventually back to **23,750+**
- **Oscillator support:** If the indicator crosses 50+, bullish momentum could sustain.
---
### 📉 Oscillator Hints:
- Still below 50 — **recovery in progress**, not full momentum yet.
- If price rejects and oscillator drops → **Bearish divergence** possibility.
---
### 🧭 **Your Playbook**
| Zone | Action Idea | Trigger to Watch |
|------------------|-------------------------------|----------------------------------|
| 22,600–22,750 | Short / Hedge | Rejection candle, loss of momentum |
| 22,200–22,300 | Potential buy zone (aggressive) | Bullish candle or bounce confirmation |
| Break > 22,750 | Buy on Retest or Momentum | Breakout candle + volume |
| < 21,800 | Bearish continuation | Break of demand zone + close below |
---
