#NIFTY Intraday Support and Resistance Levels - 01/07/2025Nifty is expected to open with a slight gap up near the 25,550 level, which lies close to a minor resistance zone. If the index manages to sustain above this region, we may see a continuation of bullish momentum with potential upside levels at 25,600, 25,650, and 25,700. Holding above 25,550 would signal strength, supported by recent recovery attempts from lower levels.
However, if the index fails to hold above 25,550 and starts slipping below 25,450, weakness may creep in. A fall below 25,450 could open the door for downside targets of 25,350, 25,300, and possibly 25,250. Traders should stay cautious around the 25,550–25,600 zone for a clear directional move, with strict stop losses on both sides.
Niftyprediction

Nifty is Bearish for next week. But Why ? "Ask me in comments".Nifty is facing resistance at this level for a specific reason. this week it can be bearish and continue to go down side.

#NIFTY Intraday Support and Resistance Levels - 30/06/2025Nifty is expected to open on a flat note near the 25,630 zone. The market has shown strong bullish momentum in recent sessions, and prices are now hovering near the upper resistance band of 25,750. If Nifty manages to break and sustain above the 25,750 level, a fresh upward move can be expected, with targets around 25,850, 25,900, and 25,950+. This could offer good long opportunities, especially above the 25,750–25,770 breakout range.
On the downside, if Nifty faces resistance around 25,750 and starts to reverse from that level, a short opportunity could emerge in the 25,750–25,700 zone. In such a case, reversal targets can be seen at 25,650, 25,600, and 25,550. Support at 25,550 will act as a crucial level to watch.

NIFTY OVERVIEWGet to know something from Manish Bhai that happened in the past. Now, compared to the current market, this is what the market is looking for.

28 june Nifty50 brekout and Breakdown leval ✅ Level 1: ₹26,018
Above 10-Min Candle Closing
🔹 Indicates a short covering zone
🔸 Strategy: Close all PE positions, shift to CE or book profits
Below 10-Min Candle
🔹 Hold PE positions (Safe Zone)
🔸 Suggests market facing resistance here
✅ Level 2: ₹25,830
Above 10-Min Candle
🔹 Entry-level for holding CE positions
🔸 Possible bullish breakout
Below 10-Min Candle
🔹 Hold PE – but this is a Risk Zone
🔸 Caution: Trend reversal may happen
✅ Level 3: ₹25,670
Above 10-Min Candle
🔹 Indicates positive market sentiment
🔸 Hold CE (Calls)
Below 10-Min Candle
🔹 Indicates negative trade view
🔸 Hold PE (Puts)
✅ Level 4: ₹25,578
Above Opening S1 Level (10-Min Candle)
🔹 CE buy/hold confirmation
Below Opening R1 Level (10-Min Candle)
🔹 PE hold confirmation
🔸 Market turning weak
✅ Level 5: ₹25,478
Above 10-Min Candle
🔹 Buy/Hold CE
Below 10-Min Candle
🔹 Buy/Hold PE
🔸 Important pivot level – directional bias confirmation
✅ Level 6: ₹25,290
Above 10-Min Candle
🔹 Safe Zone to hold CE
Below 10-Min Candle
🔹 Unwinding zone
🔸 Exit CE positions, reduce longs – possible sharp fall
📊 Live Market Reference
Current Market Price (CMP): ₹25,632.45
Below ₹25,670 = Negative Bias
Strategy: Until price crosses ₹25,670 and sustains for 10 min, avoid CE entries or keep trailing SL on PE.
🎯 Sample Option Strategy (Example):
If price is below ₹25,670:
✅ Buy PE (Put Option)
Strike: ATM or slightly ITM (e.g., 25,600 PE)
Stop-Loss: If price moves above ₹25,670
Target: ₹25,478 / ₹25,290
If price is above ₹25,670:
✅ Buy CE (Call Option)
Strike: ATM or slightly OTM (e.g., 25,700 CE)
Stop-Loss: If price breaks back below ₹25,670
Target: ₹25,830 / ₹26,018
📌 Important Notes:
This strategy is intraday based on 5-min chart levels.
Levels like ₹25,478 and ₹25,290 are key for risk management.

The Nifty Futures Intraday Trend analysis on June 30, 2025According to my analysis and time cycle study, a Gap Down opening is likely on Monday, June 30, 2025. However, the intraday trend appears bullish. Key support levels are at 25,707 and 25,635, while resistance is seen at 25,788 and 25,808. I consider 25,808 to be a strong resistance level—if breached, it may trigger further bullish momentum.
The magnitude of the gap remains uncertain. These levels reflect my personal analysis and are not guaranteed.
Trading in Futures and Options involves significant risk. Traders are strongly advised to conduct their own technical analysis before making trading decisions.

#NIFTY Intraday Support and Resistance Levels - 27/06/2025Nifty is expected to open with a strong gap up near the 25,750 level, indicating bullish sentiment continuation from the previous sessions. If Nifty sustains above this 25,750 mark, it could trigger a breakout setup. In that case, long positions can be considered above 25,750 with targets placed at 25,850, 25,900, and 25,950+. This zone aligns with a potential resistance-turned-breakout level, and a move beyond it could bring in further momentum on the upside.
On the other hand, if Nifty fails to hold above the 25,750 level and shows signs of rejection, then it may consolidate or experience mild profit booking. Key intraday support lies near the 25,550–25,600 range. A break below this can drag the index down to 25,450 or even 25,250.

INDIANB - 640 ABOVEIndianb no have in very good levels, long consolidation breakout and sustaining near
ATH...
Above 640 possible good rally up side for short term gain

#NIFTY Intraday Support and Resistance Levels - 26/06/2025Nifty is set to open slightly gap up today near the 25,250 mark, signaling a continuation of the ongoing consolidation phase. The market has been hovering around this zone for the past couple of sessions, making it a key inflection point. A sustained move above 25,300 can trigger bullish momentum, leading to targets of 25,350, 25,400, and 25,450+. This level also coincides with previous intraday highs, making it a potential breakout zone for aggressive buyers.
On the flip side, if Nifty faces rejection from this resistance zone and slips below the 25,250–25,200 levels, a downside move could emerge. In that case, short positions can be considered with immediate support levels at 25,150, 25,100, and 25,050. The opening hour will be crucial—traders should monitor for either a breakout above 25,300 or a breakdown below 25,200 to determine intraday direction. Volatility may increase due to expiry, so a wait-and-watch approach with tight stop-losses is advisable.

#NIFTY Intraday Support and Resistance Levels - 25/06/2025Nifty is expected to open with a gap-up near the 25,250 level, signaling early bullish strength. If the index sustains above the 25,250–25,300 zone after opening, we could see a continuation of the upward momentum toward the next resistance levels at 25,350, 25,400, and possibly 25,450+. However, if it fails to hold above 25,250 and slips back into the 25,100–25,050 zone, there could be selling pressure. A break below 25,050 may drag Nifty further down to 24,950. If 24,950 breaks, then a short trade could trigger, with targets at 24,850, 24,800, and 24,750. The key levels to watch today are 25,250 on the upside and 24,950 on the downside.

#NIFTY Intraday Support and Resistance Levels - 24/06/2025Today, Nifty is expected to open with a gap-up near the 25,250 level. This level is crucial, as a sustained move above it can trigger a strong upside rally. If Nifty manages to hold above 25,250, we may see targets of 25,350, 25,400, and even 25,450+ in the coming sessions. On the downside, if the index slips below 24,950, it could lead to a corrective move toward 24,850, 24,800, and potentially 24,750 zones.
Traders should closely watch the 25,050–25,100 range for intraday strength, and the 24,950 mark as immediate support. Any breakout or breakdown from these levels will offer direction for the day. Maintain strict stop-loss and consider trailing profits as levels get tested.

24 June nifty breakout & breakdown levels 🔺 Bullish (Call Option / CE) Strategy:
✅ Buy CE (Call Option) when:
Above 24,710 → Entry for bullish trade
"Above 10m hold CE by buy level"
Above 24,870 → Stronger confirmation
"Above Opening S1 10M Hold CE By level"
Above 25,020 → Positive trade view
"Above 10M hold positive trade view"
Above 25,130 → Safer CE entry zone
"Above 10M hold CE by entry level"
Above 25,233 → Closing shot level
"Above 10M Closing Shot cover level"
🔻 Bearish (Put Option / PE) Strategy:
✅ Buy PE (Put Option) when:
Below 24,710 → Entry for bearish trade
"Below 10m hold PE By level"
Below 24,870 → Bearish confirmation
"Below Opening R1 10M Hold PE By level"
Below 25,020 → Negative trade view
"Below 10M hold nigeative trade view"
Below 25,130 → Risky PE zone
"Below 10M hold PE By Risky Zone"
Below 25,233 → Safer PE Zone
"Below 10M hold PE By Safe Zone"

#NIFTY Intraday Support and Resistance Levels - 23/06/2025A flat opening is expected in Nifty today. If Nifty sustains above the 25,050–25,100 zone after the open, we can expect an upside rally toward 25,150 → 25,200 → 25,250+ levels. This bullish momentum may continue if Nifty remains strong above 25,100.
However, any downside momentum may begin if Nifty starts trading below 24,950, which is a crucial support zone. In such a scenario, the index could slip toward 24,850 → 24,800 → 24,750- levels.
For intraday trades, focus on breakout or breakdown levels, and manage risk with trailing stop-losses in place.

#NIFTY Intraday Support and Resistance Levels - 20/06/2025A flat opening is expected in Nifty today. After the open, all eyes will be on the 24,700 level, which has acted as a key support zone recently.
🔽 If Nifty starts trading below 24,700, downside momentum may pick up, with potential targets at 24,650 → 24,600 → 24,550-. Sustained weakness below 24,700 could attract short positions.
🔼 On the upside, if Nifty reclaims 24,750–24,800 and sustains, a bullish move may trigger toward 24,850 → 24,900 → 24,950+. However, 24,950 remains a strong resistance area from the past sessions.
⚠️ Strategy Note:
Market remains in a range-bound zone; wait for a decisive breakout for positional trades.
Use strict stop-losses and manage risk actively.
Ideal approach: scalp the range with quick profit booking unless a directional move confirms.

Nifty 50 Trapped in a Tight Range – Breakout or Breakdown Ahead?📍 Market Overview:
For over a month now, the Nifty 50 Index has been moving sideways in a tight consolidation range, frustrating both bulls and bears. Since May 12, 2025, the index has fluctuated between 24,350 on the lower side and 25,250 on the upper side, forming a classic rectangular pattern often associated with accumulation or distribution phases.
This zone is now becoming a crucial battlefield that could define the index’s direction for the coming sessions.
🔲 The Consolidation Zone
Support Zone: 24,350 – 24,450
Resistance Zone: 25,150 – 25,250
Consolidation Duration: ~30+ days
Current Price: 24,793.25
This range has seen multiple rejections at the top and bottom, reflecting indecisiveness in broader market sentiment. Traders are waiting for a trigger — either fundamental or technical — that could push the index out of this range with strength.
📈 Bullish Scenario: Breakout Above 25,350
If Nifty 50 breaks and sustains above 25,350, especially with higher volume and a strong daily close, it could signal a bullish continuation pattern. This scenario would be supported by:
A potential breakout from the rectangle consolidation.
Positive sentiment from global markets or domestic catalysts (monsoon, earnings, policy announcements, etc.)
A shift in FII or DII buying behavior.
📌 Breakout Target:
👉 26,000 – 26,100 (Based on measured move projection)
📌 Next Resistance Zone:
👉 26,050 – 26,200
In this case, traders may look for long opportunities with trailing stop-losses under the breakout zone.
📉 Bearish Scenario: Breakdown Below 24,350
On the flip side, a decisive breakdown below the 24,350 mark, especially with increased selling pressure and bearish candles, may lead to a quick decline toward the next major support levels.
📌 Breakdown Target:
👉 23,550 – 23,400
📌 Next Support Zone:
👉 23,500 – 23,300
This could trigger panic selling or profit-booking in frontline stocks. Caution is advised in such scenarios, and shorting opportunities may arise for experienced traders.
🧠 Strategic Insights for Traders
Avoid trading within the range: Unless you're scalping, wait for breakout/breakdown.
Watch global cues and FII flows: They often align with large breakouts.
Stick to risk management: Whichever direction the index moves, always set a stop loss.
🚀 Final Thoughts
The market is clearly in a wait-and-watch phase, but such consolidation periods often precede large moves. Nifty’s current structure suggests a breakout or breakdown is imminent — and being positioned correctly can make a big difference in returns.
Stay alert. Don’t predict — prepare.
⚠️ Disclaimer
This article is for educational and informational purposes only and does not constitute financial advice or a recommendation to buy or sell any securities. Trading and investing in the stock market involve risk, including the risk of losing capital. Always conduct your own research or consult with a qualified financial advisor before making any trading decisions. We are not responsible for any losses incurred from decisions based on this analysis.

#NIFTY Intraday Support and Resistance Levels - 19/06/2025Today, a flat opening is expected in Nifty around the 24,800 level. The index continues to trade within a narrow range, indicating market indecision and potential consolidation.
🔼 On the upside, if Nifty sustains above the 24,750–24,800 zone, it may trigger a bullish move toward 24,850 → 24,900 → 24,950+. Sustained strength above 24,950 can further open room for a breakout.
🔽 On the downside, if the index slips below 24,700, a short opportunity may arise toward 24,650 → 24,600 → 24,550-. Breach of 24,550 could lead to deeper correction.
⚠️ Key Notes:
The market is likely to remain range-bound and volatile.
Reversals from resistance and support levels are possible.
Trade with a strict stop loss and manage positions actively.

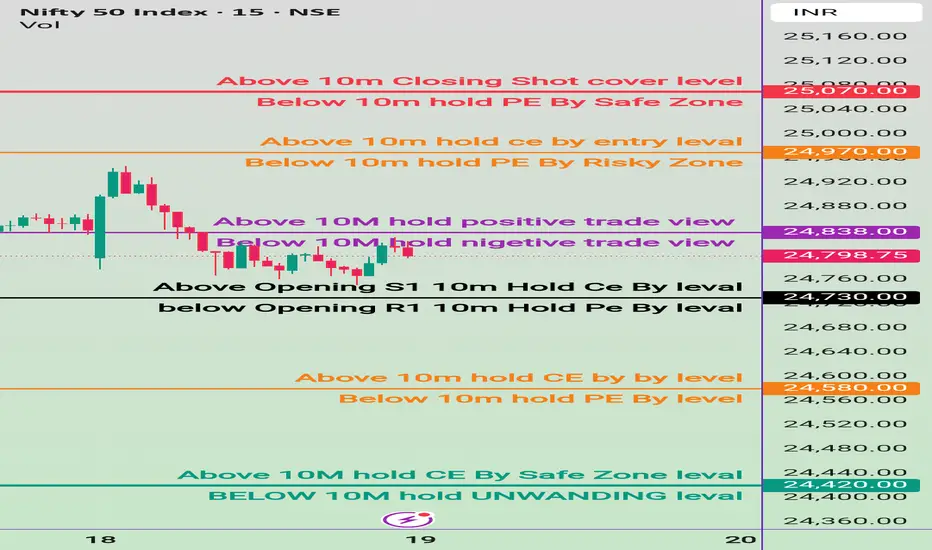
19 june Nifty50 brekout and Breakdown leval
✅ Safe Buy Zone (Support Levels):
24,437.70 → Above 10M: Hold CE by Safe Zone Level
24,420.00 → Below 10M: Hold Unwinding Level
→ Breach below could trigger unwinding / profit booking.
🔴 Resistance & Bearish PE Zones:
25,070.00 – Above 10m closing: Short Cover Level
→ Strong resistance; if crossed and sustained, short covering possible.
24,970.00 – Above 10m: Hold CE by Entry Level
→ Bullish entry confirmation level.
24,838.00 – Above 10M: Hold Positive Trade View
→ Indicates shift to bullish bias if held above.
⚫ Opening Based Levels:
24,730.00
→ Above Opening S1: Hold CE by Level
Below Opening R1 (level not clearly marked with value but appears near 24,730)
→ Hold PE by Level
#NIFTY Intraday Support and Resistance Levels - 18/06/2025Today, Nifty is expected to open with a slight gap down near the 24,850 zone, indicating caution among participants at higher levels.
🔼 If Nifty sustains above the 24,750–24,800 zone, a positive move may unfold with upside targets at 24,850 → 24,900 → 24,950+. Sustained strength above 24,950 could lead to a further rally.
🔁 On the other hand, if Nifty approaches the 24,950–24,900 zone and shows signs of rejection, it could lead to a reversal. In that case, the downside targets may be 24,850 → 24,800 → 24,750-.
🔽 A decisive move below the 24,700 level would indicate bearish control, opening further downside towards 24,650 → 24,600 → 24,550-.

18 june Nifty50 brekout and Breakdown leval
CALL (CE) – Bullish triggers
↑ 24,437 – 24,547 : Safe‑zone long entry
↑ 24,672: Hold CE while above this mark
↑ 24,780 : Opening‑S1 breakout, keep holding CE
↑ 24,930.00 : Turns bias positive; fresh CE can be added
↑ 25,083.00 : Entry level for aggressive longs
↑ 25,318.00 : Short‑cover zone; strong upside momentum possible
PUT (PE) – Bearish triggers
↓ 25,318.00 : If price closes back under, shift to PE (safe)
↓ 25,083 : PE in the “risky” reversal zone
↓ 24,930 : Bias flips negative; keep/add PE
↓ 24,780 : Opening‑R1 break; hold PE
↓ 24,672 : Continue PE below this level
↓ 24,535 : Unwinding zone – watch for fast drops
↓ 24,437 : Final downside support; trail PEs here

This Water Related Stock is A Good Buy....#shaktipump looks good around 1030 to go long and let it make a new high.
Water Management Stock.

#NIFTY Intraday Support and Resistance Levels - 17/06/2025Today, a flat opening is expected in Nifty near the 24,950 level. The index has been moving in a narrow consolidation zone and currently trades just below an important resistance. If Nifty manages to sustain above the 25,050–25,100 zone after the opening, we may witness bullish momentum building up. This could lead to an upward move toward 25,150, 25,200, and possibly 25,250+ levels during the day.
However, if Nifty fails to hold above the 24,950 mark and slips into weakness, it may invite intraday profit booking. A drop below the 24,900–24,950 level could open the downside toward 24,850, 24,800, and 24,750 levels. This zone has previously acted as a support range, and any break here could intensify selling pressure.

Nifty Analysis EOD – June 16, 2025 – Monday🟢 Nifty Analysis EOD – June 16, 2025 – Monday 🔴
📈 Expected Follow-Through Plays Out – Bulls Eye 25K Hurdle Next
Nifty opened flat-to-positive at 24,737, briefly dipped to the day’s low of 24,703.60, and then reversed smartly to touch an intraday high of 24,967.10 by 13:40. After that, the index spent the rest of the day consolidating in a narrow 40-point band and closed at 24,940.95 intraday (adjusted close: 24,946.50), delivering a solid +227.90 point gain.
As anticipated, the 24,768–24,800 support zone provided the launchpad for further upside, confirming the bullish follow-up from Friday's recovery. The rally tested 24,967, just shy of the crucial resistance at 24,972, which remains a key watch for the next session.
🔍 However, going forward, the bulls face major challenges around 25,000–25,080. This zone has acted as a hurdle in the past and could either stall the rally or serve as a breakout trigger. Watch price behavior carefully around these levels to assess conviction.
🛡 5 Min Chart with Levels
🕯 Daily Time Frame Chart
🕯 Daily Candle Breakdown
Open: 24,732.35
High: 24,967.10
Low: 24,703.60
Close: 24,946.50
Change: +227.90 (+0.92%)
📊 Candle Structure Breakdown
Real Body: 214.15 pts → 🟢 Strong Green Candle
Upper Wick: 20.60 pts
Lower Wick: 28.75 pts
🔍 Interpretation
Opened near day’s low, closed near day’s high — classic bullish sentiment.
Small wicks show controlled buying with minimal resistance and shakeouts.
Reinforces the bulls’ momentum after Friday’s OL recovery candle.
🔦 Candle Type
💚 Bullish Marubozu–type / Bullish Continuation Candle– Often found during the middle leg of a bullish swing, signaling strong trend momentum.
📌 Key Insight
Today's price action confirmed continuation of the recovery.
Close above 24,950–25,000 in the next session could ignite fresh upside.
Rejection around 25,060–25,080 would indicate caution — stay nimble.
🛡 5 Min Intraday Chart
⚔️ Gladiator Strategy Update
ATR: 268.49
IB Range: 114.05 → Medium IB
Market Structure: ⚖️ Unbalanced
Trades:
✅ 10:20 AM – Long Triggered → Target Achieved, Trailing SL Hit (RR: 1:3.28)
📌 Support & Resistance Zones
Resistance Levels
24,972 ~ 25,000
25,060 ~ 25,080
25,102 ~ 25,125
Support Levels
24,894 ~ 24,882
24,825 ~ 24,847
24,725 ~ 24,735
24,660
💭 Final Thoughts
The market played exactly as mapped — now it’s about decision time near 25K. Will the bulls charge ahead or pause? Either way, the structure favors short-term bullishness — but profit booking pressure near resistance must be expected.
🧠 “Momentum is a gift – but without volume and conviction, it fades at resistance.”
✏️ Disclaimer
This is just my personal viewpoint. Always consult your financial advisor before taking any action.

#NIFTY Intraday Support and Resistance Levels - 16/06/2025Today, a slightly gap-up opening is expected in Nifty near the 24,735 level. If Nifty sustains above the 24,750–24,800 zone after the opening, it may lead to a continuation of the upside move toward 24,850, 24,900, and potentially 24,950+ during the day. This zone can attract intraday buying interest, especially if supported by volume and momentum.
However, any rally approaching the 24,950 level should be watched cautiously, as it may act as a reversal zone, triggering profit booking or intraday resistance.
On the other hand, if Nifty fails to hold 24,700 levels and starts drifting lower, fresh selling pressure could emerge, pushing the index toward 24,650, 24,600, and even 24,550 during the session.
