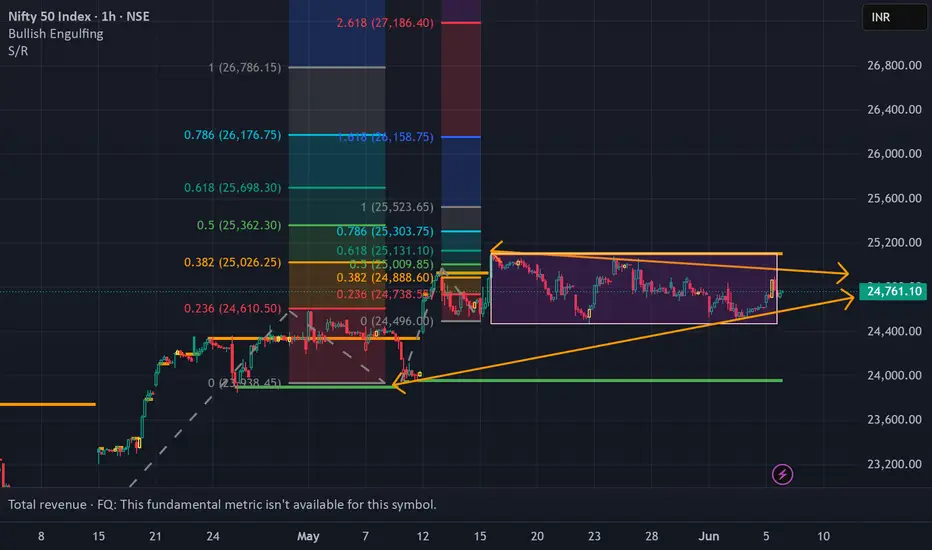
NIfty SpotVery good resilience shown by Indian Markets amid Global uncertainty.
Iran - Israel war will surely have an impact on opening of the markets tomorrow..
The way the war is continuing all likely hood of opening deep red...tomorrow
Well but i feel taht will be a good opportunity to buy near 24000-23850 Zone... as it is also a previous GAP so all possibility of finding suppport near that level
Have marked important level on chart.
Like... Share... Comment.
Niftyprediction

Nifty Analysis EOD – June 13, 2025 – Friday 🟢 Nifty Analysis EOD – June 13, 2025 – Friday 🔴
🕊️ Gap-Down on Geopolitical Tension – Buyers Step In at Crucial Support
Nifty opened with a massive gap-down of 415 points at 24,473 triggered by overnight geopolitical tensions — testing a crucial swing low from May 22. Interestingly, the market formed an OL (Open = Low) pattern and staged a powerful 281-point intraday recovery, closing near the day’s high at 24,718.60.
While the adjusted close still reflects a −0.68% drop, the price action was dominantly bullish. The strong bounce from the 24,460–24,520 demand zone — a region that had acted as a reversal zone multiple times earlier — reaffirms its significance.
🧭 If global cues stabilize or turn positive, this could pave the way for a bounce back toward 25,000. But if Friday’s low is breached, sentiment damage may deepen further. For now, intraday opportunities are preferable over positional plays, as uncertainty persists.
📝 A reminder from the May 22 note:
“Is the retracement run finished? Technically, YES. A bold call, but unless global headwinds reappear, today’s low must sustain.”
Nifty has once again honored this level — but the coming sessions will determine whether this bounce was genuine or temporary.
🛡 5 Min Chart with Levels
🕯 Daily Time Frame Chart
🕯 Daily Candle Breakdown
Open: 24,473.00
High: 24,754.35
Low: 24,473.00
Close: 24,718.60
Net Change: −169.60 (−0.68%)
📊 Candle Structure Breakdown
Real Body: 245.60 pts → 🟢 Strong Green Candle
Upper Wick: 35.75 pts
Lower Wick: None (OL Formation)
🔍 Interpretation
Despite the gap-down, bulls took control right from the open.
The absence of a lower wick signals firm intraday confidence.
Closing near the high reinforces the buying strength, even on a net down day.
🔦 Candle Type
💚 Bullish Marubozu–like (OL) Candle– Represents a strong intra-session reversal, where buyers dominated from the very first tick.
📌 Key Insight
Price respected the 24,460–24,520 zone, once again validating it as key support.
If the next session crosses and sustains above 24,750–24,770, a short-term reversal confirmation could follow.
However, a breakdown below 24,473 may renew bearish pressure.
🛡 5 Min Intraday Chart
⚔️ Gladiator Strategy Update
ATR: 269.05
IB Range: 145.05 → Medium IB
Market Structure: Balanced
Trades:✅ 10:20 AM – Long Triggered → Target Achieved, Trailing SL Hit (RR: 1:1.7)
📌 Support & Resistance Zones
Resistance Levels
24,725 ~ 24,735
24,825 ~ 24,847 (Fibonacci 0.5 retracement level)
24,882 ~ 24,894
24,972 ~ 25,000
25,060 ~ 25,080
Support Levels
24,660
24,640 ~ 24,625
24,420
24,365 ~ 24,330
24,245 ~ 24,220
💭 Final Thoughts
Friday’s session was a battle between fear and resilience — and bulls showed up just in time. The key test ahead: can the index reclaim 25K or will the bounce fade away?
🧠 “Great rebounds are born from great fear — but follow-through is what separates noise from reversal.”
✏️ Disclaimer
This is just my personal viewpoint. Always consult your financial advisor before taking any action.

#NIFTY Intraday Support and Resistance Levels - 13/06/2025Today, a gap-down opening is expected in Nifty near the 24,700 level. If Nifty sustains below the 24,700 mark after opening, a continuation of the bearish trend may take place with potential downside targets at 24,650, 24,600, and even 24,550+.
On the other hand, if Nifty manages to reclaim the 24,750–24,800 zone and starts trading above it, we could see a short-term pullback or recovery rally towards 24,850, 24,900, and 24,950+ levels.
However, the 24,950 level will act as a strong resistance for today’s session — any upside attempt may see rejection or profit booking from this zone.

Nifty 12-JUNE-25 VIEW Everything is on chart for SWING view
AREA UP AREA LOW SPACE
AND MY VIEW FOR LONGTERM IS SAME

13june Nifty50 brekout and Breakdown leval✅ Bullish (Buy/Call - CE) Zones:
24628–Above 10m hold CE by zone
24788 –Above 10m hold CE by zone
24970 –Above 10m hold CE by zone
25170 –Above 10m hold CE by zone
25388 - Above 10m Closing: Shot Cover Possible
24488 -Above 10m hold CE By Safe Zone
Bearish (Buy/Put - PE) Zones:
25388 -Below 10m hold PE by zone
25170 –Below 10m hold PE by zone
24970 -Below 10m PE By Risky Zone
24628 -Below 10m Hold PE by Risky Zone
24488. BELOW UNWINDING POSSIBLE


#NIFTY Intraday Support and Resistance Levels - 12/06/2025Today, a gap-up opening is expected in Nifty near the 25250 level. If Nifty sustains above this zone, we may see bullish momentum extending toward the targets of 25350, 25400, and potentially 25450+ during the session.
However, if Nifty fails to hold above 25250 and begins reversing below 25200, it could trigger a pullback move. A reversal short opportunity may arise in the 25250–25200 range with potential downside targets of 25150, 25100, and 25050.
Overall sentiment remains bullish above 25250, but volatility is likely near resistance levels. Traders are advised to keep tight stop-losses and trail profits cautiously, as the market may remain range-bound with occasional spikes.

#NIFTY Intraday Support and Resistance Levels - 11/06/2025Nifty opened with a slight gap-up near the 25100 level, continuing its recent pattern of consolidation. Despite the positive opening, the index remains well within its established range, suggesting that market participants are still awaiting a decisive breakout. There are no major changes observed in key support or resistance levels compared to the previous sessions, reinforcing the view that the market is currently lacking strong directional momentum.
On the upside, if Nifty sustains above the 25100–25250 zone, it could attempt a move toward 25350, followed by 25400 and potentially 25450+. However, this upward move will require strong follow-through buying to break the current consolidation zone. Until then, any intraday rallies may face resistance near the 25250 mark, making it a crucial level to watch for bulls.
Conversely, failure to hold above the 25200–25250 region could lead to a reversal toward 25150, and if selling pressure intensifies, a further decline toward 25100 and 25050 may unfold. These levels are important short-term supports and have previously acted as buying zones. A break below 25050 may open the gates for deeper cuts, though that remains unlikely unless broader market sentiment weakens.

BANKNIFTY is moving towards 59000The monthly Cash Data chart is forming a diametric pattern. Waves (a) through (f) have completed and we are currently in the middle of wave (g) of the diametric pattern.
This wave is moving towards 59,000

CHAMBAL FERTILIZERS FOR SWING TRADECHAMBAL FERTILIZERS a good opportunity for swing trade plan, entry and exit point mention, add your watchlist and observe.
This is for Education purpose only...

#NIFTY Intraday Support and Resistance Levels - 10/06/2025Nifty is opening with a gap-up near the 25250 level, approaching a crucial resistance zone. This area has previously acted as a turning point, and today's opening could define whether bulls retain control or face exhaustion.
If Nifty sustains above 25250, we can expect further upside momentum toward 25350, 25400, and 25450+. A clean breakout above this level could open the path to short-term bullish continuation.
However, if the index struggles to hold above 25250 and reverses, profit booking may kick in, pulling the index back toward 25150, 25100, and even 25050.
Holding above 25050–25100 will be key for maintaining a positive structure. A breakdown below this zone may shift sentiment in favor of bears.

10 june Nifty50 brekout and Breakdown leval
🔼 Call Option (CE) Buy Levels:
Above 25,030 (Risky Zone)
"10m hold CE by RISKY ZONE"
Above 25,190 (Positive Trade View Zone)
Confirm bullishness and enter CE trades cautiously.
25,270"Above 10m hold CE by zone" – Strong confirmation.
25,390"Above 10m Closing Shot cover Possible" – Higher breakout level.
🔽 Put Option (PE) Buy Levels:
Below 25,030
"Below 10m hold PE by Zone"
Below 25,190
"Below nigetive trade view" – Sentiment turning bearish.
25,270 Below 10m PE by Risky Zone" – Confirmation of downward pressure.
Below 25,390 10m PE By Safe Zone" – Strong PE entry.
✅ Extra Key Zones:
Opening Support: 25,070
Opening Resistance: 25,030
CE Safe Zone: Above 24,970
Below 24,970: Possible unwinding (strong downside)

Nifty Daily Trend AnaysisMy Observation:
Nifty Spot had been consolidating within a range for 16 consecutive trading sessions. Today, it broke out decisively and is now trading above that range. If it sustains this breakout, it indicates bullish momentum and the index could potentially rally towards the targets of 25,800 and 26,500.
However, if the market slips back into the previous range, I anticipate support around 24,600—although this scenario seems less likely given the strength of today’s breakout.
Disclaimer: This is purely my personal view and is shared for educational purposes only. Please do your own analysis before making any trading decisions.

#NIFTY Intraday Support and Resistance Levels - 09/06/2025Nifty is opening with a gap-up above the 25050 level, continuing the recent bullish momentum. The index has broken out of its previous range and is now hovering near a key breakout zone.
If Nifty sustains above 25050–25100, we could see further upside toward 25150, 25200, and 25250+. A clean breakout above 25250 may unlock extended targets at 25350, 25400, and 25450+.
However, if the index fails to hold above 25000 and slips back below 24950, it could lead to a short-term pullback. In that case, expect downside toward 24850, 24800, and 24750.

9 june Nifty50 brekout and Breakdown leval
🔵 Call (CE) Buy Levels:
24,768 – Above 10m hold CE by Risky Zone
25,122 –Above 10m hold CE Zone
25,290 – Above 10m hold CE by Zone
25,490 – Above 10m closing, short covering possible
🔴 Put (PE) Buy Levels:
25,290 – Below 10m PE by Risky Zone
25,490 – Below 10m PE by Safe Zone
24,768 – Below 10m hold PE by Zone
🟢 Other Key Zones:
24,530 – CE by Safe Zone
➤ Below this: Unwinding Possible
25,122 – Above: Positive Trade View
➤ Below: Negative Trade View

NIFTY 50 Long term Analysis I had a VIew in September 2024 that NIfty Should Fall from Its Life time HIgh to the levels of 22000 which is a strong Support and Monthly EMI 20 in Sept 2024 was nearing 22000 levels.
Now as nifty has taken support from 22000 and have relied till 25000 now. in HTF it is sideways. Important levels above is 25250 and then 26000 (LTH) and on lower side 24000 & 22000.
US after trump is very volatile and now after trump and elon musk issue and off course trade war with mostly china may drive the US market down as it is already overvalued and effects could be seen here in India market
Market Cap to GDP ratio of US (190%) & India (125%) is very High Still.
Nifty 50 analysis :
If Nifty from here if breaks 25250 level and sustain there it will face resistance @ 26000 (LTF) and if it is able to break it and sustain over it. It should zoom to 30000 levels in next 10-12 months
if nifty is not able to hold 25250 and gets rejection from here it should get it support @ 24000 but if it is not able to hold on to it. The Next Level will be 22000 again which is a very strong support but it is been tested already twice.
I have view here that Economic Conditions, US Market, Wars & Other Factors if not favourble at that time Nifty can Test 19500 Levels and curruntly 3 Month EMA 20 also is Calling the market to hand shake once @ 19500 Very Strong 3 Months Demand Zone.
This should also take 10-12 months from here.
Lets see where nifty 50 takes us 30000 or 19500.
;)

$NIFTY: New highs incoming; 27500 can be cycle highsNSE:NIFTY the index from India which holds the top 50 stocks in India. IN the chart below we have overlayed the SP:SPX index. The NSE:NIFTY and $S&P500 have been in lockstep for more than 5 years as shown in the chart below. The indices are just 2.5% away from their ATH. Even with these levels the RSI for NSE:NIFTY is 61 and 58 in case of $SPX.
The RSI is far from overbought condition. So, this rally which started in NSE:NIFTY can have more legs. With Global liquidity on the rise and RBI easing policy rates the NSE:NIFTY can reach its all-previous highs of the Fib retracement levels. The previous peak was 0.786 Fib retracement level which on this upward sloping chart can be as high as 27500 which can indicate another 10% upside.
Verdict : Stay long $NIFTY. More upside possible. RSI still not overbought.

Nifty50 Index MovementNSE:NIFTY Index is indicating an Upward Movement. The Rectangular Pattern needs to be broken and move upwards which is what is expected. We could soon expect 26k Range.
More over, if the RBI Moneytary policy today make any rate cut, this will accelerate the Movement.
This is truely for Educational Purpose and if the graph goes as expected we can expect good movement for Nifty 50 stocks Primarily.
#NIFTY Intraday Support and Resistance Levels - 06/06/2025Nifty is opening with a slight gap-up around 24750–24760, placing it just above a key resistance-turned-support level. This setup suggests early optimism, but follow-through momentum is crucial for confirmation.
If Nifty sustains above 24800, it may pave the way for a smooth upside toward 24850, 24900, and 24950+. This range could act as a momentum zone for intraday buyers if volume supports the move.
On the flip side, a slip back below 24700 may signal weakness and open downside targets at 24650, 24600, and 24550, pulling Nifty back into a broader consolidation range.

6 June Nifty breakout & breakdown levels
🔼 CALL (CE) Buy Levels :
24,680 (Opening Support Zone)
CE entry possible if price10m holds above this level.
24,923 (Above Positive Trade View)
Strong bullish sentiment above this zone.
Buy CE if 10-min candle holds above this level.
24518 (Above 10m hold ce by level) bullish momentum
🔽 PUT (PE) Buy Levels:
24,680 (Opening below Resistance Zone)
Below 24,518 (Below 10m Hold PE by Zone)
Below 25,130 (Below 10m PE by Risky Zone)
Risky but possible PE buy if fails to hold
Below 25,330 (Below 10m hold PE by Safe Zone)

nifty rangeHere’s a professional and engaging **TradingView post description** for a **Nifty range-bound market** scenario:
---
📊 **Nifty Index – Range-Bound Consolidation Ahead?** 🧭
Nifty is currently trading within a defined range, indicating indecision in the market. The index is facing resistance near **25000** and finding support around **24500**.
📌 **Key Observations:**
* Price action suggests a sideways trend with no clear breakout yet.
* Volumes are relatively lower, reinforcing the consolidation phase.
🛑 **Resistance:** 25000
✅ **Support:** 24500
🔍 A breakout on either side could trigger the next directional move. Until then, traders should focus on **range-bound strategies** like buying near support and selling near resistance, with tight stop-losses.
💬 What’s your view on Nifty's next move? Drop your analysis in the comments!
\#Nifty50 #NiftyAnalysis #NiftyRange #StockMarketIndia #TradingView #TechnicalAnalysis #NiftyOutlook #NSEIndia #BankNifty #PriceAction #NiftyLevels

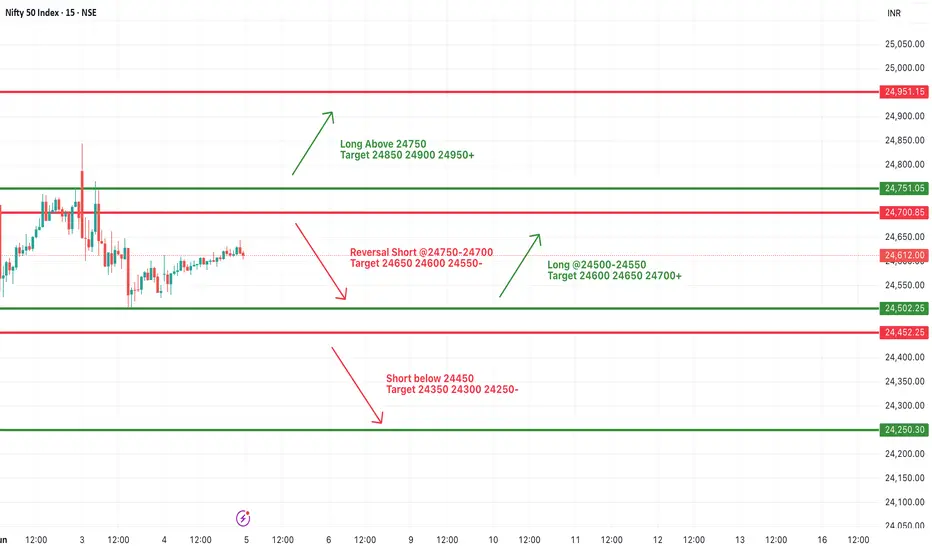
#NIFTY Intraday Support and Resistance Levels - 05/06/2025Nifty is opening with a gap-up near the 24750 level, placing it right at the breakout zone. If the index sustains above 24750, a bullish rally may follow with upside targets of 24850, 24900, and 24950+. Sustained momentum above this level can shift market sentiment toward a more positive bias.
However, traders should be cautious of a reversal from the 24750–24700 zone. If the index fails to hold and reverses downward, a short trade setup could be considered with downside targets of 24650, 24600, and 24550.
In case of further weakness below 24450, the trend may extend on the downside with targets at 24350, 24300, and 24250.
This is a critical level to watch. Wait for a decisive breakout above 24750 or a reversal signal before taking directional trades. Use strict stop-loss and manage positions actively, especially in early session volatility.
5 june Nifty50 brekout & break down level
🔼 Call Option (CE) Trade Levels:
25,118 – Above 10m Closing → Short covering possible (Bullish breakout zone)
24,918 – Above 10m Hold → CE by zone (Bullish confirmation zone)
24,437.70 – 10m Hold → CE by risky zone (Uncertain upside attempt)
24,268 – CE by safe zone (Good support; possible long build-up)
🔽 Put Option (PE) Trade Levels:
25,118 – Below 10m → PE by safe zone (Bearish rejection from breakout)
24,918 – Below 10m → PE by risky zone
24,420 – Below 10m Hold → PE by zone (Bearish confirmation)
Below 24,268 – Unwinding possible (Breakdown leval)
📊 Neutral / Trade View Levels:
24,732 – Above this → Positive trade view
24,700 zone – Below this → Negative trade view
24,570 –flat Opening support
24,570 –gap down Opening resistance zone
