4 June Nifty50 best trading zone#Nifty50 #option trading
🚀 If you like my trading plan and levels, don't forget to boost the post
99% working trading plan
👉Gap up open 24640 above & 15m hold after positive trade target 24840, 25033
👉Gap up open 24640 below 15m not break upside after nigetive trade target 24390 , 24220
👉Gap down open 24390 above 15m hold after positive trade target 24640
👉Gap down open 24390 below 15m not break upside after nigetive trade target 24220, 24090
📌 Trade plan for education purpose I'm not responsible your trade
More education follow social media and boost my idea
📌 koi bhi trade leval se 20 point ke sl ke bhina karan nahi hi
📌 koi trade app activate tabhi karana hota hi level pe 2 candle uper ya niche closing aati hai to
📌 leval par Ane pe turant trade plan na kare ...
📌 Full risk apaki hi hi meri nahi
Niftyprediction

Today 3june 2025 nifty prediction and trade plan 🔼 Upside Scenario (Bullish Bias)
Above 24,820:
➤ "Above positive trade view" zone → Bullish momentum expected.
➤ Target Zone: 24,930
➤ Further target: 25,128
(Strong resistance & short-cover possible).
Above 25,128:
➤ Strong breakout area → Possible aggressive short covering.
➤ Bullish continuation possible if it sustains above this level.
🔽 Downside Scenario (Bearish Bias)
Below 24,630:
➤ Breaks opening support.
➤ Next support: 24,538 → Opening resistance turned into potential support.
Below 24,534 – 24,518:
➤ Enters PE (Put Entry) zone.
➤ Weakness increases below 24,516 → Safe zone for PE traders.
➤ Final bear trigger: Below 24,397 → Unwinding possible.
➤ Target zone for heavy downside: 24,300–24,200.
🟡 Sideways / Choppy Zone
Between 24,630 to 24,820:
➤ No clear trend unless breakout.
➤ Stay cautious → scalp only at levels.
📣 Summary View:
Trend Trigger Level Target Range
Bullish Above 24,820 24,930 → 25,128+
Bearish Below 24,630 24,534 → 24,397 → 24,300
Sideways 24,630 – 24,820 Wait for breakout

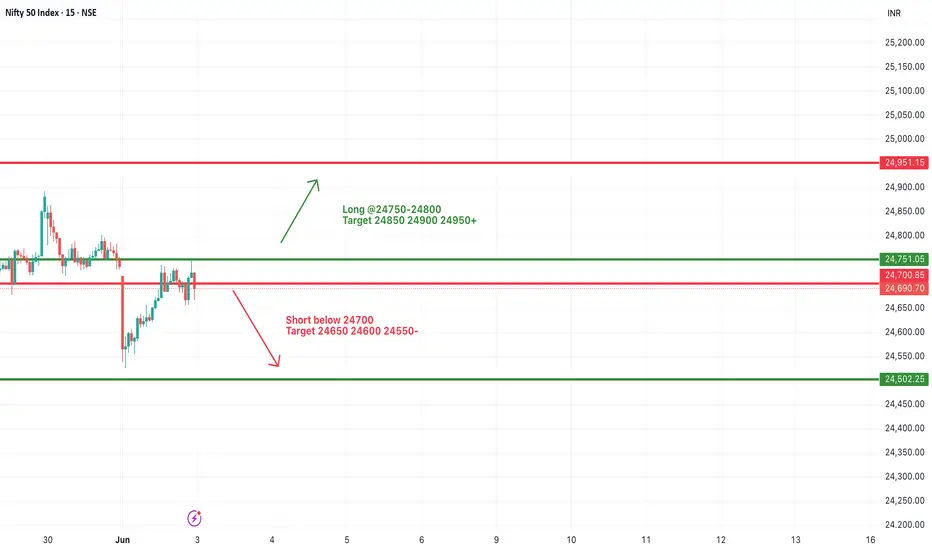
#NIFTY Intraday Support and Resistance Levels - 03/06/2025Nifty is expected to open flat near the 24700 mark, continuing its sideways trend from previous sessions. The index is currently hovering just below the key resistance zone of 24750–24800. A breakout above this level can trigger bullish momentum with upside targets of 24850, 24900, and 24950+. Sustained strength may push the index further toward the 25000–25050 area.
However, if Nifty fails to hold and breaks below 24700, it could lead to bearish pressure. A confirmed breakdown may open downside targets of 24650, 24600, and 24550. Further decline could test the next major support at 24500–24450 levels.
As the market remains range-bound, traders are advised to wait for breakout confirmation with strict stop-loss. Watch for volume and momentum near breakout zones to avoid false signals.
3 june Nifty prediction #Nifty50 #option trading
99% working trading plan
✅ Gap-Up Opening Strategy
🔹 If Nifty opens above 24,860 and hold for 15 mins:
📈 Bullish Trade
🎯 Targets: 24,970
🔹 If Nifty opens at 24,860 but fails to break above after 15 mins:
📉 Bearish Trade
🎯 Targets: 24,670 → 24,560
✅ Gap-Down Opening Strategy
🔹 If Nifty opens above 24,670 and hold for 15 mins:
📈 Bullish Trade
🎯 Targets: 24,860 → 24,970
🔹 If Nifty opens below 24,670 and fails to break above after 15 mins:
📉 Bearish Trade
🎯 Target: 24,560
🎓 For more educational content, follow & support me!
📈 TradingView ID: @mayuraj_820

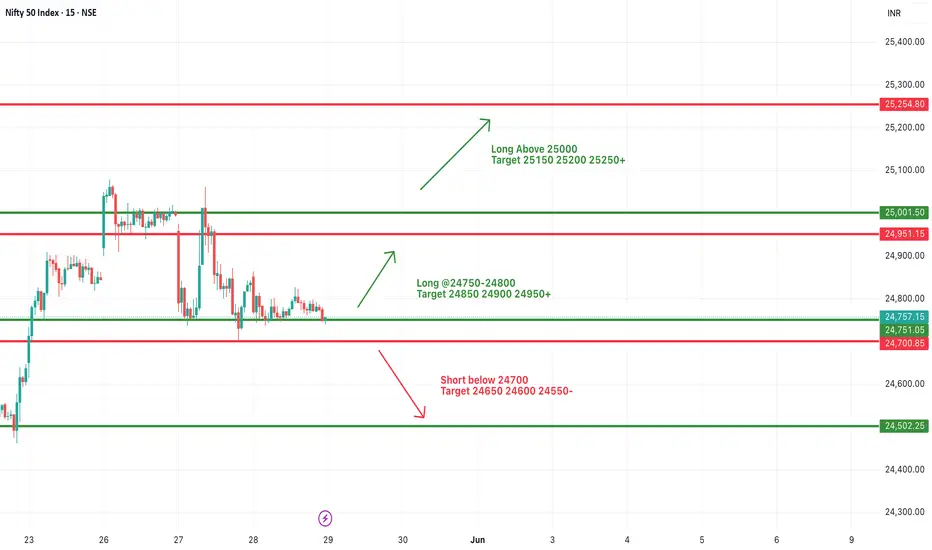
#NIFTY Intraday Support and Resistance Levels - 02/06/2025Nifty is expected to open flat near the 24700–24750 zone. The index has been consolidating in a tight range over the past few sessions, indicating indecision and a potential breakout on either side.
If Nifty sustains above the 24750–24800 zone, a bullish breakout may unfold with upside targets of 24850, 24900, and 24950+. A clear move above 25000 will confirm strong buying momentum with extended targets of 25150, 25200, and 25250+.
On the downside, if Nifty breaks below 24700 and fails to recover, fresh selling pressure could drag the index toward 24650, 24600, and 24550.

#NIFTY Intraday Support and Resistance Levels - 30/05/2025Nifty is expected to open flat around the 24800–24850 range. The market has shown signs of recovery from lower levels, and if it manages to hold above the 24800–24850 support zone, we can expect a continuation of upward momentum. In that case, possible intraday upside targets are 24900, 24950, and a breakout beyond 25000 could extend the rally toward 25150, 25200, and 25250+ levels.
However, if Nifty fails to sustain above 24800 and faces resistance near 24900–24950, a pullback may occur. A confirmed breakdown below 24700 would signal weakness and could trigger a fresh round of selling. In such a scenario, downside targets would be 24650, 24600, and possibly 24550.
Today’s session may start off sideways with consolidation between key levels. Wait for clear confirmation above 24850 for longs or below 24700 for shorts. Keep trailing your stop-loss and book partial profits near every target zone.

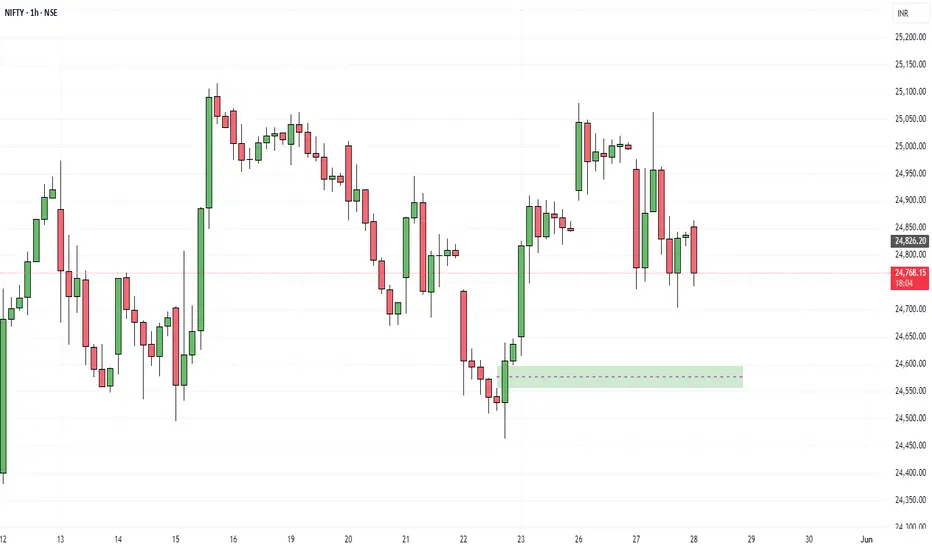
My Recent Trade In Nifty 50 ... On 1 hour time frame nifty is coming to get liquidity on FVG drew here.. after it may go to 25,000. let's see what happens...

#NIFTY Intraday Support and Resistance Levels - 29/05/2025Today, Nifty is expected to open flat near the 24750 level. If it sustains above the 24750–24800 zone, a bullish move is possible with upside targets at 24850, 24900, and 24950+.
Further rally may be seen if Nifty breaks above the 25000 level, aiming for extended targets of 25150, 25200, and 25250+.
On the downside, if Nifty slips below 24700, a bearish trend may unfold with downside targets at 24650, 24600, and 24550.
NIFTY 50
1. Ascending Channel:
Nifty is trending within a clear upward (ascending) channel, indicating a bullish trend as long as the price stays within this channel.
2. Support & Resistance:
There is a strong support zone in the range of 24,000–24,200, highlighted by a red-shaded area on the chart.
The current level (24,752.45) is near the middle of the channel and showing signs of minor correction.
3. Two Possible Scenarios (Arrows):
Scenario 1: From the current level, the market could move towards the upper boundary of the channel (around 25,500–26,000).
Scenario 2: There could be a short-term correction (downward movement) first, followed by a bounce from the support zone and then an upward move.
If you find this helpful and want more FREE forecasts in TradingView, Hit the 'BOOST' button
Drop some feedback in the comments below! (e.g., What did you find most useful?
How can we improve?)
Your support is appreciated!
Now, it's your turn!
Be sure to leave a comment; let us know how you see this opportunity and forecast.
Have a successful week
DISCLAIMER: I am NOT a SEBI registered advisor or a financial adviser. All the views are for educational purpose only

Nifty Analysis EOD – May 28, 2025 – Wednesday🟢 Nifty Analysis EOD – May 28, 2025 – Wednesday 🔴
Consolidation at the bottom—ready to blast? Or more of the same tomorrow?
📊 Nifty Summary:
Nifty opened mildly higher at 24,832.50, only to spend the entire session grinding within a narrow 127-point range. Most of the action stayed trapped in a 60-point box, giving day traders a frustratingly sideways experience. Attempts to break the range failed, and the index closed at the day's lower edge, continuing the consolidation near key support zones.
🔍 Intraday Walk:
Nifty opened with a small positive bias but failed to find follow-through.
For the major part of the day, price action remained boxed in a tight range—ideal only for scalpers and option writers.
An attempted breakout was seen, but the index quickly fell back into the consolidation zone.
Triangle breakout on 5-min chart came late (3:00 PM), with no time for validation.
Closed near day’s low at 24,752.45, just above crucial support.
🛡 5 Min Chart with Patterns
🛡 5 Min Chart with Patterns and Levels
🔎 Chart Observations:
🔸 Mini M-Pattern formed twice on 5-min chart at key level—adds to bearish caution.
🔸 Box consolidation zone repeated from yesterday’s range.
🔸 Symmetrical Triangle seen on 5-min chart broke on the downside at 15:00—too late to act but worth noting.
🔸 Yesterday’s low stayed protected, though price closed weak.
🔸 Volatility dried up ahead of monthly expiry—expect positioning tomorrow.
🕯 Daily Time Frame Chart
📉 Daily Candle Breakdown:
Open: 24,832.50
High: 24,864.25
Low: 24,737.05
Close: 24,752.45
Change: −73.75 (−0.30%)
Candle Structure:
Real Body: 80.05 pts (Red candle)
Upper Wick: 31.75 pts
Lower Wick: 15.40 pts
Interpretation:
Small-bodied candle with short wicks on both ends—a Bearish Spinning Top, hinting at indecision but with a slight bearish bias.
Inside Bar formation – breakout watch on either side.
🧠 Key Insight:
The market is digesting the recent downside with sideways consolidation. If bulls fail to protect 24,700, deeper cuts could follow. On the flip side, a break above 24,882 could trigger short-covering ahead of expiry.
🛡 5 Min Intraday Chart
⚔️ Gladiator Strategy Update:
ATR: 299.84
IB Range: 121.2 → Medium
Market Structure: Balanced
Total Trades: 0
❌ No valid triggers today – system stayed out due to tight range and lack of momentum.
📌 Support & Resistance Levels:
🔺 Resistance Zones:
24,768 ~ 24,820
24,882
24,894
24,920
24,972 ~ 25,000
25,062 ~ 25,070 (Rejected for 5th time!)
25,116 ~ 25,128
25,180 ~ 25,212
25,285 ~ 25,399
🔻 Support Zones:
24,737 ~ 24,727
24,700
24,660
24,640 ~ 24,625
24,590
24,530 ~ 24,480
24,460
🔮 What’s Next?
Scenario 1 – Breakdown:If 24,700 breaks and sustains, Nifty may head towards 24,589 → 24,500 → 24,461.
Scenario 2 – Breakout:If 24,882 breaks and sustains, Nifty can test 24,920 → 24,972 → 25,000 → 25,065 → 25,116 → 25,180.
📍 Most probable scenario:Expecting a range-bound day between 24,660 and 24,882, typical of Monthly expiry sessions. However, if short covering triggers, the day could flip into a trend day.
⛔ Caution: Tomorrow is a tricky expiry day—stay nimble, follow strategy, and respect levels!
🧘 Final Thoughts:
"The calm before the storm often wears the mask of boredom. When the market sleeps, prepare for the wake-up call."
✏️ Disclaimer:This is just my personal viewpoint. Always consult your financial advisor before taking any action.

Important Level For Nifty.Here in one hour time frame nifty is coming to get some liquidity as you can see, after getting liquidity nifty may again go higher and make a new high.
#NIFTY Intraday Support and Resistance Levels - 28/05/2025Today, Nifty is expected to open flat near the 24800–24850 zone. If it sustains above 24800–24750, a bullish move is possible toward 24850, 24900, and 24950+.
Further momentum may be seen if Nifty breaks and holds above 25000, targeting 25150, 25200, and 25250+.
On the downside, if Nifty fails to hold above 24950–24900 and starts slipping below this zone, short trades can be considered with targets of 24850, 24800, and 24750.
A breakdown below 24700 may accelerate selling pressure, leading to extended downside targets of 24650, 24600, and 24550.
Expect choppy moves near key levels — trade with a defined stop loss and lock in profits at each stage.

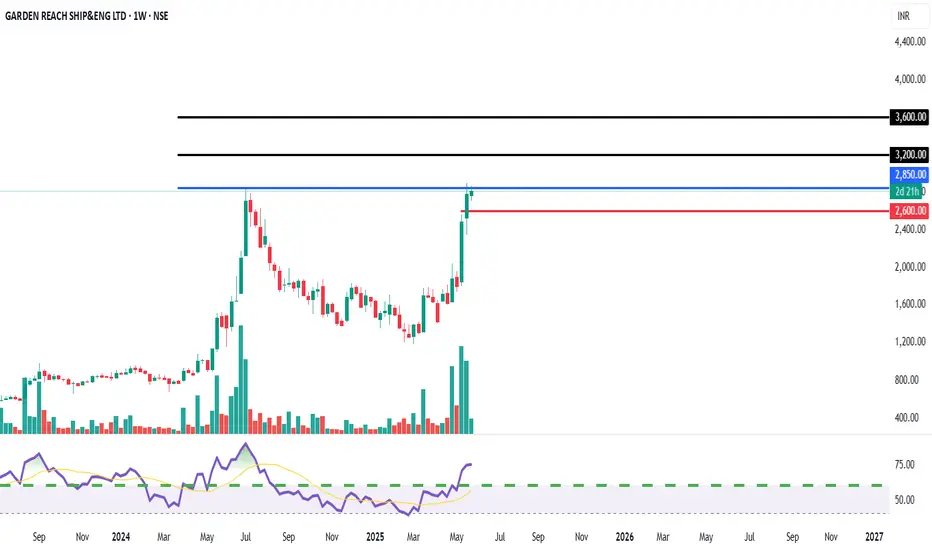
GARDEN REACH SHIPBUILDERS: Breakout Potential - Watch for EntryEntry Price:
Aggressive / Risk-Takers: Await a clear weekly close above ₹2,850, with sustained high volumes. Entry around ₹2,850-₹2,900.
Target Price 1 (T1): ₹3,200 (Based on previous highs and extension)
Target Price 2 (T2): ₹3,600 (Based on Fibonacci extensions and chart patterns)
Stop Loss (SL): ₹2,600 (Closing basis below immediate support, previous resistance)
DISCLAIMER
This report is prepared for informational purposes only and is not intended as a solicitation or an offer to buy or sell any securities. The information contained herein is based on technical analysis and publicly available data, which are believed to be reliable, but no guarantee is made as to their accuracy or completeness. Investing in equities involves risks, and investors should conduct their own due diligence and consult with a financial advisor before making any investment decisions. Past performance is not indicative of future results.
#NIFTY Intraday Support and Resistance Levels - 27/05/2025Today, Nifty is expected to open flat near the 25000 level. If it sustains above 25000, we may see bullish momentum toward 25150, 25200, and 25250+. This level is a key breakout zone for further upside.
However, if Nifty fails to hold above 25000 and starts trading below the 24950–24900 zone, a short trade setup may trigger with downside targets of 24850, 24800, and 24750.
Further weakness will be confirmed only if Nifty breaks below 24750–24700, possibly extending the downside to 24600 and 24550.

Nifty50 Market Update – Resistance AlertMy proprietary option pricing model, OptionSigma , identifies 25,200 as a key resistance level in the Nifty50 Index. Until this barrier is decisively broken, I won’t adopt a bullish stance.
🚨 Disclaimer: This is not a trade recommendation. Always conduct thorough research before making any trading decisions.
#nifty

Personal Trade Plan – Nifty50 25100 June Call OptionToday, I entered a long position in the Nifty50 25100 June (Monthly) Call option , securing an average price of ₹469.10 . I plan to accumulate additional lots at lower prices, with a strategy to hold until expiry.
📌 Disclaimer: This is not a trade recommendation. Please conduct independent research and assess risk factors before making any trading decisions.
#nifty50

NIFTYi Observed these Levels based on Price Action and Demand & Supply which is my own Concept "PENDAM CONCEPTS"... Please don't take any trades based on this chart/post... Because this chart is for educational purpose only not for Buy or Sell Recommendation... Thank Q

Next Target for #kalyankjil Is 594-600 KALYAN JEWELLERS Might give us this target till 6th june. as it's showing good volume and price action to fulfill our needs. hope for the best

Equity Research Flash – BEML Ltd.CMP: ₹3,242.10 | Breakout From Falling Trendline
BEML has decisively broken out of a falling trendline and is now sustaining above a key consolidation zone. With strong bullish candles, a rising RSI, and healthy volume spike, the stock signals bullish momentum. Immediate resistance lies at ₹3,420–₹3,480. Sustained move above could target ₹3,750+. 20/50 EMA crossover supports the upward trend. Traders may consider entries on dips with SL near ₹3,080.
For educational purposes only

#NIFTY Intraday Support and Resistance Levels - 26/05/2025Today, Nifty is expected to open with a gap-up near the 24950 level. If it sustains above the 24950–25000 zone, it can lead to bullish momentum with upside targets of 25150, 25200, and 25250+. A breakout above 25000 will act as a strong confirmation for further rally.
However, if Nifty fails to sustain above 24950 and slips below the 24900–24850 zone, a short trade opportunity may emerge with downside targets at 24800 and 24750.
Further weakness will be confirmed only if it breaks below 24700, which may drag the index down to 24600, 24550, and 24500.

NIFTY : Trading levels and plan for 26-May-2025📊 Nifty Trading Plan – 26-May-2025
Timeframe: 15 Min | Reference Spot Price: 24,845
Gap Opening Threshold: 100+ Points
🚀 Gap-Up Opening (Above 24,974) – 100+ Points
If Nifty opens above the Opening Resistance level of 24,974, it enters a critical resistance zone that may trigger two-sided moves. The area between 25,195 – 25,294 is marked as the Profit Booking Zone / Last Intraday Resistance .
🟥 This zone has historically seen supply, and sharp up-moves may get trapped without strength in broader participation.
✅ Plan of Action:
– Avoid initiating long trades immediately post gap-up unless price shows strong bullish candles above 25,195.
– For intraday buying, wait for a clean 15-min candle close above 25,294 with strength in heavyweights.
– Ideal entry would be on a retest of the 25,195–25,294 zone if price holds.
– Reversal patterns (like Shooting Star / Bearish Engulfing) near 25,195 – 25,294 can offer sell-on-rise opportunities toward 24,974, then 24,845.
– Watch for volume confirmation – avoid shorting just because price is high.
🎓 Educational Note: Gap-ups into strong resistance zones require caution. Momentum without volume and market-wide confirmation often leads to failed breakouts. Let structure confirm before jumping in.
📈 Flat Opening (Between 24,790 – 24,974)
This places Nifty inside the No Trade Zone defined between 24,790 – 24,974.
🟧 This range is uncertain – the index may move sideways with choppy price action and lack of conviction from buyers or sellers.
✅ Plan of Action:
– Stay on the sidelines in the first 15–30 mins.
– Only consider long trades if price breaks and sustains above 24,974, then aim for 25,195 – 25,294.
– For short trades, wait for a clean breakdown below 24,790 with a bearish candle close to ride down to 24,684 and then 24,558.
– Risk reward is best outside this zone, not inside. Patience is key.
🎓 Educational Note: Flat openings in mid-range zones often cause emotional trades. Use this time to assess volume trends, sectoral strength, and structure. Most clean entries happen post-10:15 AM.
📉 Gap-Down Opening (Below 24,684) – 100+ Points
A gap-down below 24,684 pushes Nifty near its immediate supports at 24,558 (Last Intraday Support) and 24,250 – 24,190 (Buyer’s Zone).
🟩 This is a sensitive area where smart money may attempt reversals, especially near 24,250 – 24,190.
✅ Plan of Action:
– Watch for reversal signs (Hammer, Bullish Engulfing) around 24,558 and especially in the Buyer’s Support Zone: 24,250 – 24,190.
– If price finds footing and sustains above 24,558, reversal trades can be initiated with a target back to 24,684 – 24,790.
– A strong breakdown below 24,190 would confirm bearishness – in that case, avoid catching falling knives.
– Only go short below 24,190 on breakdown candle with next target open toward swing lows.
🎓 Educational Note: Gap-downs into major demand areas offer some of the best R:R setups—but only if there's evidence of absorption and reversal structure. Never go long just because price is “low”.
🛡️ Options Trading – Risk Management Tips
✅ Use slightly In-the-Money (ITM) options for better delta movement and less time decay.
✅ Avoid trading in No Trade Zones; theta will eat up your premiums.
✅ Follow the 1–2% capital risk rule – don’t over-leverage in anticipation of a breakout.
✅ Always define your stop loss using the underlying spot level, not just option premium.
✅ Book partial profits once price moves in favor and trail SL for the rest.
✅ If you hit 2 stop-losses in a row, take a break and re-assess the trend.
✅ Monitor OI data and sectoral strength—don’t blindly follow index candles.
📌 Summary & Conclusion
🔹 No Trade Zone: 24,790 – 24,974
🔹 Profit Booking / Resistance Zone: 25,195 – 25,294
🔹 Opening Supports: 24,684 & 24,558
🔹 Strong Buyer’s Support: 24,250 – 24,190
📈 For Gap-Ups, avoid early longs into resistance zones unless breakout is confirmed.
📉 For Gap-Downs, prepare for potential reversal from Buyer’s Support Zone.
🕒 In Flat Openings, wait 15–30 mins to avoid whipsaws inside No Trade Zone.
⚖️ Best trades occur outside the No Trade Zone with price + structure + volume alignment.
⚠️ Disclaimer:
I am not a SEBI-registered analyst. This trading plan is purely for educational purposes. Please conduct your own analysis or consult a SEBI-registered advisor before taking trades.

Nifty50 – Wave IV Unfolding Within the Grand SupercycleFrom the Grand Supercycle perspective on the monthly chart, we can observe a consistent pattern — every major a-b-c corrective phase has unfolded as a form of flat correction before the next rally. Based on this historical rhythm, and the current market structure, I believe we are still in the process of completing Wave V of the Grand Supercycle.
This long-term view is overlayed on the chart to help contextualize what’s happening now.
Zooming In – The Weekly Breakdown Within Wave IV and V:
Within this broader Grand Supercycle, the weekly chart captures a five-wave subdivision between Supercycle’s Wave IV and the yet-to-be-completed Wave V.
Wave III has completed after achieving a 100% projection of Wave I from Wave II , respecting classic Fibonacci symmetry.
After the Wave III high, we’ve entered a correction phase , where sub-wave b is currently unfolding.
Flat Correction in Play?
For the current move to qualify as a Flat correction:
Wave b must retrace at least 90% of Wave a .
This requirement is crucial to maintain the “Flat” identity of the structure.
Depending on the nature of the flat:
If it’s a Regular Flat or Expanding Flat, Wave c must break below the bottom of the rising parallel channe l, and end below the low of Wave a .
If it’s a Running Flat , Wave c can stay above Wave a’s low, and price may remain within or near the channel’s lower boundary.
Also, as per EW guidelines, Wave c must unfold in 5 waves — which will be the next key structure to monitor.
Where Are We Now?
As long as Wave b is progressing toward 90% retracement , the near-term bias remains bullish.
But once Wave b completes, the market may enter Wave c, which could result in a deeper correction — either towards the lower end of the channel or even below, depending on which flat structure plays out.
What Next?
This unfolding Wave c will likely complete Wave IV within the Grand Supercycle, setting the stage for the final upward move — Wave V of both the internal 5-wave structure and the Grand Supercycle itself.
Disclaimer: This is not a buy or sell recommendation. The analysis shared is purely my personal view for educational purposes only.

Nifty May Touch 25,500 and the FALL......NIfty may go to collect pending stoploss and orders resting above 25000 and after trapping bulls and bears together it may fall to level 24700 within a month.
