Learning#04 : PDH & PDL🎯 Learning#04 : PDH & PDL
- The 2 Levels Every Intraday Trader Must Watch
Turn Yesterday’s Levels into Today’s Profits – PDH/PDL Playbook
In intraday trading, simplicity often beats complexity.
You don’t always need fancy indicators, dozens of lines, or complicated systems. Sometimes, two levels are all it takes to stay in sync with the market:
👉 Previous Day’s High (PDH)
👉 Previous Day’s Low (PDL)
These levels may look basic, but they carry psychological weight and often mark where real action — and opportunity — unfolds.
Let’s break it down into a practical strategy you can start using as early as tomorrow morning 👇
🧠 What Are PDH and PDL?
PDH = The highest price the market reached yesterday
PDL = The lowest price the market reached yesterday
That’s it. No calculations. No indicators. Just two simple levels from the previous session.
But here’s why they matter:
They’re visible to everyone — retail traders, institutional desks, even algo systems. These are “memory zones” where the market often reacts — bouncing, breaking, or trapping traders in fakeouts.
Think of them as psychological boundaries.
When price approaches these levels, traders ask:
“Will it break or bounce?”
That hesitation — that moment of decision — is your opportunity.
⚡ Why These Levels Work So Well
✅ They’re objective — no subjectivity involved. Anyone can mark them.
✅ They’re reaction zones — price often stalls, breaks, or rejects here.
✅ They reflect sentiment — how price behaves around them reveals market strength or weakness.
PDH and PDL often act like turning points — or springboards for continuation. The key is in reading how price behaves when it gets there.
📊 3 Smart Ways to Trade Around PDH/PDL
Let’s look at three powerful setups based on how price behaves near these levels:
1️⃣ Rejection at PDH or PDL (Classic Reversal)
This is the simplest setup — and one of the most effective.
When price tests PDH or PDL but fails to break, it often leaves signs:
Long upper/lower wicks
Rejection candles (like pin bars or inside bars)
Sudden volume drop
💡 Example:
Nifty rallies to PDH at 22,180, prints a long upper wick, then forms a red candle closing below. That’s a reversal clue.
You could enter short below the rejection candle, with a stop just above the high and a target near VWAP or mid-range.
🎯 Why this setup works: Tight risk. Logical context. High clarity.
2️⃣ Breakout and Retest (Trend Continuation)
If price breaks through PDH/PDL with strength, don’t chase it.
Wait for price to pull back and retest the level.
If PDH was broken, wait for a bullish retest — former resistance becomes support.
If PDL was broken, wait for a bearish retest — former support becomes resistance.
💡 Example:
BankNifty breaks PDH, pulls back, then prints a bullish engulfing candle right at the level — confirmation to go long.
📌 This setup works best on trending days and offers cleaner entries than chasing breakouts.
3️⃣ The Failed Breakout (Trap Setup)
One of the most high-probability setups — and one that traps many.
Here’s how it plays out:
Price breaks PDH/PDL
But immediately snaps back inside the range
Traders who chased the breakout are now trapped
💡 Signal to watch:
A candle closes above PDH, followed by a candle that closes back below — that’s your short signal. Reverse for long setups around PDL.
🚨 Even more effective when the breakout happens on low volume — no real conviction behind the move.
🔧 Tools That Amplify These Setups
These setups work great with a clean chart — but a few tools can boost your edge:
VWAP: Check if price is extended or supported near PDH/PDL. When VWAP aligns with these levels — confluence zone!
Candlestick patterns: Look for pin bars, inside bars, or engulfing patterns at the level.
Opening range: If price breaks PDH/PDL early in the day,
especially within the first 30 minutes, it signals directional intent.
Volume: Strong breakouts need volume. Weak volume = likely fakeout.
🔑 Remember: You don’t trade the level — you trade the reaction at the level.
✅ Why This Simple Strategy Works
Don’t underestimate the power of PDH and PDL. These levels:
Show where emotions exist — greed and fear often play out here.
Create natural reaction zones — ideal spots for clean entries and exits.
Let you trade with structure, not guesswork.
Instead of chasing price all day, do this:
Mark PDH and PDL
Wait for price to approach the zone
Watch how it behaves
React with a plan — not emotion
✨ Simple, repeatable, and highly effective — if you stay patient and disciplined.
✍️ Final Thoughts
In a world full of overcomplicated strategies, PDH/PDL trading is a refreshing reminder that clarity often comes from simplicity.
These levels won’t give you 10 trades a day — but they will give you high-quality, context-driven opportunities that align with how real price and volume work.
See you in the next one — and until then:
Keep it simple. Trade with structure. Trust the levels.
— Kiran Zatakia
Niftystrategy

Learning#03 : VWAP in Intraday TradingLearning#03 : VWAP in Intraday Trading
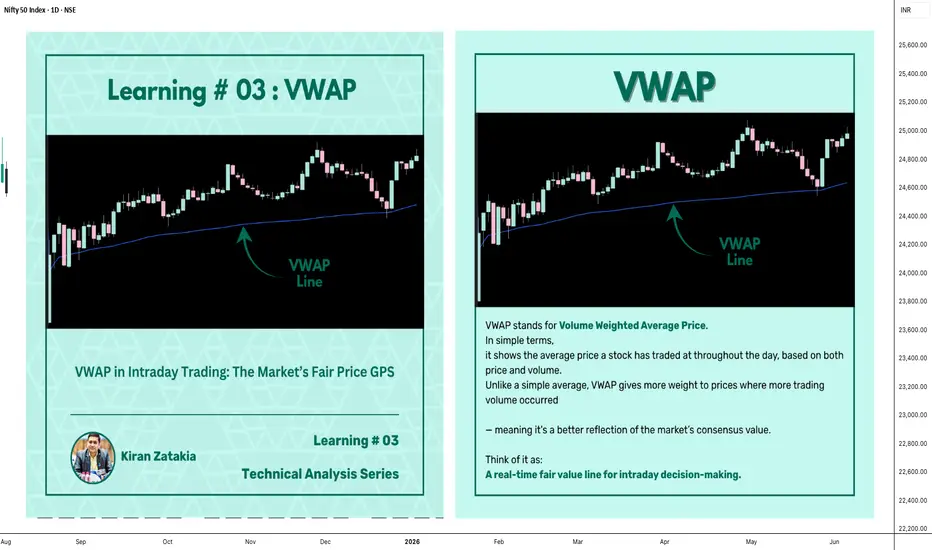
📊 VWAP in Intraday Trading: The Market’s Fair Price GPS
Ever wondered if there’s a level that shows where the real trading action is happening? That’s exactly what VWAP does — it’s like a volume-weighted compass that intraday traders use to orient themselves in the market.
It’s not just another line on your chart. VWAP reflects where institutions and volume-heavy participants are active. That’s why understanding how price interacts with it can give you a serious edge.
Let’s break it down 👇
🧠 What is VWAP?
VWAP stands for Volume Weighted Average Price.
In simple terms, it shows the average price a stock has traded at throughout the day, based on both price and volume.
Unlike a simple average, VWAP gives more weight to prices where more trading volume occurred — meaning it's a better reflection of the market’s consensus value.
Think of it as:
A real-time fair value line for intraday decision-making.
📈 Why VWAP Matters for Intraday Traders
VWAP acts as an intraday anchor. It tells you whether the price is currently trading above or below the day’s volume-weighted average — giving you quick insight into who's in control.
Here’s how to interpret it:
When price is above VWAP, buyers are in control and the bias is bullish.
When price is below VWAP, sellers are dominating and the bias is bearish.
When price is hovering near VWAP, the market is undecided, consolidating, or lacking direction.
In short, VWAP tells you who’s winning the intraday tug of war — and whether it’s even worth stepping in.
⚙️ How to Use VWAP in Your Intraday Strategy
1️⃣ VWAP as a Trend Filter
Before entering a trade, check where price is relative to VWAP:
Price above VWAP with higher lows → Focus on long setups
Price below VWAP with lower highs → Focus on short setups
🔁 Skip counter-trend trades. Stay with the flow.
This helps in trending markets by keeping you aligned with momentum.
2️⃣ VWAP as Dynamic Support or Resistance
VWAP behaves like a magnet. Price often pulls back to it and either:
Rejects (respects the level as support/resistance), or
Breaks and reclaims (signaling a potential reversal)
Use it alongside:
Flag patterns
Inside bars
Break-and-retest structures
3️⃣ VWAP Reversion Play (Snapback Trade)
This is a mean-reversion setup:
Price moves quickly away from VWAP at open
No strong follow-through, signs of exhaustion
Take a counter-trend trade back to VWAP
⚠️ Avoid this in strong trending markets — best used in choppy or fading environments.
4️⃣ VWAP with Price Action for Structure
Pair VWAP with clean price action:
Mark support and resistance zones
Observe price behavior near VWAP
Look for confirmation: inside bars, rejection wicks, engulfing candles
🎯 This adds logic and clarity to your entries — no random trades.
🔍 Bonus VWAP Tips
Combine VWAP with:
CPR (Central Pivot Range) for confluence zones
Opening range for breakout bias
Volume profile to spot high interest areas
These combos create strong, repeatable trade setups.
✅ VWAP Recap: Why It Matters
Here’s a quick breakdown of how VWAP can sharpen your intraday trading game:
Bias Building: VWAP helps confirm whether the market structure is bullish or bearish, giving you a reliable directional bias.
Trend Filtering: It keeps you aligned with the current momentum by filtering out counter-trend trades.
Pullback Entries: VWAP acts as a dynamic support or resistance level, offering clean zones to enter trades during pullbacks.
Mean Reversion: In sideways or fading markets, VWAP becomes a natural magnet — allowing you to target price reversions.
Risk Management: It provides logical reference points for placing stop-losses and defining entry zones, adding clarity to your risk-reward planning.
✍️ Final Thoughts
VWAP may sound simple, but it brings real structure to intraday trading.
It tells you where volume met price, and that’s powerful. When used with price action, it creates a solid framework for:
Building directional bias
Finding clean entries
Managing risk like a pro
VWAP doesn’t predict — it reflects. And in trading, reflection is more useful than prediction.
🛎️ Respect VWAP. Trade with structure.
— Kiran Zatakia
Navigating Volatility: Positional Strategies for MarchWork religiously irrespective of temporary failures, have risk management systems in place
As a seasoned derivatives trader with over a decade of experience, I find myself continuously drawn to the dynamic nature of the market. Inspired by familial ties and fueled by a passion for challenge, my journey into this realm began with humble internships and has evolved into a successful career within reputable broking firms. Today, I stand firm in my enthusiasm for derivatives, where each trading session offers renewed excitement and abundant opportunities for growth.
Futures and options are highly volatile so one should not assume that they know everything from day one. My journey has seen a fair amount of ups and downs, but it has all been a great learning experience at the end of the day.
The most important thing is that I have been willing to learn something new every day. I also make sure to have risk management systems in place before taking a position. This makes losses bearable and the victories more joyous.
Advice to women who want financial freedom and are very excited to enter the derivative field?
Continue working your way religiously irrespective of temporary failures. Maintain discipline and do a lot of preparation before entering the markets. Learn to embrace the fact that one bad day or one wrong trade does not define the rest of the year, if you have been disciplined.
Expect the Nifty 50 climbing above 23,000 in March after reading options data?
As per my analysis, I was looking at Nifty targets till 22,500 – 22,800 first. Any further correction or upside will be re-evaluated then.
Top two positional bets for March and why?
Since volatility is at its peak now, a good balance approach is important. Hence, my first pick would be as a defence play:
Buy Dabur India with a support at Rs 525-520 zones and look for upside targets till Rs 585/600.
Buy Glenmark Pharma with a support of Rs 920 and target of Rs 1,020/1,035.
Nifty or Bank Nifty strategy for next week?
FIIs net long position as on date is at 40 percent, which is quite steady. If it crosses 45 percent, then a strong short covering rally can come which will propel markets to a new highs and Nifty can test 23,000.
Bank Nifty is also on a strong momentum and can move towards 49,500/50,000 zones from here. We have been recommending largecap private banks and PSUs to our clients on a regular basis, and I still feel Axis Bank and SBI can see further meaningful upside from here in the March series.
The other sectors participating strongly now are chemicals, FMCG, technology, energy. So, I retain my view to go long in Tata Power, Reliance Industries, SRF, GNFC, Infosys, and Birlasoft.
For option traders, Bull Call spread on Nifty monthly expiry with 22,500 CE buy and 23,100 CE sell can be done (do not forget to keep stop losses as per risk appetite).
A Bull Call spread comprises buying one Call option with a lower strike price and simultaneously selling a Call option with a higher strike price.
Risk Management:
Stop Loss: Implementing a stop-loss strategy to mitigate potential losses in case of adverse market movements.
Position Sizing: Adhering to proper position sizing principles to ensure risk is managed effectively and in line with overall portfolio objectives.
Conclusion:
In conclusion, my journey into derivatives has been marked by challenges, opportunities, and unwavering passion. As I continue to navigate the intricacies of this dynamic realm, I remain committed to embracing the unpredictability of each trading day, knowing that therein lies the potential for continued success and growth.
Disclaimer: This trade idea is for educational purposes only and should not be construed as financial advice. Traders should conduct their own research and consult with a qualified financial advisor before making any investment decisions.

Clearly Nifty will break 18000 level. Expiry day, tough day because mostly time decay enjoys the premium, therefore tougher for option buyers like me to result into profit. Nonetheless, we enjoy rallies or drops when Open Interest data tells us that Funds have been trapped at the surpassing of Support level that was at a strike price or rallies that gap up above resistances. These two levels in the graph I have found to be appropriate for tomorrows' gameplay.

NIFTY
Nifty we should go level by level & oi data will be very important which i will drop on my channel thorugh Shot videos

NIFTY ANALYSISNOTE:: IF TRADE ABOVE 11460 THEN IT CAN MOVE UPTO 11525, INTRADAY SUPPORT COMES AT 11400 BELOW THIS IT CAN FALL UPTO 11370

NIFTY 50 Trade Setup - 27'th August 2018-What will nifty do now?Hello all,
Explained about support and resistance in the chart. Buy put or sell in futures if those support breakout.
