ShortI am currently reassessing my targets for the Nifty. If the level of 23,080 is breached and the index closes below this support, I will adjust my target to around 20,200, as this would indicate a more significant market correction is underway.
This level aligns with the 50% Fibonacci retracement of the recent rally, which further strengthens the case for this correction. In my view, this level is not only plausible but inevitable, given the current market dynamics.
The broader market is signaling a potential major top, which suggests that the risk of further downside is increasing. In this environment, simply averaging into the market can be highly risky, as it may expose investors to larger losses if the market continues to decline.
Instead, I recommend adopting a more strategic approach to portfolio construction, focusing on calculated risks. This means selectively building positions based on strong, risk-adjusted opportunities rather than committing large capital indiscriminately. It’s essential to have a clear risk management plan in place, especially in volatile conditions like the current market environment.
Niftysupportandresistance

Nifty in search of bottom. As it was expected Nifty plummeted further in search of bottom. Nifty closed at 23085 which is near a fragile support of 23057. It does not look likely that The reasons for the fall are various as explained in the previous posts. Some of reasons being constant selling of FIIs under the guise risk free return available in US debt market in addition to other value buying options emerging in other developing markets.
Nifty valuations have seen reasonable correction now buying can emerge slowly in next 1 to 4 weeks as per my understanding. Dollar is at valuations that are hardly justified and once the correction in Dollar starts we will see FIIs returning to Indian markets. The bottom support levels are at 23057, 22800, 22421, 21783, 21294 and finally 20813 region. It will be interesting to see which of these levels emerge as a firm bottom from where Nifty can bounce back. Resistances for Nifty now seem to be at 23359, 23690 (Father Line Resistance), 23938, 24060 (Mother Line Resistance), 24525, 24948, 25379, 25782 and finally 26277. Once previous ATH is crossed we will see new highs in Nifty hopefully within this year in the range of 27 or 28K. As of now little bit of pain still remains in the market. Nifty is already in the EXTREME FEAR ZONE AT 23.30. Long term investors can start value buying. (As per Ticker tape).
Extreme fear zone (<30) suggests a good time to open fresh positions as markets are likely to be oversold and might turn upwards.
Extreme greed zone (>70) suggests to be cautious in opening fresh positions as markets are overbought and likely to turn downwards.
Disclaimer: The above information is provided for educational purpose, analysis and paper trading only. Please don't treat this as a buy or sell recommendation for the stock or index. We do not guarantee any success in highly volatile market or otherwise. Stock market investment is subject to market risks which include global and regional risks. I or my clients might have positions in the stocks that we mention in our posts. We will not be responsible for any Profit or loss that may occur due to any financial decision taken based on any data provided in this message. Do consult your investment advisor before taking any financial decisions. Stop losses should be an important part of any investment in equity.

Nifty looking weak after closing below Mid-channel. Nifty looking very weak after closing below Mid-channel support and 50 weeks EMA Mother line support. Mother line support or the 50 Week EMA was at 23442 and the closing we got is at 23431. If Nifty does not recover quickly and claims the Mid-Channel and 50 Weeks EMA, we might be in for more fall with supports at 23273, 22800 (Major Support Zone). If we get a weekly closing below 22800 we will fall totally into bear territory. In such a scenario bears can drag Nifty further down to 22025, 21294 or even near channel bottom of 20813. 20813 will again be a major Parallel chanel bottom support. Resistances on the upper side will be at 23442, 23938, 24525 and 24948 before we can reclaime 25K levels. Later in the year when we get a closing above 25K levels we may again face the 25782, 26277 previous Nifty peak will be major resistances. Nifty channel top post recovery seems to be at 27255. We may reach there in hopefully by mid or end H2 2025. Value Investors can start looking out for bottom fishing and value buying opportunities specially in the Large and selective mid and small caps.
Disclaimer: The above information is provided for educational purpose, analysis and paper trading only. Please don't treat this as a buy or sell recommendation for the stock or index. We do not guarantee any success in highly volatile market or otherwise. Stock market investment is subject to market risks which include global and regional risks. I or my clients might have positions in the stocks that we mention in our posts. We will not be responsible for any Profit or loss that may occur due to any financial decision taken based on any data provided in this message. Do consult your investment advisor before taking any financial decisions. Stop losses should be an important part of any investment in equity.

Prospects of Further downside in Nifty hanging by the thread. Pretty bad closing by Nifty today which has further downside in Nifty hanging by the thread. As you can see we are near the bottom of the pennant structure. If the downside is broken by any chance possibility of further downside can not be ruled out. However if the support of today's low is maintained possibility of upside will open up. Silver lining in the cloud is DII being on buying side and RSI has take an upward turn with closing above yellow line.
The supports for Nifty now are at 23463 Bollinger lower band support, 23380 and 23365 (Final Support).
Resistances on the upper side for Nifty are at 23682 (Bollinger mid band), 23722 (Mother line resistance), 23787 (Bollinger upper band), 23889 and finally 23980 (Father line resistance). Above 23980 closing the door for further up side will open. With Medium term targets being at 24073, 24103, 24232, 24302 and finally 24401. Above 24401 closing Bulls can jump back to business.
Disclaimer: The above information is provided for educational purpose, analysis and paper trading only. Please don't treat this as a buy or sell recommendation for the stock or index. We do not guarantee any success in highly volatile market or otherwise. Stock market investment is subject to market risks which include global and regional risks. I or my clients might have positions in the stocks that we mention in our posts. We will not be responsible for any Profit or loss that may occur due to any financial decision taken based on any data provided in this message. Do consult your investment advisor before taking any financial decisions. Stop losses should be an important part of any investment in equity.

Nifty Intraday Support & Resistance Levels for 09.01.2025On Wednesday, Nifty opened with a gap-up and touched a high of 23,751.85. However, it couldn’t sustain the momentum and dropped to a low of 23,496.15. It managed to close at 23,688.95, losing a modest 19 points over the previous close. The Weekly and Daily Trends (50 SMA) remain sideways, reflecting indecision in the market.
Demand/Support Zones
Near Demand/Support Zone (30m): 23,496.15 - 23,559.20
Near Support Level: 23,263 (low of 21st November 2024)
Far Support Level: 23,189.88 (61.8% FIBO retracement)
Far Demand/Support Zone (Daily): 21,791.95 - 22,910.15
Supply/Resistance Zones
Near Supply/Resistance Zone (15m): 23,966.95 - 24,054.30
Near Supply/Resistance Zone (15m): 24,164.90 - 24,210.30
Far Supply/Resistance Zone (Daily): 24,149.85 - 24,394.45 (tested)
Far Supply/Resistance Zone (Weekly): 24,567.65 - 25,234.05 (tested)
Outlook
Despite a gap-up start, Nifty struggled to hold gains. Watch for a breakdown below the support at 23,189 for potential bearish action. On the upside, crossing 24,400 could signal recovery.

Parallel Channel hourly candles suggests Nifty is delicate zone.Parallel Channel of Nifty suggest that we are in delicate zone with shadow of the candle being positive. Nifty has thrice taken support on the channel bottom as you can see in the chart. A strong support zone for Nifty is seeing strong buying emerging near the channel bottom. This strong support zone is between 23509 and 23263.
The Three important resistances however are not allowing Nifty to grow further. These 3 resistance are:
1) Mother line resistance near 23775.
2) Father and trend line combine resistance near 24010.
3) Third important resistance for Nifty to conquer will be near 24288 which is the mid channel resistance.
When we will get a closing above 24288 the Bull can breath a little easy and try and push Nifty upwards towards 24510, 24779 or even above 25K.
The zone between 25033 and 25200 will again be a tough zone to conquer as the Nifty will again hit the top of the parallel channel.
Conclusion: All is good till we do not get a closing below 23K levels. Below 23K levels weekly closing Bears will have position to overpower the market and drag Nifty further down. For long term investors this is good opportunity to invest big go long and hold on.
Today ONGC, Reliance, ITC, Asian Paints, Dr Reddy, Wipro and TCS are the few large cap stocks which saw buying.
The laggards for Nifty today were Apollo Hospitals, Trent, Shriram Finance, Bajaj Auto, ultratech and few other Large cap stocks.
Disclaimer: The above information is provided for educational purpose, analysis and paper trading only. Please don't treat this as a buy or sell recommendation for the stock or index. We do not guarantee any success in highly volatile market or otherwise. Stock market investment is subject to market risks which include global and regional risks. I or my clients might have positions in the stocks that we mention in our posts. We will not be responsible for any Profit or loss that may occur due to any financial decision taken based on any data provided in this message. Do consult your investment advisor before taking any financial decisions. Stop losses should be an important part of any investment in equity.

Nifty Intraday Support & Resistance Levels for 08.01.2025On Tuesday, Nifty opened with a gap-up but traded within a narrow range, touching a high of 23,795.50 and a low of 23,637.80. The index ended the session at 23,707.90, gaining 92 points over the previous close. Both, the Weekly and Daily Trends (50 SMA) remain sideways, indicating a lack of strong directional momentum.
Demand/Support Zones
Near Support Level: 23,263 (Low of 21st November 2024)
Far Support Level: 23,189.88 (61.8% FIBO retracement)
Far Demand/Support Zone (Daily): 21,791.95 - 22,910.15
Supply/Resistance Zones
Near Supply/Resistance Zone (15m): 23,966.95 - 24,054.30
Near Supply/Resistance Zone (15m): 24,164.90 - 24,210.30
Far Supply/Resistance Zone (Daily): 24,149.85 - 24,394.45 (tested)
Far Supply/Resistance Zone (Weekly): 24,567.65 - 25,234.05 (tested)
Outlook
After recent volatility, the Nifty appears to be consolidating within a narrow range. A break above the 24,400 resistance could trigger further upside, while support at 22,900 - 23,200 remains critical for bulls to defend. Watch these levels for potential breakout or breakdown opportunities.

Fibonacci Support & Resistances for Nifty (Medium term outlook).Important Fibonacci support for Nifty drawn on daily line chart of Nifty is at 23349. Below 23349 closing bears can have a field day and can create havoc but that looks less likely as of now. The closing today is 23207 which is just above 200 days EMA or the father line which is a good sign. Father line was at 23700. On the upside the Fibonacci resistance for Nifty seem to be at 23902, 24170 (Important Mother line Resistance) 24236, 24467, 24780 and finally Fibonacci Golden ratio from the current levels is at 25185. It will take some doing from the Bulls to close above this level. This presents the medium time frame outlook for the Nifty.
RSI indicator also seems to have taken an upward swing but mid level is yet to be crossed for that indicator.
MACD indicator suggests that Moving averages are fighting hard to converge and bring back some bullish momentum into the market to infuse some life into the Bull who are trying to come out of comma.
Disclaimer: The above information is provided for educational purpose, analysis and paper trading only. Please don't treat this as a buy or sell recommendation for the stock. We do not guarantee any success in highly volatile market or otherwise. Stock market investment is subject to market risks which include global and regional risks. We will not be responsible for any Profit or loss that may occur due to any financial decision taken based on any data provided in this message.

Support, Resistance and Bollinger Band suggest limited downside.I have just drawn Supports, Resistance, Mother, Father lines and added Bollinger band to Nifty chart. The indication is limited downside for now in Nifty unless the Chinese Virus is overplayed in the market by the bears and other forces. My discussion with medical fraternity and other knowledgeable people suggest that the threat of HPMV is overplayed and mortality rates might not be as high as COVID in the recent virus outbreak. This is the information I have however I advise utmost caution would wish you to verify the information with friends in the medical field in your knowhow. Currently Bollinger band is not suggesting a heavy downside. However things will be more clear by end of this week as the market plays out. Not more than 2 to 5% (max) down side is visible to me in the short term unless there is a global catastrophe of massive order. RSI has taken a turn hopefully soon it will embark towards bullishness.
Supports for Nifty Remains at: 23249, 23466, 23555. Below 23249 flood gates for further downside can open.
Resistances for Nifty: 23720, 23795, 23855 (Mother line or 50 Hours EMA), 23942 (Mid-Bollinger band level), 24061 (Father line or 200 Hours EMA), 24146, 24231 and finally 24326 (Bollinger band top).
Disclaimer: The above information is provided for educational purpose, analysis and paper trading only. Please don't treat this as a buy or sell recommendation for the stock. We do not guarantee any success in highly volatile market or otherwise. Stock market investment is subject to market risks which include global and regional risks. We will not be responsible for any Profit or loss that may occur due to any financial decision taken based on any data provided in this message.

Mid-Channel Resistance on Hourly charts Stops Nifty. The parallel channel is a channel in which the stock or index travels for a particular period of time. The upper frame of the channel acts as a strong resistance and the lower frame of the index acts as a support. Mid channel works in a dual way. If the price or the index level is above the Mid-Channel it acts as support if the price or the index level is below the Mid-Channel the line acts as resistance. Also on the daily chart of Nifty the level of 24212 was a Mother line Resistance of 50 day's EMA. Nifty today made a high of 24196 and retreated from there so it can be safely said that these 2 levels 24212(Mother line) and 24226 (Mid Channel resistance see in the chart will be most important resistances moving forward into the next week and probably full month. There is also a news of HPMV Virus outbreak in China as Trump resumes Presidency. Quarterly Results have already started flowing in and good results are expected this time around unlike traditionally weak October quarter. Additionally we are near the budget and there are news trickling in about relief to the Middle Class. Which can spark a pre-budget rally. So the signals from international market, technical analysis and on the local front. Next week is very important with perspective of full month of January.
Nifty Supports Remain at: 23989, 23902 (50 Hours Mother Line), 23797, 23540 (channel bottom Support) and finally 23279. Below 23279 closing Nifty has potential to fall totally into the bear grip. This does not look likely unless there is a catastrophic global event.
Nifty Resistances Remain at: 24086 (200 Hours EMA or the Father line Resistance), 24226 (Mid Channel Resistance), 24348, 24556, 24779, 24919 and finally 25025 (Channel top resistance).

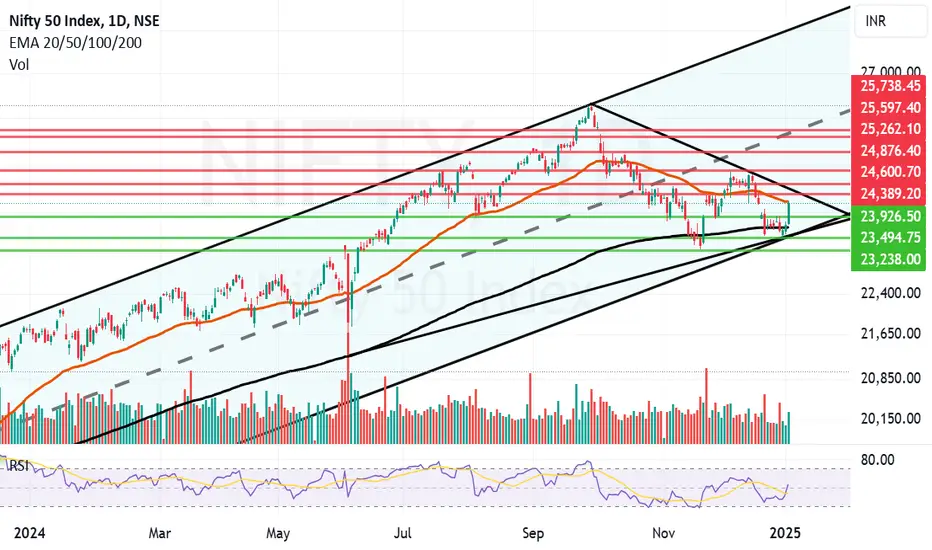
Nifty Stages Massive Comeback. But Will The Mother Line Relent? Nifty has staged a massive comeback today on the back of FII buying today. Nifty made a high of 24226 but Mother line Resistance (50 day's EMA at 24221) pushed it back a bit and it ended the day at 24188. If the mother line relents tomorrow and if we can get a weekly closing above 24221 tomorrow Bulls have potential to take the momentum forward into January with a possibility of Budget rally.
The supports for Nifty remain at 23926, 23698 (Father Line Support of 200 day's EMA), 23494 and finally 23238. Below 23238 all hell can break loose and bears will have potential to Pull Nifty further down.
Resistances on the upper side remain at 24221 (Mother Line Resistance of 50 day's EMA) followed by 24389, 24600 and 24876 before Nifty snatches back 25K levels.
Shadow of the candle remains neutral to positive but it can turn neutral or even negative if Mother line resistance comes into play again. The best possibility for Nifty remains if it can get a gap up opening above 24221. This can happen if we get good support from International indices and Gift Nifty tonight. Tomorrow's closing will be very important as it is the first weekly closing for the year.
Disclaimer:
The above information is provided for educational purpose, analysis and paper trading only. Please don't treat this as a buy or sell recommendation for the stock. We do not guarantee any success in highly volatile market or otherwise. Stock market investment is subject to market risks which include global and regional risks. We will not be responsible for any Profit or loss that may occur due to any financial decision taken based on any data provided in this message.
Nifty after multiple efforts not able to close above 23900.Nifty again tried to climb up and made a high of 23915 however there was tremendous selling pressure at that level and not only it could not sustain 23900 but also it failed to sustain 23800 or even 23650 levs. Nifty closed at 23644 levels. This is a closing below the Father line (200 days EMA) which was at 23693. This closing is indicative of weakness. Shadow of the candle has turned negative as of now. There is a strong support at 23567. If this support is broken the door way towards 23273 or even 22800 will open up. Relative strength index is 37.40 and RSI support is at 30 and 27.54 levels. Incase of positive closing tomorrow which looks little difficult as of now the resistances will be at 23650, 23693 (Father Line), 23809, 23961 and finally 24159 and finally Mother line (50 Days EMA) Resistance at 24266.
So as of now it looks like we will have a modest close for the year. It has been an year for Nifty which Amplifies with 'what could have been'. Right now we are around 10% of the peak and at 9% yearly gains as compared to yearly closing. Hoping that law of averages catches up next year and we reach new highs next year and close the year robustly.
Disclaimer: The above information is provided for educational purpose, analysis and paper trading only. Please don't treat this as a buy or sell recommendation for the stock. We do not guarantee any success in highly volatile market or otherwise. Stock market investment is subject to market risks which include global and regional risks. We will not be responsible for any Profit or loss that may occur due to any financial decision taken based on any data provided in this message.

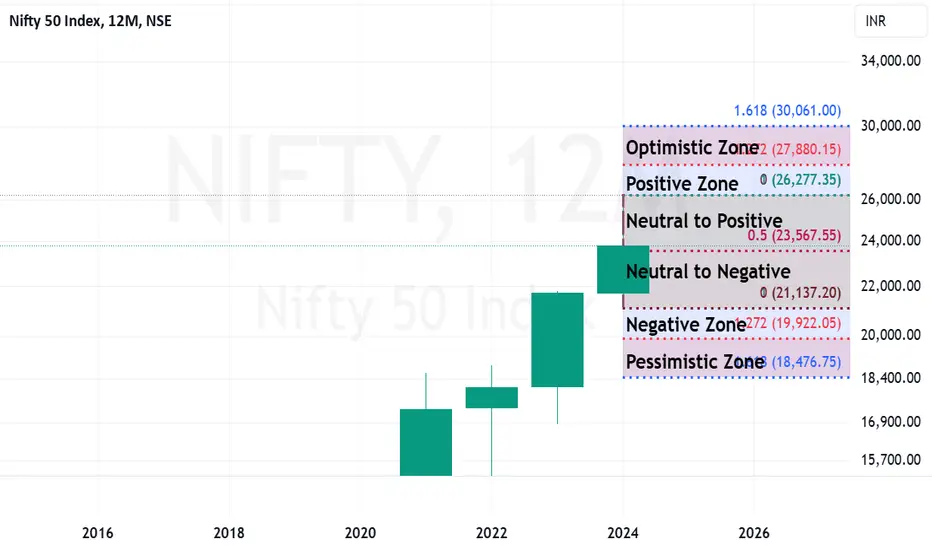
Fibonacci retracement on Yearly Candle gives us 2025 levels. We will continue out study of reading charts Today we will try to understand how to read the chart with the help of only 1 candle and Fibonacci series we will try to predict the range in which Nifty can move in the year 2025. First thing that one must understand that reading the charts is not a rocket science.
What we have done is very simple and anyone can do. The candle stick that we have take in a 12 Month Candle. That means, all movement of Nifty for the full year has been encompassed by a single candle. I have then applied Fibonacci retracement and reverse retracement. Which has given us various zones that determine levels of Nifty. In Case you do not know about Fibonacci Golden ration you may read about it in my previous articles about the subject in Smart Investment. Fibonacci series was seen in ancient Indian Sanskrit and Maths in the works of Pingala and Hemachandra few Thousand years ago. The series derives its name however from Italian mathematician who made it famous in the modern era.
Neutral Zone: The results that we got by applying Fibonacci and reverse Fibonacci on 12-month candle tell us that the neutral zone in case of sideways movement throughout the year would see Nifty moving between 21137 to 26277. Candles however seldom repeat on yearly scale but you never say never. These are the highs and lows of the current year.
Negative Zone: If something very negative happens in the budget or thereafter on local or global scale we might see Nifty pivot to this range or 21137 to 19922. Where it could find support and reembark its journey upwards.
Pessimistic Zone: In case of a catastrophe or some thing very negative on global or local / Macro or Micro economic front the range that we could see will be Nifty deteriorating towards 19922 to 18476. However, this looks unlikely as of now and even if it happens the upward journey might soon begin as PE investors might see a great value buying opportunity.
Positive Zone: If things fall in place and economic progress continues, there is no deterioration of GDP or inflation and if Rupee recovers swiftly the zone between 26277 pervious peak and 27880 is possible. We may see a new peak of Nifty in this range.
Optimistic Zone: In case the FII return enemas and economy continues to bloom with few elections and political stability / border stability and GDP growth continues it is quiet possible that we may see Nifty reaching new highs which will be in this range between 27880 and 30061. This seems a little distant dream as of now but you can never say never. At least if we hit the sweet spot of economy and Fibonacci golden ration even this ‘Everstsesque’ peak might be summited by Nifty.
Here we have given different hypothetical scenarios of Nifty based on Fibonacci and candlestick analytics. For indepth understanding of Techno-Funda investing you can read my book which is The Happy Candles Way to Wealth creation. This book is available on Amazon in paperback and Kindle version. The book contains valuable tips for you to maximise your profits from stock market and wealth creation. It also explains my much coveted Mother, Father and Small Child Theory.
Disclaimer: The above information is provided for educational purpose, analysis and paper trading only. Please don't treat this as a buy or sell recommendation for the stock. We do not guarantee any success in highly volatile market or otherwise. Stock market investment is subject to market risks which include global and regional risks. There is also chance of bias in our opinion. I, my family or my clients may have a long position in the stock. We will not be responsible for any Profit or loss that may occur due to any financial decision taken based on any data provided in this message.
Nifty Intraday Trade Setup & technical analysis |27th Dec 2024Nifty moments for option and future trading 27/Dec/2024
follow us for more updates information.
message us for any stocks related information.

A Smart Comeback by Nifty but is it a dead cat bounce?Today we saw a smart comeback by Nifty but a confirmation candle and a positive closing to the week an ensure if it is not a dead cat bounce (Only a Technical bounce before Nifty falls again). Further ground has to be covered by Nifty before we reach the Bull territory. The closing today was good above the Father line and indicates positivity but whether the bounce sustains or not is a question that will be answered later in the week.
Right now the supports for Nifty remain at: 23691 (200 days EMA) or the Father line, 23588, 23258 (Mid channel support), 22499 and 21572.
Resistances on the upper side are at: 23871, 24053, 24183, 24359 (50 day's EMA) or the Mother line resistance, 24552 and finally 24721 (Important Fibonacci resistance). Bulls can get a prominence only after we get a closing above this level.
Disclaimer: The above information is provided for educational purpose, analysis and paper trading only. Please don't treat this as a buy or sell recommendation for the stock. We do not guarantee any success in highly volatile market or otherwise. Stock market investment is subject to market risks which include global and regional risks. We will not be responsible for any Profit or loss that may occur due to any financial decision taken based on any data provided in this message.

Nifty Short Term Analysis. Nifty today has given a poor closing below 200 days EMA but the only saving grace can be that the closing is just above Mid-Channel support of 23500 and Important Fibonacci support of 23263.
These Two supports are broken then more hell can break loose and we can get to see the next Fibonacci supports being tested. The next Fibonacci supports can be near 22509 or 21585. On the positive side if either of the support is held and then we can see a new rally in Nifty wit resistances at 24718 and 25347. It looks like Nifty will take some time to reach new highs as the the mode is bottom searching and consolidation as of now.
Fresh rally and Bullish recovery can start only after we get a closing above these 2 levels. However, this can be a good time to go long by picking good blue chip stocks available at good valuations.
Disclaimer: The above information is provided for educational purpose, analysis and paper trading only. Please don't treat this as a buy or sell recommendation for the stock. We do not guarantee any success in highly volatile market or otherwise. Stock market investment is subject to market risks which include global and regional risks. We will not be responsible for any Profit or loss that may occur due to any financial decision taken based on any data provided in this message.

Three Year Parallel Channel of Nifty with Multiple indicators. We have tried to draw a Three Year Parallel Channel of Nifty with Multiple indicators. We will try to understand what is happening as per each indicator and try to get the jist of moves that may occur with a medium to long term perspective.
Indicator 1) Parallel Channel: The parallel channel indicates that after hitting the channel top at 26277 the Nifty is receding and is on a search of it's bottom from where it can launch forward again. That is the case when every time Nifty has it a channel top as you can see in the chart. The Future Channel Top once Nifty picks up the next Bull run seems to be around 29497 as per the parallel channel. Mid channel support of the parallel channel is around 23500 zone which can support Nifty. If we get a weekly closing below 23500 this level will become a resistance. In such a scenario of weekly closing below 23500 Channel bottom seems to be near 21296.
Indicator 2) Fibonacci Retracement: Fibonacci retracement suggests a bottom near 23263. If this level is broken there is a possibility of Nifty falling to the next fibonacci supports will be at 22506 and 21577. Once the Bull run begins the next resistance levels as per Fibonacci seem to be at 24725, 26777 (Previous high), 27162 and finally 28331.
Indicator 3) Bollinger Band: Support with respect to lower width of Bollinger Band seems to be near 23340. Mid Bollinger band resistance seems to be near 24660 and Bollinger band upper width resistances seems to be near 25981.
Indicator 4) RSI or the Relative Strength Index: RSI currently is at 44.41 and going downwards showing weakness. The RSI support can be found in the zone of 40, 38 or 36. Usually When RSI is below 30 the stock or index is considered oversold and when the stock or index RSI is above 70 it is considered overbought. RSI Below 20 is extremely oversold zone and RSI above 80 is considered extremely overbought.
Indicator 5) MACD or Moving Average Convergence and Divergence: MACD is a combination of Moving averages lines which tend to indicate direction in which stock or index will move and histograms indicate strength or weakness of a rally. As per MACD Nifty right now is in extreme Bear grip and will take a little time to recover. When the Blue line will start moving upwards and when it might cross the red line and continue to move upwards it can be considered as Nifty will come back to Bull Zone. Colour of histograms at that time will also start going Dark Green or light Green.
Indicator 6) 50 and 200 weeks EMA or the Mother and Father line: I have designed a theory called Mother, Father and Small Child Theory. As per this theory the movement of index or a stock in the chart is like a movement of a 3 year old child when it goes to a garden. The movement of 50 EMA is like movement of the mother and movement of the 200 EMA is like movement of a Father of that child. To know more about this theory or other indicators mentioned earlier you need to read my book THE HAPPY CANDLES WAY TO WEALTH CREATION. This book is available in Amazon in paperback or Kindle version. It is one of the Highest rated book in the category. Have a look at that book it will help you immensely in your wealth creation journey. Now as per this theory the Nifty right now is at 23587. 50 Weeks EMA is at 23403. 200 Weeks EMA is at 19335. as the Nifty is above these levels both these levels will work as a great support to Nifty and can help Nifty from falling further.
Conclusion: Nifty is approaching multiple supports from where it has potential to turnaround. Mid channel support is around 23500, 50 Weeks EMA support or the Mother line is at 23403. 23340 is the Bollinger band lower band width support. Fibonacci support is at 23263. We can see a turnaround mostly from either of these three supports. If these supports are broken by chance (looks less likely but you can never say never) then the next supports will be at 22507, 21296 or worst case scenario as of now looks like 19335. On the upper side resistances seem to be at 24660 Fibonacci mid resistance, 24725 is the Fibonacci resistance, 25981 is Bollinger band upper width resistance and 26277 is the Fibonacci resistnace which also the previous high of Nifty. Once this zone is crossed in a long term we can reach the targets of 27162 Fibonacci resistance, 28331 Fibonacci golden ratio resistnace and 29497 which is the approximate nex channel top. (This is the Medium to Long term outlook of Nifty).
This is how you can analyse any index or a stock using the 6 indicators mentioned in the writeup. I give top most priority to these 6 indicators in my analysis.
Disclaimer: Disclaimer: The above information is provided for educational purpose, analysis and paper trading only. Please don't treat this as a buy or sell recommendation for the stock. We do not guarantee any success in highly volatile market or otherwise. Stock market investment is subject to market risks which include global and regional risks. We will not be responsible for any Profit or loss that may occur due to any financial decision taken based on any data provided in this message.

Can The Major Support Zone Save Nifty From Falling Further?There is a triple Support zone that has been reached by Nifty. The Zone between today's low that is 23870 and 23692 has multiple supports of a trend line and Father Line of 200 day's EMA. Let us see if we have a revival from here. If that will be the case the next resistance zones will be 24019, 24175, 24416(Major Mother Line Resistance of 50 day's EMA) and 24529 (Major Trend Line Resistance).
If the support of 23870 is broken we will have to rely upon 23962 that is the major 200 day's EMa of Father line. If we get a closing below 23692 or the Father line. Bears will become more powerful and we may see them control the game. In such a scenario the supports will be at 23350, 23088 and 22828. So very critical weekly closing tomorrow. Shadow of the candle for tomorrow is neutral to negative.
Disclaimer: The above information is provided for educational purpose, analysis and paper trading only. Please don't treat this as a buy or sell recommendation for the stock. We do not guarantee any success in highly volatile market or otherwise. Stock market investment is subject to market risks which include global and regional risks. We will not be responsible for any Profit or loss that may occur due to any financial decision taken based on any data provided in this message.

Nifty Intraday Trade Setup & technical analysis |20 Dec 2024Nifty moments for option and future trading 20/Dec/2024
follow us for more updates information.
message us for any stocks related information.

Nifty Intraday Trade Setup & technical analysis |19th Dec 2024Nifty moments for option and future trading 18/Dec/2024
follow us for more updates information.
message us for any stocks related information.

As Expected Mother Line resistance has come into playAs we had expected in Yesterday's message the closing below Mother line yesterday meant that Mother line resistance was supposed to come into play today and it did. Nifty made a high of 24394 and ominous mother line resistance was near by as can be seen in the chart and Nifty got rejected from there. Now Nifty is tossed into bottom searching mode. Today's low that is 24149.85 was a support zone and we saw a closing above it at 24198 which is the silver lining in the cloud. If 24150 is respected tomorrow we can start seeing some range bound upside. If the support of 24150 is not respected and we get a closing below this level the further supports for Nifty will be at 23904, 23803 or Strong Father line support at 23689. If 23689 is broken we can see a low of 23291 or so as of now.
On the positive side if the support of 24150 is respected by Nifty the resistances on the upside will be near 24311, 24435 (Strong Mother line resistance), 24627, 24793 or even 24960. 24960 is a strong resistance to cross but if and when it is crossed we can see more upside as Bulls will start calling shots above this level.
Thus the most critical supports are 24150 and 23689. Most critical resistances will be 24435 as of now.
Disclaimer: The above information is provided for educational purpose, analysis and paper trading only. Please don't treat this as a buy or sell recommendation for the stock. We do not guarantee any success in highly volatile market or otherwise. Stock market investment is subject to market risks which include global and regional risks. We will not be responsible for any Profit or loss that may occur due to any financial decision taken based on any data provided in this message.

Nifty Intraday Trade Setup & technical analysis |18th Dec 2024Nifty moments for option and future trading 18/Dec/2024
follow us for more updates information.
message us for any stocks related information.

2 Red Candles throw Nifty back to support searching mode. 2 intensive Red Candles with big selling throw Nifty back to support searching mode. The strong support zone is round the corner. The chart shows Nifty is nearing 2 major trend line supports at 24257 and 24175. If these 2 supports are broken further supports for Nifty will be at 23904 and 23803. Final Mega support for Nifty will be 23684 (200 day's EMA or Father Line Support) and recent low of 23291. On the upper side resistances galore at 24445 (50 day's EMA or Mother line) followed by 24627, 24793, 24960 and finally 25209.
The selling has come on the back of Rupee hitting all time low and fears over US FED slowdown in the Rate Cuts in the year 2025 as inflation is not abetting and is continuing to grow. US Markets have already priced in 25bps rate cut for the ongoing FEd meeting. But more worry is regarding the commentary about 2025 and 1 or 2 more US FED meetings decisions before Trump administration takes over. With Nifty nearing critical support levels mentioned earlier volatility, bulls Vs bears FII Vs DII intense struggle is on cards. Bears have had an upper hand so far this week but Bulls can stage a fierce fight back any time within this week itself once Nifty confirms support.
Disclaimer: The above information is provided for educational purpose, analysis and paper trading only. Please don't treat this as a buy or sell recommendation for the stock. We do not guarantee any success in highly volatile market or otherwise. Stock market investment is subject to market risks which include global and regional risks. We will not be responsible for any Profit or loss that may occur due to any financial decision taken based on any data provided in this message.
