NIFTY 50
1. Ascending Channel:
Nifty is trending within a clear upward (ascending) channel, indicating a bullish trend as long as the price stays within this channel.
2. Support & Resistance:
There is a strong support zone in the range of 24,000–24,200, highlighted by a red-shaded area on the chart.
The current level (24,752.45) is near the middle of the channel and showing signs of minor correction.
3. Two Possible Scenarios (Arrows):
Scenario 1: From the current level, the market could move towards the upper boundary of the channel (around 25,500–26,000).
Scenario 2: There could be a short-term correction (downward movement) first, followed by a bounce from the support zone and then an upward move.
If you find this helpful and want more FREE forecasts in TradingView, Hit the 'BOOST' button
Drop some feedback in the comments below! (e.g., What did you find most useful?
How can we improve?)
Your support is appreciated!
Now, it's your turn!
Be sure to leave a comment; let us know how you see this opportunity and forecast.
Have a successful week
DISCLAIMER: I am NOT a SEBI registered advisor or a financial adviser. All the views are for educational purpose only
Niftytomorrow

Nifty levels - May 29, 2025Nifty support and resistance levels are valuable tools for making informed trading decisions, specifically when combined with the analysis of 5-minute timeframe candlesticks and VWAP. By closely monitoring these levels and observing the price movements within this timeframe, traders can enhance the accuracy of their entry and exit points. It is important to bear in mind that support and resistance levels are not fixed, and they can change over time as market conditions evolve.
The dashed lines on the chart indicate the reaction levels, serving as additional points of significance to consider. Furthermore, take note of the response at the levels of the High, Low, and Close values from the day prior.
We hope you find this information beneficial in your trading endeavors.
* If you found the idea appealing, kindly tap the Boost icon located below the chart. We encourage you to share your thoughts and comments regarding it.
Wishing you success in your trading activities!

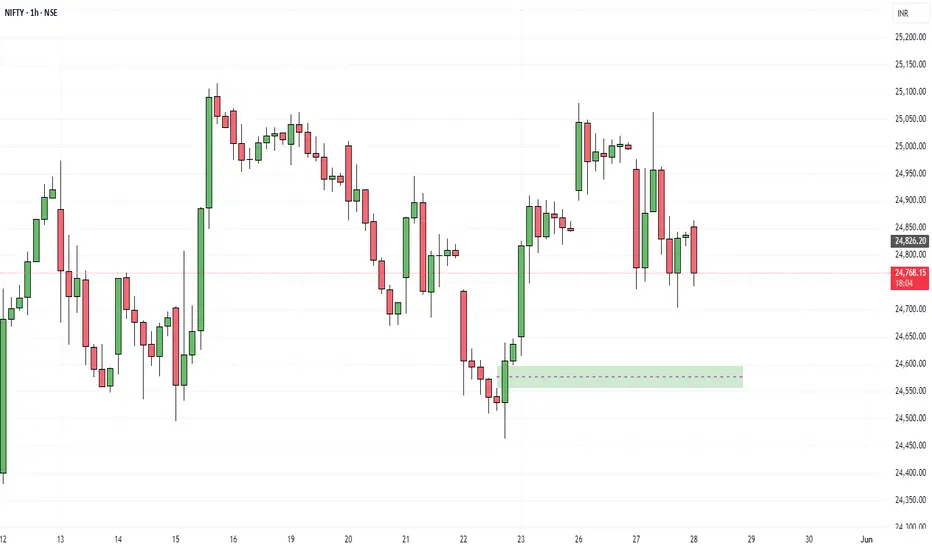
Important Level For Nifty.Here in one hour time frame nifty is coming to get some liquidity as you can see, after getting liquidity nifty may again go higher and make a new high.
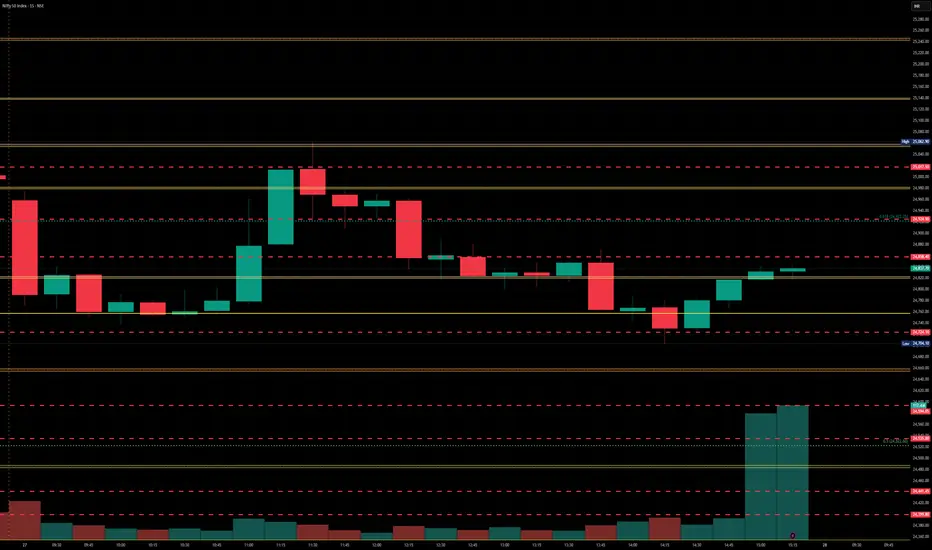
Nifty levels - May 28, 2025Nifty support and resistance levels are valuable tools for making informed trading decisions, specifically when combined with the analysis of 5-minute timeframe candlesticks and VWAP. By closely monitoring these levels and observing the price movements within this timeframe, traders can enhance the accuracy of their entry and exit points. It is important to bear in mind that support and resistance levels are not fixed, and they can change over time as market conditions evolve.
The dashed lines on the chart indicate the reaction levels, serving as additional points of significance to consider. Furthermore, take note of the response at the levels of the High, Low, and Close values from the day prior.
We hope you find this information beneficial in your trading endeavors.
* If you found the idea appealing, kindly tap the Boost icon located below the chart. We encourage you to share your thoughts and comments regarding it.
Wishing you success in your trading activities!
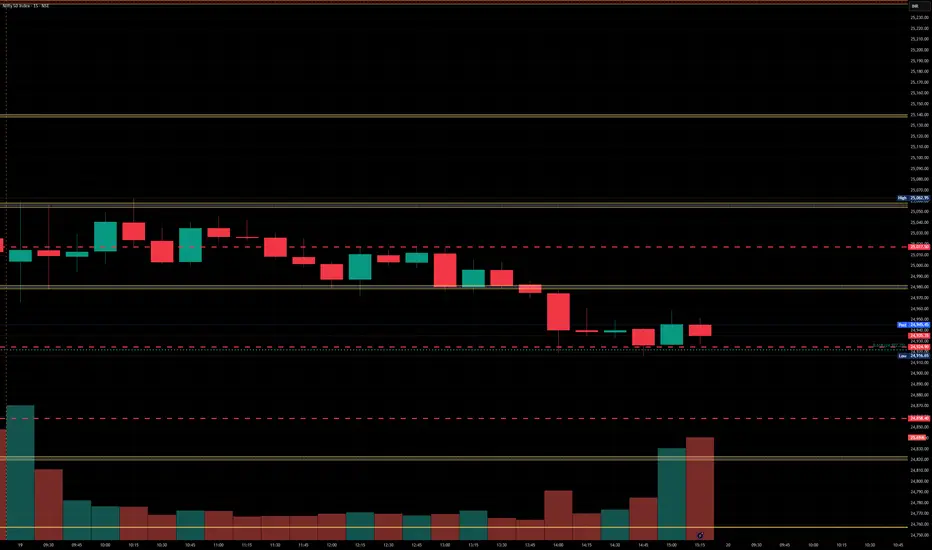
Nifty levels - May 27, 2025Nifty support and resistance levels are valuable tools for making informed trading decisions, specifically when combined with the analysis of 5-minute timeframe candlesticks and VWAP. By closely monitoring these levels and observing the price movements within this timeframe, traders can enhance the accuracy of their entry and exit points. It is important to bear in mind that support and resistance levels are not fixed, and they can change over time as market conditions evolve.
The dashed lines on the chart indicate the reaction levels, serving as additional points of significance to consider. Furthermore, take note of the response at the levels of the High, Low, and Close values from the day prior.
We hope you find this information beneficial in your trading endeavors.
* If you found the idea appealing, kindly tap the Boost icon located below the chart. We encourage you to share your thoughts and comments regarding it.
Wishing you success in your trading activities!

Next Target for #kalyankjil Is 594-600 KALYAN JEWELLERS Might give us this target till 6th june. as it's showing good volume and price action to fulfill our needs. hope for the best

NIFTY : Trading levels and plan for 26-May-2025📊 Nifty Trading Plan – 26-May-2025
Timeframe: 15 Min | Reference Spot Price: 24,845
Gap Opening Threshold: 100+ Points
🚀 Gap-Up Opening (Above 24,974) – 100+ Points
If Nifty opens above the Opening Resistance level of 24,974, it enters a critical resistance zone that may trigger two-sided moves. The area between 25,195 – 25,294 is marked as the Profit Booking Zone / Last Intraday Resistance .
🟥 This zone has historically seen supply, and sharp up-moves may get trapped without strength in broader participation.
✅ Plan of Action:
– Avoid initiating long trades immediately post gap-up unless price shows strong bullish candles above 25,195.
– For intraday buying, wait for a clean 15-min candle close above 25,294 with strength in heavyweights.
– Ideal entry would be on a retest of the 25,195–25,294 zone if price holds.
– Reversal patterns (like Shooting Star / Bearish Engulfing) near 25,195 – 25,294 can offer sell-on-rise opportunities toward 24,974, then 24,845.
– Watch for volume confirmation – avoid shorting just because price is high.
🎓 Educational Note: Gap-ups into strong resistance zones require caution. Momentum without volume and market-wide confirmation often leads to failed breakouts. Let structure confirm before jumping in.
📈 Flat Opening (Between 24,790 – 24,974)
This places Nifty inside the No Trade Zone defined between 24,790 – 24,974.
🟧 This range is uncertain – the index may move sideways with choppy price action and lack of conviction from buyers or sellers.
✅ Plan of Action:
– Stay on the sidelines in the first 15–30 mins.
– Only consider long trades if price breaks and sustains above 24,974, then aim for 25,195 – 25,294.
– For short trades, wait for a clean breakdown below 24,790 with a bearish candle close to ride down to 24,684 and then 24,558.
– Risk reward is best outside this zone, not inside. Patience is key.
🎓 Educational Note: Flat openings in mid-range zones often cause emotional trades. Use this time to assess volume trends, sectoral strength, and structure. Most clean entries happen post-10:15 AM.
📉 Gap-Down Opening (Below 24,684) – 100+ Points
A gap-down below 24,684 pushes Nifty near its immediate supports at 24,558 (Last Intraday Support) and 24,250 – 24,190 (Buyer’s Zone).
🟩 This is a sensitive area where smart money may attempt reversals, especially near 24,250 – 24,190.
✅ Plan of Action:
– Watch for reversal signs (Hammer, Bullish Engulfing) around 24,558 and especially in the Buyer’s Support Zone: 24,250 – 24,190.
– If price finds footing and sustains above 24,558, reversal trades can be initiated with a target back to 24,684 – 24,790.
– A strong breakdown below 24,190 would confirm bearishness – in that case, avoid catching falling knives.
– Only go short below 24,190 on breakdown candle with next target open toward swing lows.
🎓 Educational Note: Gap-downs into major demand areas offer some of the best R:R setups—but only if there's evidence of absorption and reversal structure. Never go long just because price is “low”.
🛡️ Options Trading – Risk Management Tips
✅ Use slightly In-the-Money (ITM) options for better delta movement and less time decay.
✅ Avoid trading in No Trade Zones; theta will eat up your premiums.
✅ Follow the 1–2% capital risk rule – don’t over-leverage in anticipation of a breakout.
✅ Always define your stop loss using the underlying spot level, not just option premium.
✅ Book partial profits once price moves in favor and trail SL for the rest.
✅ If you hit 2 stop-losses in a row, take a break and re-assess the trend.
✅ Monitor OI data and sectoral strength—don’t blindly follow index candles.
📌 Summary & Conclusion
🔹 No Trade Zone: 24,790 – 24,974
🔹 Profit Booking / Resistance Zone: 25,195 – 25,294
🔹 Opening Supports: 24,684 & 24,558
🔹 Strong Buyer’s Support: 24,250 – 24,190
📈 For Gap-Ups, avoid early longs into resistance zones unless breakout is confirmed.
📉 For Gap-Downs, prepare for potential reversal from Buyer’s Support Zone.
🕒 In Flat Openings, wait 15–30 mins to avoid whipsaws inside No Trade Zone.
⚖️ Best trades occur outside the No Trade Zone with price + structure + volume alignment.
⚠️ Disclaimer:
I am not a SEBI-registered analyst. This trading plan is purely for educational purposes. Please conduct your own analysis or consult a SEBI-registered advisor before taking trades.

Nifty May Touch 25,500 and the FALL......NIfty may go to collect pending stoploss and orders resting above 25000 and after trapping bulls and bears together it may fall to level 24700 within a month.

23 May Nifty50 trading zone #Nifty50 #option trading
99% working trading plan
👉Gap up open 24683 above & 15m hold after positive trade target 24860, 24980
👉Gap up open 24683 below 15 m not break upside after nigetive trade target 24480, 24330
👉Gap down open 24480 above 15m hold after positive trade target 24683, 24860
👉Gap down open 24480 below 15 m not break upside after nigetive trade target 24330, 24170
Trade plan for education purpose I'm not responsible your trade
More education follow & support me

Nifty levels - May 23, 2025Nifty support and resistance levels are valuable tools for making informed trading decisions, specifically when combined with the analysis of 5-minute timeframe candlesticks and VWAP. By closely monitoring these levels and observing the price movements within this timeframe, traders can enhance the accuracy of their entry and exit points. It is important to bear in mind that support and resistance levels are not fixed, and they can change over time as market conditions evolve.
The dashed lines on the chart indicate the reaction levels, serving as additional points of significance to consider. Furthermore, take note of the response at the levels of the High, Low, and Close values from the day prior.
We hope you find this information beneficial in your trading endeavors.
* If you found the idea appealing, kindly tap the Boost icon located below the chart. We encourage you to share your thoughts and comments regarding it.
Wishing you success in your trading activities!

Nifty Analysis EOD – May 21, 2025 – Wednesday 🟢 Nifty Analysis EOD – May 21, 2025 – Wednesday 🔴
🌀 The Dead Cat Bounces Effect After Yesterday's Quick Fall 🌀
Nifty opened with a 45-point gap-up and, within the first 10 minutes, that gap was filled—marking a low of 24692.65. From there, a sudden burst of buying pressure launched the index above the 24768–24800 resistance zone in just 25 minutes. This sharp move triggered a round of short covering, propelling Nifty to the day’s high of 24946.20.
As shared live on TradingView, the Fib resistance zone of 24930–24940 (0.764–0.786 levels) was a key level to watch. True to expectation, Nifty faced strong rejection from this zone, leading to a V-shaped reversal—wiping out all gains in the next hour and marking a new low of 24685.35.
🌀 Screenshot from Tradingview - 1
🌀 Screenshot from Tradingview - 2
It was a rollercoaster ride in the first half. Post this, Nifty traded mostly within the CPR’s Top Central (TC) and Bottom Central (BC) range—though this range itself was 104 points, keeping the session active and far from boring.
Nifty’s close at 24813, around the VWAP and Central CPR, suggests a temporary equilibrium between buyers and sellers. The good part? We closed above the critical 24768–24800 support-turned-resistance. But there's a catch—the close is below yesterday’s Fib 0.5 retracement, signaling potential caution.
⚠️ Cautionary Note:In the short-term, today’s session fits the textbook example of a Dead Cat Bounce. With weekly expiry tomorrow, it's wise to stay alert and not get trapped in noise. Discipline and patience will be key.
🛡 25 Min Time Frame Chart
🔄 What’s Next? / Bias Direction
Wide trading range remains intact. But here’s the game plan:
📈 Long Setup:Above 24850, watch for strength with targets:→ 24920→ 24980→ 25075
📌 Above 25075, sharp short covering can drive price towards 25222 (Yes, it’s far—but good traders plan ahead, always).
📉 Short Setup:Below 24640–24625, weakness may extend down towards:→ 24500→ 24460
Let price action confirm.
🛡 5 Min Intraday Chart
🥷 Gladiator Strategy Update
Strategy Parameters
ATR: 324.57
IB Range: 151.65 → Medium IB
Market Structure: Balanced
Trade Highlights
✅ 1st Long Trigger: 10:05 AM – Target Achieved (R:R = 1:1.5)
💼 Total Trades: 1
🕯 Daily Time Frame Chart
🔍 Support & Resistance Levels
🔺 Resistance Zones:
24,882
24,920
24,980 ~ 25,000
25,062 ~ 25,070
🔻 Support Zones:
24,768 ~ 24,800
24,660
24,640 ~ 24,625
24,590
24,530 ~ 24,480
24,460
✍️ Final Thoughts
"Volatility doesn’t trap the prepared, it challenges them."
Tomorrow being expiry, let the levels speak. Stay objective, stay adaptive.
✏️ Disclaimer
This is just my personal viewpoint. Always consult your financial advisor before taking any action.

Nifty levels - May 22, 2025Nifty support and resistance levels are valuable tools for making informed trading decisions, specifically when combined with the analysis of 5-minute timeframe candlesticks and VWAP. By closely monitoring these levels and observing the price movements within this timeframe, traders can enhance the accuracy of their entry and exit points. It is important to bear in mind that support and resistance levels are not fixed, and they can change over time as market conditions evolve.
The dashed lines on the chart indicate the reaction levels, serving as additional points of significance to consider. Furthermore, take note of the response at the levels of the High, Low, and Close values from the day prior.
We hope you find this information beneficial in your trading endeavors.
* If you found the idea appealing, kindly tap the Boost icon located below the chart. We encourage you to share your thoughts and comments regarding it.
Wishing you success in your trading activities!

Nifty levels - May 21, 2025Nifty support and resistance levels are valuable tools for making informed trading decisions, specifically when combined with the analysis of 5-minute timeframe candlesticks and VWAP. By closely monitoring these levels and observing the price movements within this timeframe, traders can enhance the accuracy of their entry and exit points. It is important to bear in mind that support and resistance levels are not fixed, and they can change over time as market conditions evolve.
The dashed lines on the chart indicate the reaction levels, serving as additional points of significance to consider. Furthermore, take note of the response at the levels of the High, Low, and Close values from the day prior.
We hope you find this information beneficial in your trading endeavors.
* If you found the idea appealing, kindly tap the Boost icon located below the chart. We encourage you to share your thoughts and comments regarding it.
Wishing you success in your trading activities!

Nfty levels - May 20, 2025Nifty support and resistance levels are valuable tools for making informed trading decisions, specifically when combined with the analysis of 5-minute timeframe candlesticks and VWAP. By closely monitoring these levels and observing the price movements within this timeframe, traders can enhance the accuracy of their entry and exit points. It is important to bear in mind that support and resistance levels are not fixed, and they can change over time as market conditions evolve.
The dashed lines on the chart indicate the reaction levels, serving as additional points of significance to consider. Furthermore, take note of the response at the levels of the High, Low, and Close values from the day prior.
We hope you find this information beneficial in your trading endeavors.
* If you found the idea appealing, kindly tap the Boost icon located below the chart. We encourage you to share your thoughts and comments regarding it.
Wishing you success in your trading activities!
Nifty levels - May 16, 2025Nifty support and resistance levels are valuable tools for making informed trading decisions, specifically when combined with the analysis of 5-minute timeframe candlesticks and VWAP. By closely monitoring these levels and observing the price movements within this timeframe, traders can enhance the accuracy of their entry and exit points. It is important to bear in mind that support and resistance levels are not fixed, and they can change over time as market conditions evolve.
The dashed lines on the chart indicate the reaction levels, serving as additional points of significance to consider. Furthermore, take note of the response at the levels of the High, Low, and Close values from the day prior.
We hope you find this information beneficial in your trading endeavors.
* If you found the idea appealing, kindly tap the Boost icon located below the chart. We encourage you to share your thoughts and comments regarding it.
Wishing you success in your trading activities!

Nifty Analysis EOD - May 14, 2025 - Wednesday🟢 Nifty Analysis EOD - May 14, 2025 - Wednesday 🔴
Day Ends with Directional Uncertainty from Nifty
🔍 Nifty Summary
Nifty opened with a 35-point gap-up, displaying early strength by slowly climbing toward 24,747, which aligned with the critical resistance zone of 24,768–24,800 and the CPR top. But that’s where the rally halted.
From the day’s high, it reversed lower, testing both the Previous Day Low (PDL) and Previous Week High (PWH). Interestingly, the index took support there and managed to close right at the CPR, underlining indecision.
The day was marked by broad consolidation within a 232-point range, with no strong directional follow-through. Price stayed majorly around the CPR zone, signaling a range-bound session with underlying uncertainty.
🕵️ Intraday Walk
☀️ Opened with 35-point gap-up; gradually climbed to 24,747.
🚫 Hit resistance at 24,768–24,800 and reversed.
🔽 Fell to test PDL and PWH zone (24535 area).
🛑 Found support and bounced back to close at CPR.
🔄 A day filled with range-bound movement and no clear trend.
📏 Inside Bar Pattern Watch (Daily Chart)
A 3-day Inside Bar Structure is forming:
📅 May 12: Mother Candle
📅 May 13: Baby candle (ignore 29-point upper wick)
📅 May 14 (Today): Another baby candle within May 13 (ignore 12-point lower wick)
This nested inside bar scenario could trigger a directional breakout soon.
🔼 Upside Levels:
If today’s high (24,767) breaks:Target Zones: 24,800 → 24,882 → 24,940
🔽 Downside Levels:
If today’s low (24,535) breaks:Target Zones: 24,480 → 24,400 → 24,365 → 24,330
🔎 Key Fib Observations
📏 Today’s high (24,747) = ~50% retracement of May 13’s candle → signals rise-on-sell tone
📉 Today’s close (24,640) = ~50% retracement of today’s candle → neutral-to-positive bias
These confluences reflect a tug-of-war between bulls and bears, waiting for a breakout.
🕯 Daily Candle Breakdown
Candle Type: Small-bodied candle inside previous day’s range
Today’s OHLC:▫️ Open: 24,613.80▫️ High: 24,767.55▫️ Low: 24,535.55▫️ Close: 24,666.90 (▲+88.55 / +0.36%)
🔍 Key Observations:
⚠️ No directional expansion, despite higher high & low
✅ Inside bar formation continues
✅ Close at candle midpoint → Neutral, with slight positive bias
📊 Sign of energy build-up for a potential breakout
🛡 Gladiator Strategy Update
Strategy Parameters
ATR: 349.73
IB Range: 169.70 → 📏 Medium IB
Market Structure: ⚖️ Balanced
Trade Highlights
⚠️ No trade triggered
💼 Total Trades: 0
🔢 Support & Resistance Levels
🟩 Resistance Zones:
24,730
24,768 ~ 24,800
24,882
24,980 ~ 25,000
25,100 ~ 25,128
25,180 ~ 25,212
🟥 Support Zones:
24,882
24,800 ~ 24,768
24,730
24,660
24,590
24,530 ~ 24,480
24,461
24,420 ~ 24,400
24,365 ~ 24,330
24,245 ~ 24,240
🔮 What’s Next?
A 3-day Inside Bar Formation generally signals a volatility contraction phase. The tighter the coil, the stronger the potential breakout.
If 24,767 breaks, bulls might regain momentum.If 24,535 fails, we may retest deeper supports from 24,480 downward.
📌 Patience over prediction — let the range resolve.
💬 Final Thoughts
“Inside bars are calm before the storm. Stay alert — breakout decides the next play.”
✏️ DisclaimerThis is just my personal viewpoint. Always consult your financial advisor before taking any action.

Nifty levels - May 15, 2025Nifty support and resistance levels are valuable tools for making informed trading decisions, specifically when combined with the analysis of 5-minute timeframe candlesticks and VWAP. By closely monitoring these levels and observing the price movements within this timeframe, traders can enhance the accuracy of their entry and exit points. It is important to bear in mind that support and resistance levels are not fixed, and they can change over time as market conditions evolve.
The dashed lines on the chart indicate the reaction levels, serving as additional points of significance to consider. Furthermore, take note of the response at the levels of the High, Low, and Close values from the day prior.
We hope you find this information beneficial in your trading endeavors.
* If you found the idea appealing, kindly tap the Boost icon located below the chart. We encourage you to share your thoughts and comments regarding it.
Wishing you success in your trading activities!

Nifty levels - May 14, 2025Nifty support and resistance levels are valuable tools for making informed trading decisions, specifically when combined with the analysis of 5-minute timeframe candlesticks and VWAP. By closely monitoring these levels and observing the price movements within this timeframe, traders can enhance the accuracy of their entry and exit points. It is important to bear in mind that support and resistance levels are not fixed, and they can change over time as market conditions evolve.
The dashed lines on the chart indicate the reaction levels, serving as additional points of significance to consider. Furthermore, take note of the response at the levels of the High, Low, and Close values from the day prior.
We hope you find this information beneficial in your trading endeavors.
* If you found the idea appealing, kindly tap the Boost icon located below the chart. We encourage you to share your thoughts and comments regarding it.
Wishing you success in your trading activities!

Nifty levels - May 13, 2025Nifty support and resistance levels are valuable tools for making informed trading decisions, specifically when combined with the analysis of 5-minute timeframe candlesticks and VWAP. By closely monitoring these levels and observing the price movements within this timeframe, traders can enhance the accuracy of their entry and exit points. It is important to bear in mind that support and resistance levels are not fixed, and they can change over time as market conditions evolve.
The dashed lines on the chart indicate the reaction levels, serving as additional points of significance to consider. Furthermore, take note of the response at the levels of the High, Low, and Close values from the day prior.
We hope you find this information beneficial in your trading endeavors.
* If you found the idea appealing, kindly tap the Boost icon located below the chart. We encourage you to share your thoughts and comments regarding it.
Wishing you success in your trading activities!

Nifty levels - May 09, 2025Nifty support and resistance levels are valuable tools for making informed trading decisions, specifically when combined with the analysis of 5-minute timeframe candlesticks and VWAP. By closely monitoring these levels and observing the price movements within this timeframe, traders can enhance the accuracy of their entry and exit points. It is important to bear in mind that support and resistance levels are not fixed, and they can change over time as market conditions evolve.
The dashed lines on the chart indicate the reaction levels, serving as additional points of significance to consider. Furthermore, take note of the response at the levels of the High, Low, and Close values from the day prior.
We hope you find this information beneficial in your trading endeavors.
* If you found the idea appealing, kindly tap the Boost icon located below the chart. We encourage you to share your thoughts and comments regarding it.
Wishing you success in your trading activities!

Nifty Futures Intraday Trend Analysis for May 08, 2025Based on my analysis, Nifty Futures is likely to exhibit a bearish intraday trend tomorrow, with resistance around 24,500 and strong support near 24,260. This outlook does not factor in potential price gaps in either direction.
Traders are advised to conduct their own technical analysis before initiating any positions. Always trade with a well-defined stop-loss. This information is intended strictly for educational purposes.

Nifty levels - May 08, 2025Nifty support and resistance levels are valuable tools for making informed trading decisions, specifically when combined with the analysis of 5-minute timeframe candlesticks and VWAP. By closely monitoring these levels and observing the price movements within this timeframe, traders can enhance the accuracy of their entry and exit points. It is important to bear in mind that support and resistance levels are not fixed, and they can change over time as market conditions evolve.
The dashed lines on the chart indicate the reaction levels, serving as additional points of significance to consider. Furthermore, take note of the response at the levels of the High, Low, and Close values from the day prior.
We hope you find this information beneficial in your trading endeavors.
* If you found the idea appealing, kindly tap the Boost icon located below the chart. We encourage you to share your thoughts and comments regarding it.
Wishing you success in your trading activities!

NIFTY Wait for a breakout: When the price crosses above the trendline, it could be a bullish signal.
Monitor for a breakdown: If the price breaks below the trendline, it could be a bearish signal.
If you find this helpful and want more FREE forecasts in TradingView, Hit the 'BOOST' button
Drop some feedback in the comments below! (e.g., What did you find most useful?
How can we improve?)
Your support is appreciated!
Now, it's your turn!
Be sure to leave a comment; let us know how you see this opportunity and forecast.
Have a successful week
DISCLAIMER: I am NOT a SEBI registered advisor or a financial adviser. All the views are for educational purpose only
