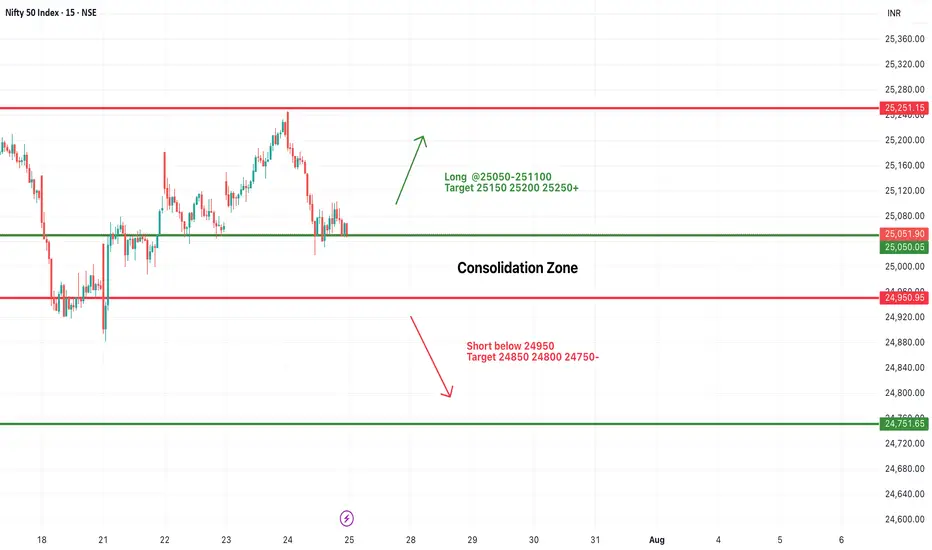
#NIFTY Intraday Support and Resistance Levels - 25/07/2025Nifty is expected to open with a slight gap-down and is currently trading within a tight consolidation zone between 24,950 and 25,050. This narrow 100-point range has acted as a critical zone over the past sessions, indicating indecision and low conviction among traders.
A sustained move above 25,050–25,100 may provide a long opportunity with potential upside targets of 25,150, 25,200, and 25,250+. Strong bullish momentum will only be confirmed if Nifty manages to close above 25,250, which may push the index further toward 25,350–25,400 in the coming days.
On the other hand, a breakdown below 24,950 will shift the bias toward bearishness. A short setup could then target 24,850, 24,800, and 24,750- levels.
Until then, expect sideways price action between 24,950 and 25,050. Traders should wait for a breakout or breakdown before entering fresh trades. Avoid aggressive entries inside this tight band.
Niftytradesetup
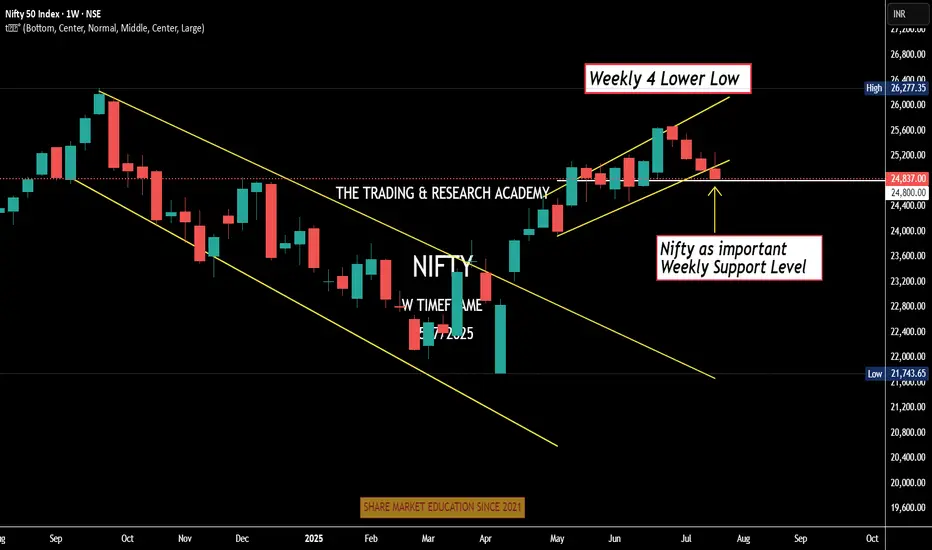
Weekly Nifty Analysis Next week, can we have a small bounce in #Nifty?
4 Lower Low
Daily channel Breakdown
Index at crucial weekly support level
Can one bullish week / Doji be expected. One news here or there & boom!
We have monthly expiry this week, let's see.
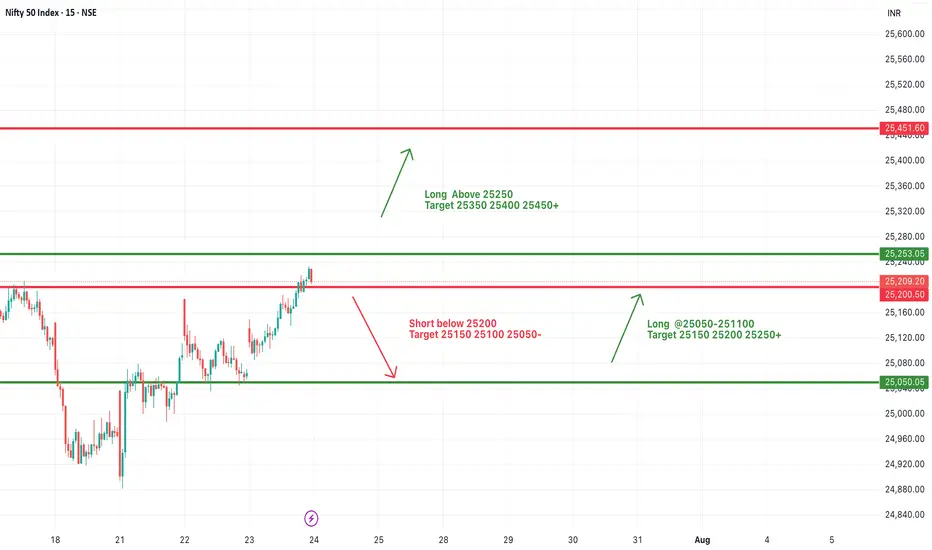
#NIFTY Intraday Support and Resistance Levels - 24/07/2025Nifty is expected to open with a bullish gap-up today, breaching the 25,250 resistance zone. This level has been acting as a consolidation ceiling in recent sessions, and today’s opening above it indicates strong buying momentum in the market.
If Nifty sustains above 25,250, we may witness a fresh upside rally towards the immediate targets of 25,350, 25,400, and 25,450+. A decisive breakout above this zone would mark the continuation of the upward trend and may attract aggressive long-side participation.
On the downside, if Nifty slips and sustains below 25,200–25,250, weakness could resume. A break below 25,200 may lead to a correction toward 25,150, 25,100, and possibly even 25,050-, which will now act as a crucial support zone.
Overall, today's session may remain bullish above 25,250 with momentum trades favored on the long side.
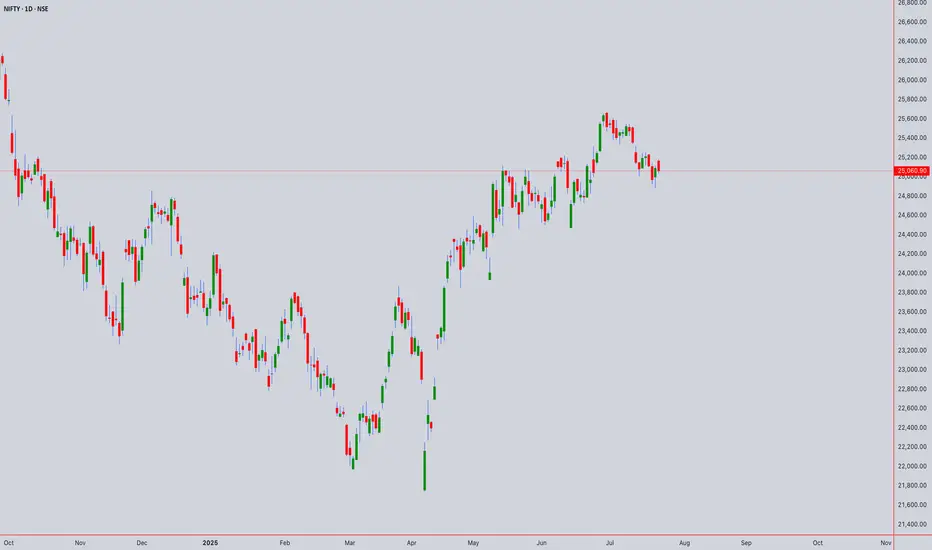
Comprehensive Technical Analysis: NIFTY50 ₹25060.90 as of 22/07Long-Term (Monthly/Weekly) - SWING PERSPECTIVE
Trend & Structure:
Elliott Wave:
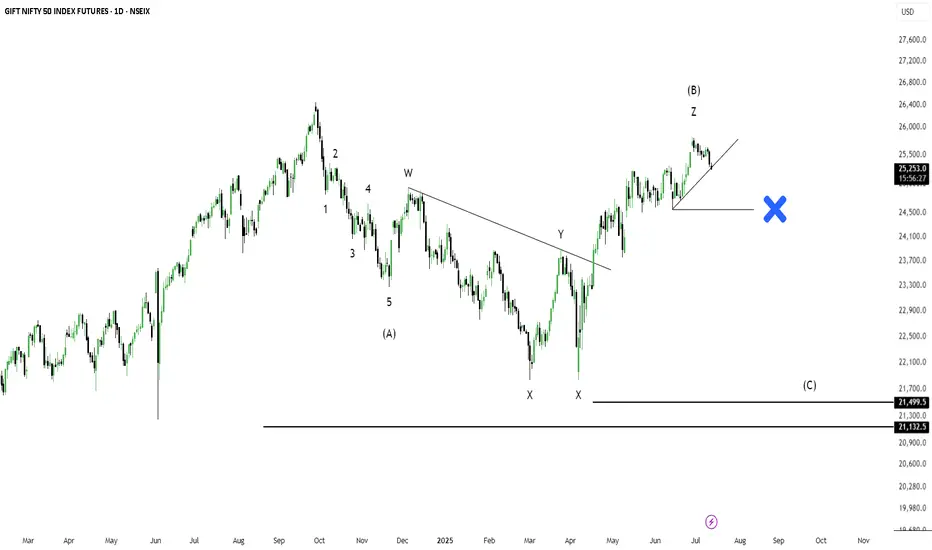
Primary Trend: Bullish (Wave 3 or 5 ongoing since 2023).
Current Phase: Likely final sub-wave (Wave 5) targeting ₹25,800–26,200.
Risk: Completion of Wave 5 may trigger a 10–15% correction (ABC pattern) toward ₹22,500–23,000 (38.2% Fib retracement).
Wyckoff & Volume:
Accumulation/Distribution: Monthly volume declining near highs → early distribution signals.
Key Level: Close below ₹24,800 confirms distribution phase (bearish reversal).
Gann Analysis (Price-Time Squaring):
Square of 9:
Key Resistance: ₹25,317 (√25,060 ≈ 158.3; 158.5² = 25,132 → 159² = 25,281).
Major Support: ₹24,649 (157.5²), ₹24,000 (psychological + Gann 45° angle).
Time Cycle:
Aug-Sep 2025 critical for reversal (90-day cycle from April 2025 high).
Ichimoku (Weekly):
Kumo Cloud: Price above cloud → bullish bias.
Lagging Span (Chikou): Above price (26 weeks back) → no congestion.
Warning: Tenkan (9) below Kijun (26) on weekly → momentum loss.
Moving Averages (Weekly):
Bullish Stacking: EMA(20) > EMA(50) > SMA(100) → trend intact.
Support: EMA(20) at ₹24,200
Medium-Term (Daily/4H) - SWING ENTRY
Candlestick Patterns:
Daily: Doji/Spinning Top near ₹25,060 → indecision.
4H: Bearish Shooting Star → resistance at ₹25,150–25,200.
Harmonic Patterns:
Bullish Bat potential (PRZ: ₹24,600–24,750).
Bearish Crab if price rejects ₹25,300 (PRZ: ₹25,280–25,350).
Gann Angles:
1x1 Angle Support (from June 2025 low): ₹24,900 (break → accelerates selling).
Price-Time Squaring:
24th July = 180° from Jan 2025 low → watch for volatility.
RSI + Bollinger Bands (Daily):
RSI(14): 68 (neutral-bearish divergence → weakening momentum).
BB(20,2): Price near upper band (₹25,200) → overbought.
VWAP (4H): Price above VWAP → intraday bullish, but divergence at highs.
Intraday (1H/30M/15M/5M)
Ichimoku (1H):
Tenkan (9) > Kijun (26): Bullish.
Kumo Twist: Support at ₹24,950 (cloud top).
Sell Signal: If price breaks below Kijun (₹25,010).
Moving Averages (30M):
EMA(20): ₹25,040 (intraday support).
Death Cross: EMA(20) < SMA(50) on 15M → short-term bearish.
RSI + BB (15M):
RSI(14): 72 → overbought.
BB Squeeze: Bands narrowing → expect breakout (bearish bias below VWAP).
Gann Intraday Levels (5M):
Resistance: ₹25,100 (1x1 angle), ₹25,180 (2x1).
Support: ₹24,980 (1x1 downside), ₹24,920 (2x1).
Synthesis & Trading Plan
Bullish Scenario (Swing):
Trigger: Hold above ₹24,900 (Gann 1x1) + RSI > 60 on weekly.
Target: ₹25,800–26,200 (Wave 5, Gann Square 159²).
Stop Loss: ₹24,650 (Harmonic Bat PRZ).
Bearish Reversal (Intraday/Swing):
Trigger: Close below ₹24,950 (Ichimoku cloud) + RSI < 50.
Target: ₹24,600 (Harmonic Bat), ₹24,000 (monthly SMA).
Stop Loss: ₹25,200 (Bollinger upper band).
Intraday Levels (23rd July):
Resistance Support
₹25,100 (1H VWAP) ₹25,000 (psych)
₹25,180 (Gann 2x1) ₹24,950 (Ichimoku)
₹25,280 (Sq9) ₹24,800 (daily pivot)
Key Risk Factors
Gann Time Cycle: 24–28 July = high volatility (price-time square).
Elliott Terminal Wave: Wave 5 exhaustion → strict stop losses.
VWAP Divergence: Failure to hold above VWAP on 4H → short.
Instrument: NIFTY50
Strategy:
Swing: Wait for daily close above ₹25,150 (confirms bullish) or below ₹24,800 (bearish).
Intraday: Sell rallies to ₹25,100–25,150 (RSI>70, BB squeeze) for ₹24,950.
Verified Tools:
Gann Square of 9 + Ichimoku for precision entries.
RSI/BB for overbought/oversold filters.
For those interested in further developing their trading skills based on these types of analyses, consider exploring the mentoring program offered by Shunya Trade.(world wide web shunya trade)
I welcome your feedback on this analysis, as it will inform and enhance my future work.
Regards,
Shunya Trade
world wide web shunya trade
⚠️ Disclaimer: This post is educational content and does not constitute investment advice, financial advice, or trading recommendations. The views expressed here are based on technical analysis and are shared solely for informational purposes. The stock market is subject to risks, including capital loss, and readers should exercise due diligence before investing. We do not take responsibility for decisions made based on this content. Consult a certified financial advisor for personalized guidance.
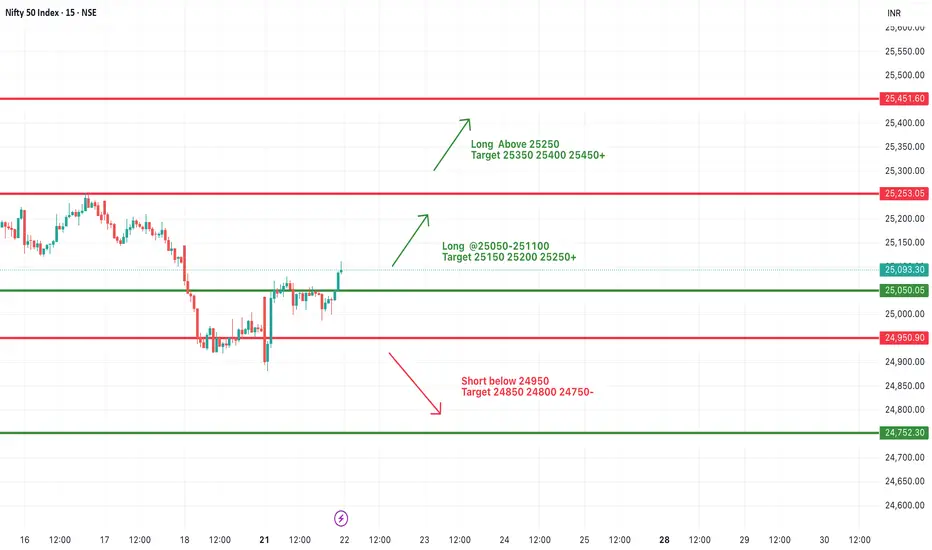
#NIFTY Intraday Support and Resistance Levels - 22/07/2025Today, Nifty is expected to open slightly gap-up, indicating positive early sentiment. After breaking out from the previous day’s consolidation zone, the index has shown strength around the 25,050 level, which will now act as an important intraday support. If this level is held during the early session, we can expect further upside continuation.
A move above the 25,050–25,100 zone can trigger upward momentum with potential targets at 25,150, 25,200, and 25,250+. Sustained strength above 25,250 will open the door for further bullish moves toward 25,350, 25,400, and 25,450+, making it a favorable long scenario for trending market conditions.
However, if the index fails to hold above the 25,050 level and starts trading back below 24,950, it may again enter a bearish territory. In such a case, downside targets of 24,850, 24,800, and 24,750- are possible, indicating weakness and reversal from resistance.
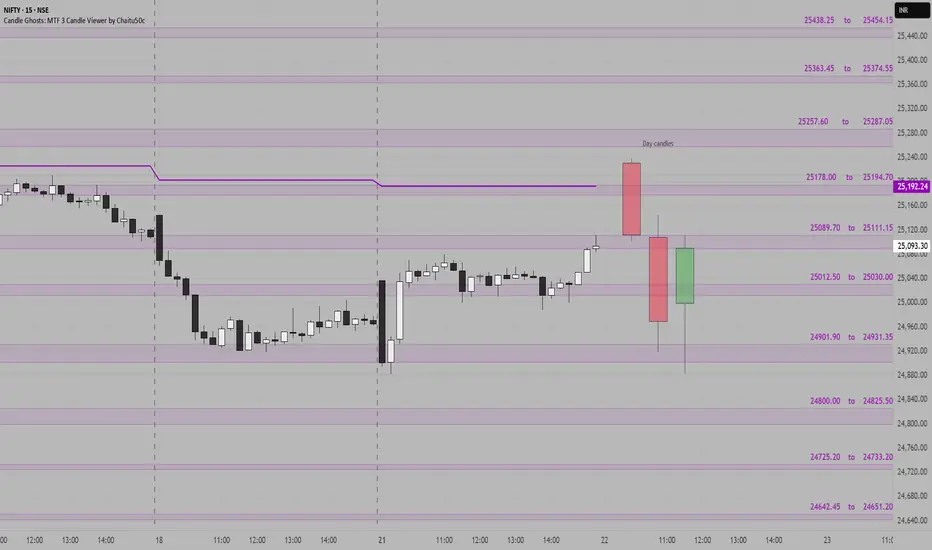
NIFTY SUPPORT & RESISTANCE ZONES FOR 22-07-2025Nifty Support & Resistance Zones for Tomorrow 22-07-2025
Based on price cluster analysis and recent market structure, the following key support and resistance levels have been identified for the upcoming session:
Resistance Zones:
25438.25 – 25454.15
25363.45 – 25374.55
25257.60 – 25287.05
25178.00 – 25194.70
25089.70 – 25111.15
Support Zones:
25012.50 – 25030.00
24901.90 – 24931.35
24800.00 – 24825.50
24725.20 – 24733.20
24642.45 – 24651.20
These levels are derived from high-probability zones where price has shown repeated interaction in the recent past. Watch how Nifty reacts at these zones for potential breakout, reversal, or pullback setups.
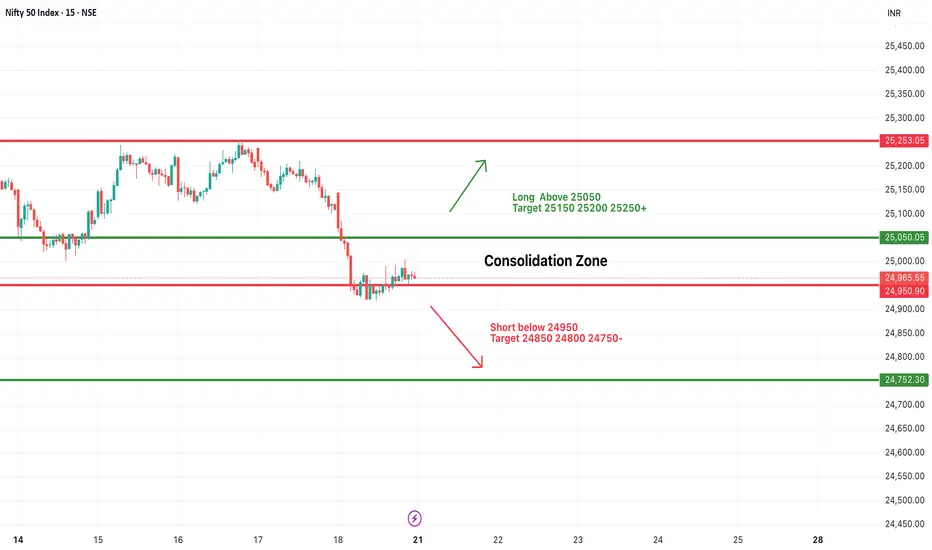
#NIFTY Intraday Support and Resistance Levels - 21/07/2025Nifty is likely to start the day with a flat opening, as current price action is indicating a consolidation phase near the lower range. The zone between 24,950–25,050 is acting as a key area of indecision, where prices are stuck in a tight range, showing a lack of clear momentum. This consolidation could lead to a breakout or breakdown depending on how the index reacts at key levels.
If Nifty sustains above 25,050, it may trigger a short-term upward move, breaking the consolidation phase. In such a scenario, an upside rally towards 25,150, 25,200, and 25,250+ levels can be expected, making it a favorable long setup for intraday traders.
On the contrary, if the index slips below 24,950, the selling pressure may increase, and downside momentum can accelerate. A breakdown here could pull the index towards support levels of 24,850, 24,800, and even 24,750-, which would confirm bearish strength.
Traders are advised to avoid aggressive positions within the consolidation zone and wait for a breakout or breakdown for directional trades. Quick entries with partial profit booking at every level and strict stop-losses are recommended to manage risk efficiently in today’s range-bound environment.
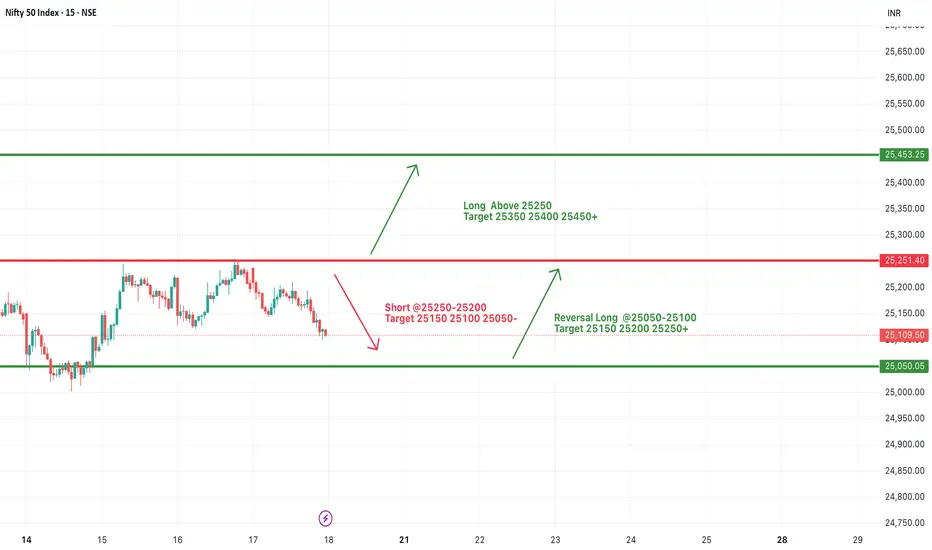
#NIFTY Intraday Support and Resistance Levels - 18/07/2025Nifty is likely to open slightly gap-up today near the 25100–25150 zone. There are no major changes from yesterday’s levels, so the same trading levels remain in focus for today’s session. If Nifty sustains above the 25250 level, we can expect an upside move toward 25350, 25400, and even 25450+ levels. This area remains a crucial resistance zone for potential bullish continuation.
On the downside, if Nifty fails to cross and sustain above 25250 and breaks below the 25200–25250 zone, we may witness a downward move with possible targets at 25150, 25100, and 25050.
A reversal long opportunity may arise in the 25050–25100 support zone if the market finds buying interest after a dip. From this level, we can expect targets around 25150, 25200, and 25250+.
The index is trading in a tight range with no fresh cues. Avoid aggressive entries and stick to level-based trades with strict stop-loss and partial profit booking.
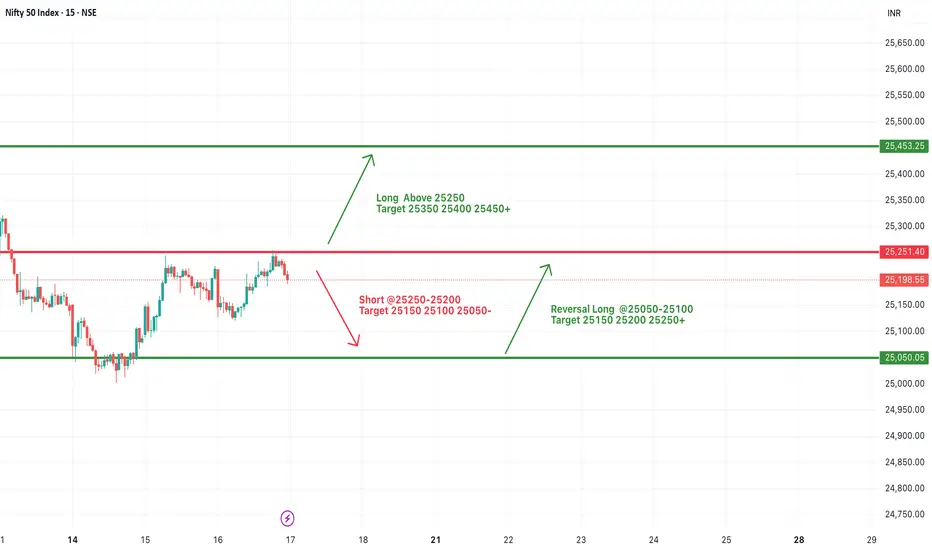
#NIFTY Intraday Support and Resistance Levels - 17/07/2025Opening Expectation: Slight Gap-Up Around 25200
Nifty is likely to open slightly gap-up near the 25200 level, showing early signs of strength. If the index manages to sustain above the 25250 level, we may see a continuation of the upward momentum with targets around 25350, 25400, and 25450+. This zone marks the upper resistance, and a breakout with strong volume could push prices into a bullish trend for the session.
On the other hand, if Nifty faces rejection around 25250–25200 and begins to slide, a short opportunity opens up with downside targets at 25150, 25100, and 25050. Sustained weakness below these levels could intensify selling pressure. However, in case the index reverses and bounces from the 25050–25100 zone, a quick intraday long trade can be considered toward 25150, 25200, and 25250+.
Today’s bias remains slightly positive, but the session may remain volatile between key levels. Traders should focus on price action around the 25250 resistance and use trailing stop losses with strict risk control.
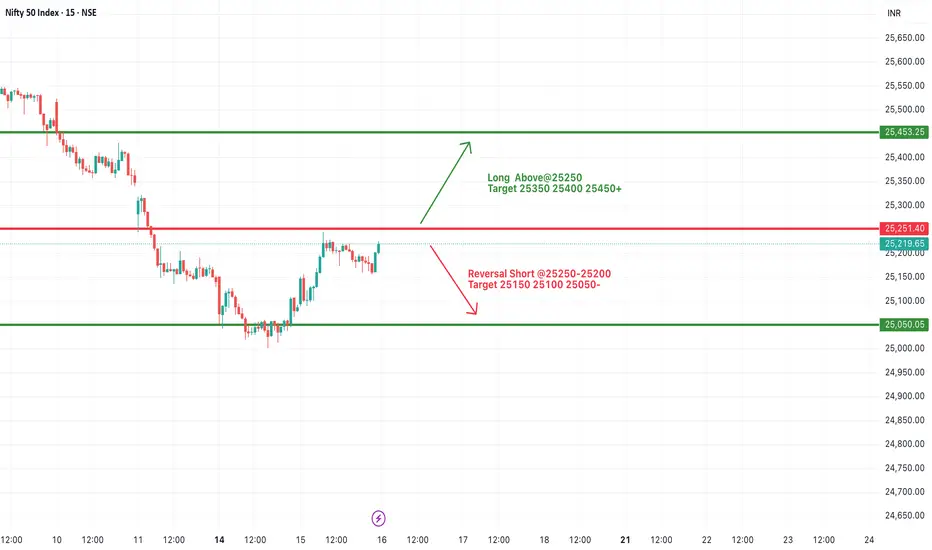
#NIFTY Intraday Support and Resistance Levels - 16/07/2025Nifty is likely to open flat near the 25200 mark, with the index currently hovering just below a key resistance zone of 25250. A decisive breakout above 25250 may provide momentum for a further upside rally toward 25350, 25400, and possibly 25450+. This level has acted as resistance in the past, so sustaining above it will be crucial for any bullish continuation.
On the flip side, 25250–25200 is also a potential reversal zone. If Nifty fails to break and sustain above it, then sellers may take control, and the index could see a pullback toward the immediate support levels of 25150, 25100, and 25050.
Since the index is near a crucial breakout/rejection point, early session price action will determine the direction.
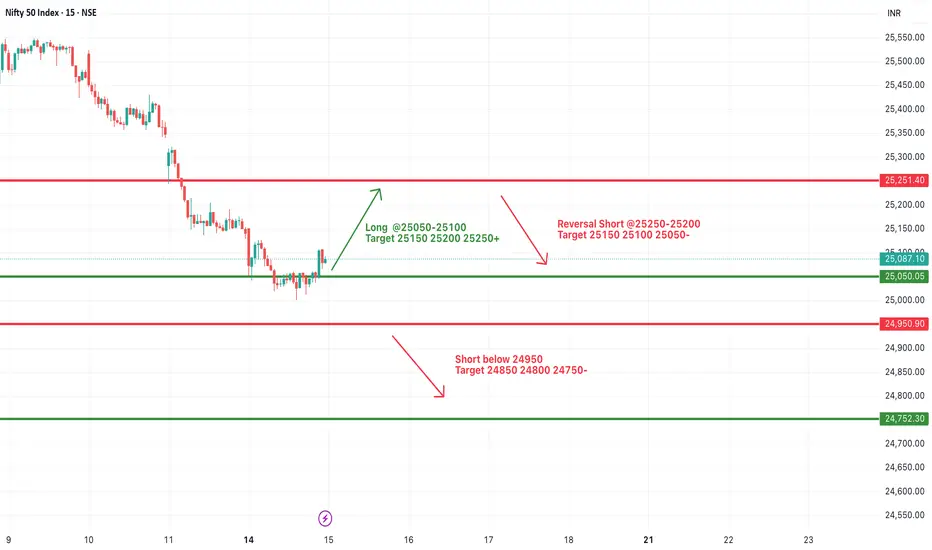
#NIFTY Intraday Support and Resistance Levels - 15/07/2025Nifty is expected to open with a gap-up today near the 25050–25100 zone. If the index sustains above this level after the opening, bullish momentum could follow with potential upside targets of 25150, 25200, and 25250+. This zone will act as the key intraday support-turned-demand area.
However, if Nifty struggles to hold above 25200–25250 and shows signs of reversal from this zone, we might witness selling pressure. A rejection from this region could lead to a pullback toward 25150, 25100, and 25050 levels.
On the downside, a breakdown below 24950 will signal further weakness. If that level is breached decisively, it can lead to sharp downside movements toward 24850, 24800, and even 24750. This would indicate a reversal of early bullish sentiment.
Today’s session could remain volatile around key levels. It’s advisable to watch price action around the 25050–25250 range for intraday confirmation before taking directional trades.
NIFTY 24740: Smart Money Signals Bearish Move IncomingThe directional bias is clear – bearish – and I'm currently waiting for a precise setup to present itself. Based on the Smart Money Concept, we could be looking at a potential short opportunity around the 24740 zone.
📍 Once the setup is confirmed, I’ll be sharing the exact entry and stop-loss levels with you.
Stay tuned – patience here is key. Let the market come to us.

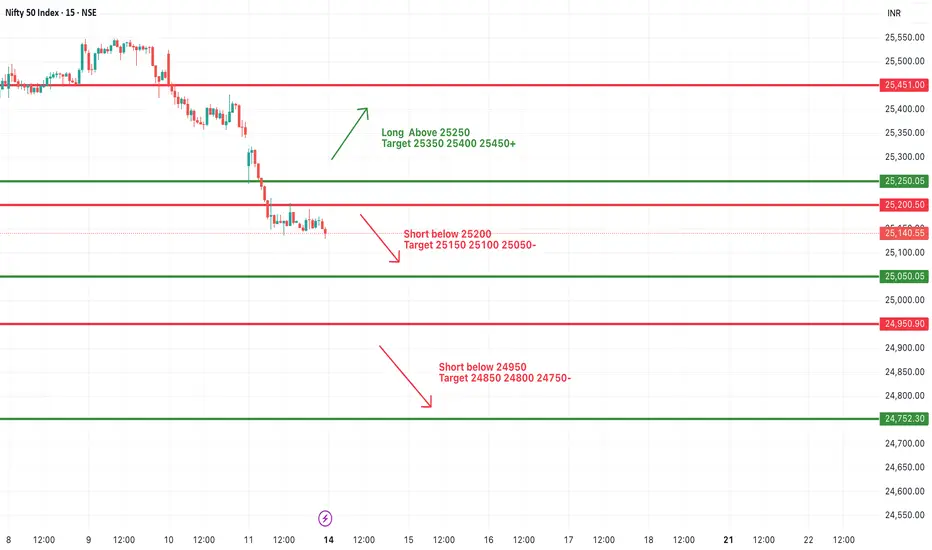
#NIFTY Intraday Support and Resistance Levels - 14/07/2025Nifty is expected to open slightly gap-down after consistent bearish momentum in the previous sessions. The index is hovering near 25140, and immediate support lies around the 25200 level. A breakdown below this level could lead to further downside pressure, with key support targets at 25150, 25100, and 25050.
If the index breaks and sustains below 24950, it may trigger a deeper correction toward the next support levels at 24850, 24800, and 24750. These zones should be watched closely for potential reversals or continuation of bearish momentum.
On the upside, any recovery and sustained move above the 25250 level may lead to a pullback rally. In that scenario, immediate resistance levels to watch would be 25350, 25400, and 25450+.
Intraday structure remains weak unless Nifty reclaims the 25250+ zone with strength. Price action near the 25200–25050 support range will be crucial in deciding the direction of the day.
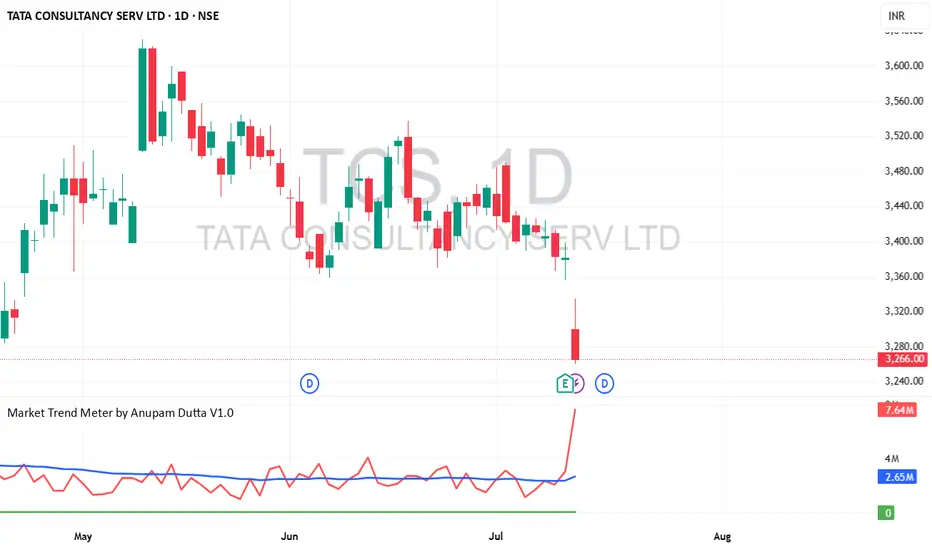
TCS Long Opportunity - Medium-Term Swing Trade📈 TCS Long Opportunity – Medium-Term Swing Trade
🔹 Entry : ₹3266 (Last Close)
🔹 Target : ₹3525
🔹 Qty : Up to 25 shares
🔹 Timeframe : ~6 months
🔹 Estimated ROI : ~16.49% annualized
A moderate-risk swing setup on Tata Consultancy Services . Technically and fundamentally aligned for gradual upside, assuming market conditions stay favorable. Entry near current levels with a well-defined target.
⚠️ Trade only if you're comfortable with the risk of capital loss. Position sizing is key.
NIFTY 1. Rectangle Box (Sideways Zone)
Nifty had earlier made a strong range-bound consolidation around 24,400 -25,000.
This has now become a strong support zone (red shaded area).
2. Breakout & Retest Pattern:
Nifty then broke out of this zone and went to around 25,600.
Now it is retesting the same old resistance (now support).
3. Price Action Zones:
Support Zone: 24,950 25,100
Resistance Zone: 25,600 - 25,800
If you find this helpful and want more FREE forecasts in TradingView, Hit the 'BOOST' button
Drop some feedback in the comments below! (e.g., What did you find most useful?
How can we improve?)
Your support is appreciated!
Now, it's your turn!
Be sure to leave a comment; let us know how you see this opportunity and forecast.
Have a successful week
DISCLAIMER: I am NOT a SEBI registered advisor or a financial adviser. All the views are for educational purpose only

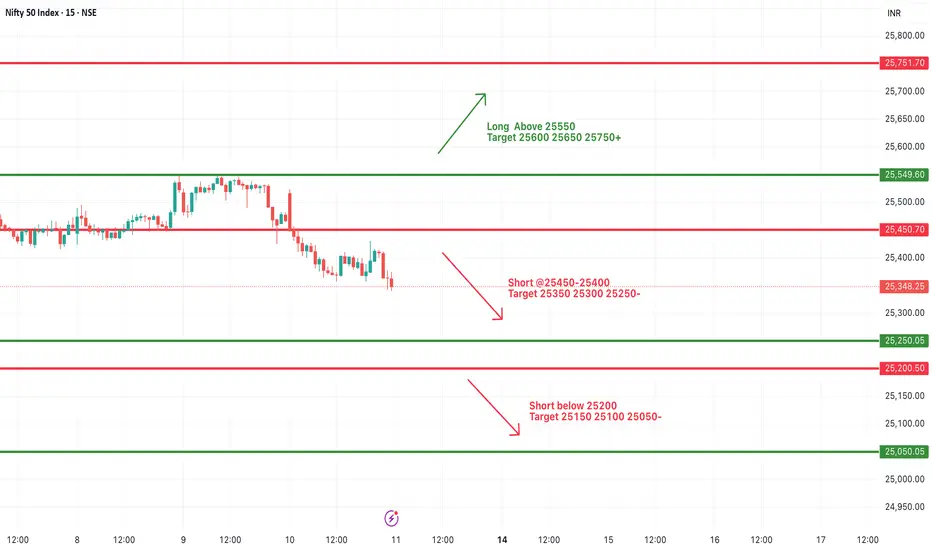
#NIFTY Intraday Support and Resistance Levels - 11/07/2025Nifty is likely to open on a flat note today, continuing the weakness seen in the recent sessions. The index has shown a consistent downward move after facing resistance near the 25550 zone. If Nifty sustains below the 25450–25400 range, it may trigger further bearish momentum with immediate targets at 25350, 25300, and 25250. Breaching 25200 could lead to further downside toward 25150, 25100, and 25050 levels.
On the other hand, any sharp reversal and breakout above 25550 may revive bullish sentiment. Sustaining above this level can push the index toward 25600, 25650, and 25750+. However, upside movement will require strong buying interest and volume support.
Overall, the broader trend remains weak unless a clear breakout occurs. Traders are advised to trade with caution, wait for directional confirmation, and use strict stop-loss to manage risks in this volatile environment.
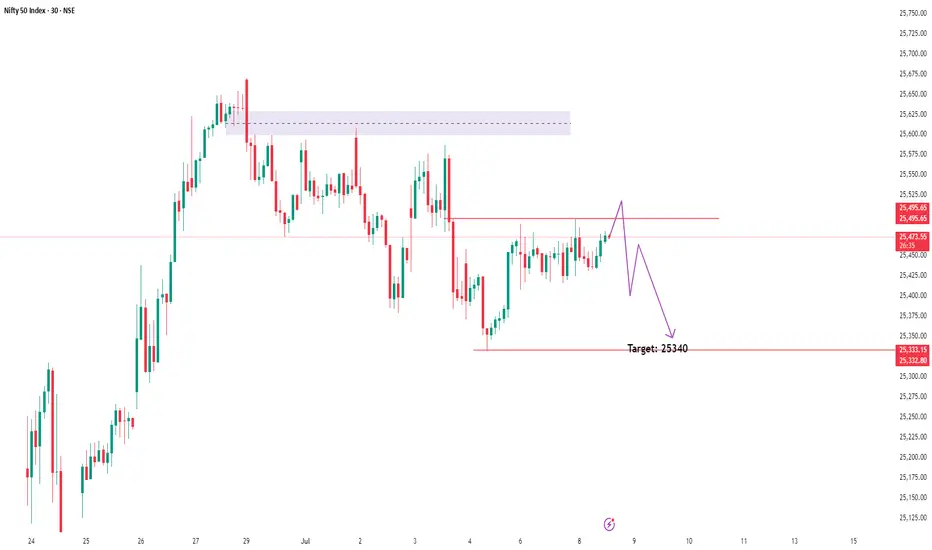
Almost There: Nifty Closing in on My Target Zone 25340In this update, I’m revisiting the setup I shared earlier that points towards NIFTY’s next potential target at 25,340. The analysis covers the key levels, price action structure, and the factors supporting this move. This setup is based on clear technical confirmations and disciplined risk management — not just speculation.
Please remember to follow your own plan and manage your trades responsibly. This is for educational purposes and not financial advice. Let’s see how the price action unfolds!
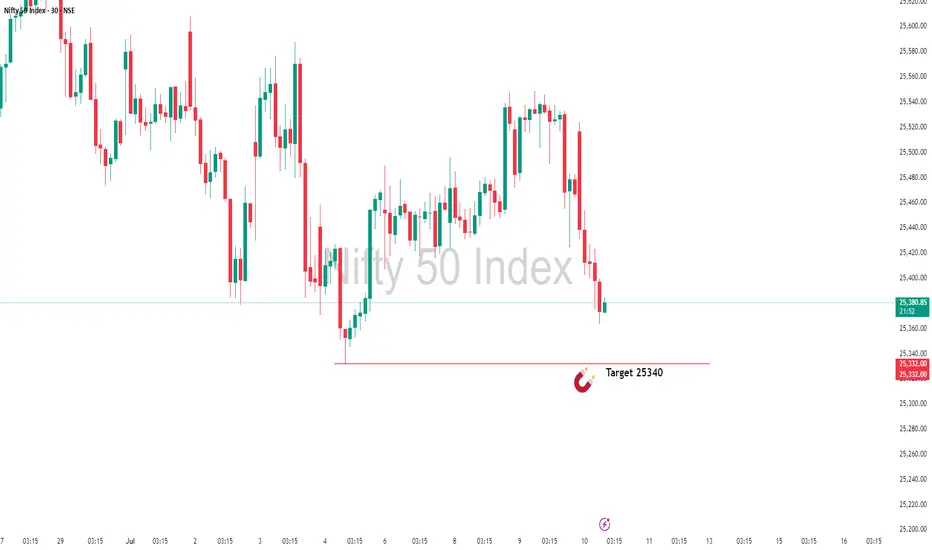
Bearish Outlook on Nifty – Based on Smart Money ConceptI'm seeing a clear downside setup on Nifty, with Smart Money indicating distribution and the market transitioning into a bearish trend.
📉 Target: 25,340
📍 Current Price: 25,474
🔍 Reasoning: Clear signs of institutional distribution and lower highs/lows forming. Smart Money is exiting, suggesting the beginning of a deeper correction.
Will monitor closely for any change in structure, but as of now, bias remains strongly bearish.
AMBUJA CEMENT FOR SWINGA Good opportunity in Ambuja Cement for swing trade, weekly resistance break and retesting, so add in your watchlist.

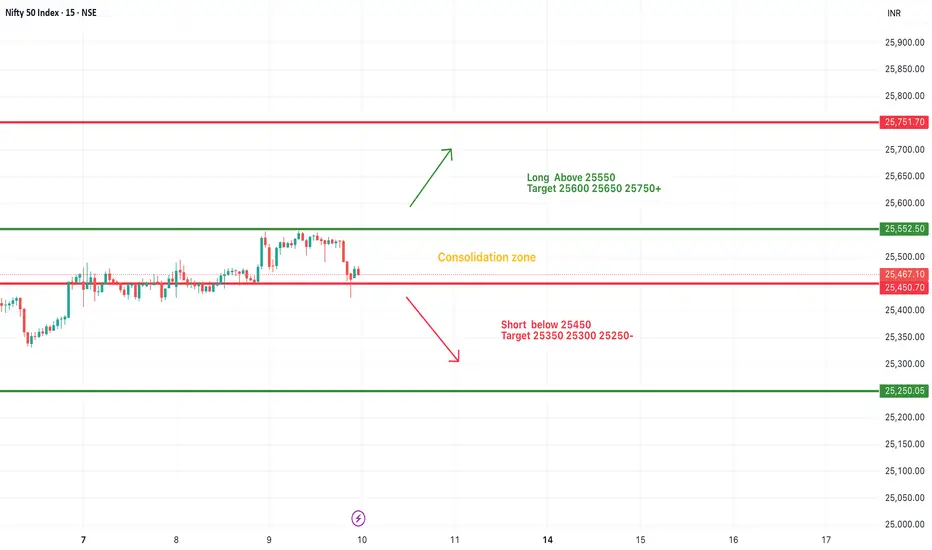
#NIFTY Intraday Support and Resistance Levels - 10/07/2025Nifty is also expected to open flat today, reflecting a similar consolidation pattern observed in recent sessions. The index continues to trade within a tight range, signaling indecisiveness among traders and lack of strong directional momentum.
Currently, Nifty is oscillating in a consolidation zone between 25550 resistance and 25450 support. A breakout above 25550 could trigger fresh long entries, with potential upside targets at 25600, 25650, and 25750+. Sustained strength above 25750 may open the way for extended bullish movement.
Conversely, a breakdown below the 25450 level may lead to short opportunities, with downside targets at 25350, 25300, and 25250-.
Until the index decisively breaks out of this range, sideways movement is likely to persist. Traders should wait for confirmation before taking aggressive directional positions.
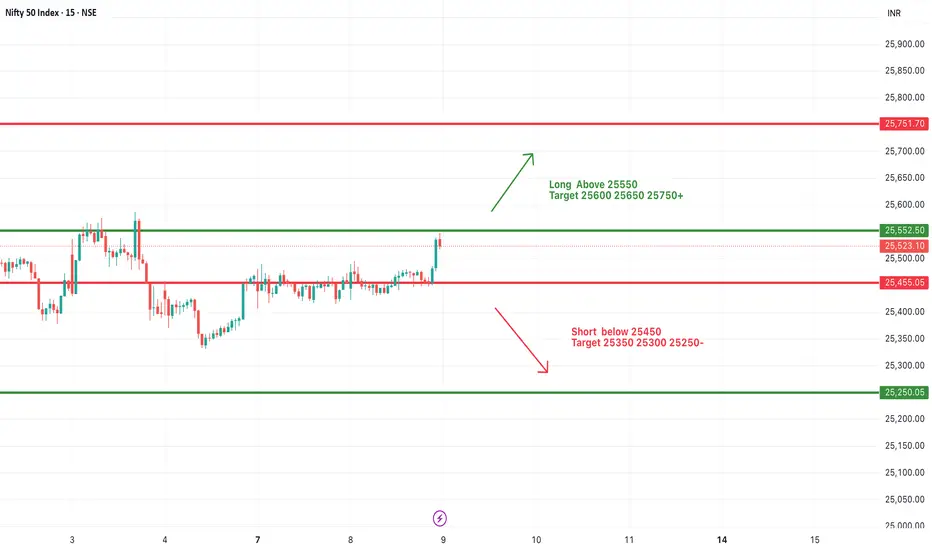
#NIFTY Intraday Support and Resistance Levels - 09/07/2025Nifty is expected to open slightly gap up around the 25500–25520 zone, showing positive momentum from the previous day’s breakout above its recent consolidation range. If the index sustains above the 25550 level, we can expect bullish continuation toward the upside targets of 25600, 25650, and 25750+ levels. This zone may act as an intraday breakout trigger.
On the downside, 25450 will now act as immediate support. Any sharp move below 25450 could invite selling pressure, and we may see a downside slide toward 25350, 25300, and 25250-. The trend remains mildly bullish above 25550, while below 25450 the trend may turn weak intraday.
#NIFTY Intraday Support and Resistance Levels - 08/07/2025Nifty is expected to open flat with no major change in the overall levels compared to the previous session. The index continues to hover near a crucial resistance zone around 25450–25500. A breakout above 25550 will indicate bullish strength and may lead to an upward move toward 25600, 25650, and even 25750+. This zone has been tested multiple times, and a decisive break can attract further buying.
On the downside, the support remains at 25450. A break below this level can invite selling pressure, with immediate targets at 25350, 25300, and 25250-. The market is clearly respecting this consolidation band, so any directional move will depend on a confirmed breakout or breakdown from these levels.
Traders should remain cautious and avoid early entries unless a clean move is seen beyond the 25550 or below the 25450 levels.
