NIFTY : Trading Levels for 22-11-2024Nifty Trading Plan for 22-Nov-2024
Introduction:
In the previous session, With a Opening Drop in Nifty displayed a consolidation pattern near the support zone with a lack of strong follow-through on either side. The index closed near 23,346.75, hinting at indecision among traders. Key levels have been identified for today's trading, with distinct zones marked: Yellow for sideways movements, Green for bullish trends, and Red for bearish trends.
Trading Scenarios for 22-Nov-2024:
Gap-Up Opening (100+ points):
If Nifty opens above 23,414 , it will likely face resistance near 23,522 . Look for price action in this zone:
If rejection occurs at 23,522 , a retracement towards the 23,414 level is possible, offering a shorting opportunity.
If an hourly candle sustains above 23,522 , it can target the next resistance at 23,669 .
Wait for clear breakouts or rejections before entering trades. Avoid chasing prices in a strong gap-up scenario to minimize risk.
Flat Opening:
In case of a flat opening near 23,346 , monitor the immediate support at 23,295 :
A breakdown below 23,295 can lead to a bearish move towards 23,231 .
If Nifty holds the 23,346 level and moves above 23,414 , a bullish momentum toward 23,522 is likely.
Trade cautiously in the flat opening zone, as the initial price action might remain range-bound.
Gap-Down Opening (100+ points):
If Nifty opens below 23,231 , the 23,120 support zone will be crucial:
A breach of 23,120 could trigger a sharp sell-off towards 22,986 .
If prices reverse from the 23,120 level, expect a recovery rally back to 23,231 or 23,295 .
Watch for rejection or reversal candlestick patterns at these levels before entering trades.
Risk Management Tips for Options Trading:
Avoid trading during the first 15 minutes of market opening to let volatility settle.
Use defined stop losses based on hourly candle closings.
Focus on at-the-money options for higher liquidity and better premiums.
Limit your risk to 1-2% of your total trading capital per trade.
Summary and Conclusion:
The market's direction today hinges on how it reacts to key levels around 23,414 (resistance) and 23,295 (support). Keep an eye on broader trends and ensure to wait for confirmation signals before initiating trades. Practice strict risk management to safeguard against market volatility.
Disclaimer: I am not a SEBI-registered analyst. The above analysis is for educational purposes only. Please consult your financial advisor before making any investment or trading decisions.
Niftytradesetup

#NIFTY Intraday Support and Resistance Levels - 21/11/2024Flat opening expected in nifty in between consolidation zone of 23450-23550 level. After opening if any side breakout of this zone can gives strong rally towards the breakout direction. If nifty starts trading below 23450 level then strong downside expected in nifty upto 23200 level. Further bullish rally only expected if nifty sustain above 23550 level.

NIFTY : Trading Levels and Plan for 21-Nov-2024Nifty Trading Plan for 21-Nov-2024
Intro:
On 20-Nov-2024, Nifty displayed a volatile session, with the index struggling to sustain above 23,712 , the last intraday resistance. A yellow-shaded "No Trade Zone" highlighted indecisive price action between 23,561 and 23,622 . The index tested support near 23,296 , which aligns with an SMC entry zone and buyer’s support after a liquidity sweep. The green trend depicted potential bullish moves, while the red trend reflected bearish reversals, helping traders prepare for possible outcomes in the upcoming session.
Trading Plan for 21-Nov-2024:
Gap Up Opening (100+ points above 23,561):
If Nifty opens above 23,622 , monitor for a breakout above 23,712 . Sustained movement here could target the Profit Booking Zone (23,815–23,860) .
Wait for the first 15–30 minutes to gauge market direction.
Failure to hold above 23,622 might indicate a reversal, pushing the index back into the "No Trade Zone."
Flat Opening (Near 23,561):
A flat opening within the "No Trade Zone" requires patience. Look for a breakout above 23,622 to go long, targeting 23,712 .
A breakdown below 23,468 may trigger bearish momentum toward 23,296 or lower.
Avoid entering trades in the yellow-shaded zone to reduce risk from whipsaws.
Gap Down Opening (100+ points below 23,468):
A gap down below 23,441 may result in bearish momentum towards 23,296 , where buyers could provide support.
If 23,296 holds, watch for a pullback toward 23,468 or higher.
A breakdown below 23,296 could open doors to deeper bearish moves, targeting 22,964 . Use tight stop-losses for short positions.
Risk Management Tips for Options Traders:
Use stop-losses based on the hourly candle close to avoid getting trapped by intraday volatility.
Avoid trading large positions in the "No Trade Zone"; focus on directional confirmation.
For gap openings, consider strategies like spreads to manage premiums and volatility.
Limit risk to 1–2% of your capital per trade to safeguard against sudden market moves.
Summary and Conclusion:
Key levels to watch are 23,712 on the upside and 23,296 on the downside.
Trade cautiously within the "No Trade Zone" ( 23,561 – 23,622 ).
Let the price action guide your trades, with trends expected to be influenced by intraday volatility.
Disclaimer:
I am not a SEBI-registered analyst. This trading plan is for educational purposes only. Traders are advised to conduct their analysis or consult a financial advisor before making any trading decisions.

#NIFTY Intraday Support and Resistance Levels - 19/11/2024Gap up opening expected near 23550 level in nifty. After opening if it's starts trading and sustain above 23550 level then strong bullish rally expected. 23450-23550 levels are the consolidation range for nifty. Downside movement expected below 23450 level and this rally can goes upto 23200 level in case nifty starts trading below 23450 level.

NIFTY : Trading Levels and Plan for 19-Nov-2024Trading Plan for 19-Nov-2024
Intro: Previous Day’s Chart Analysis
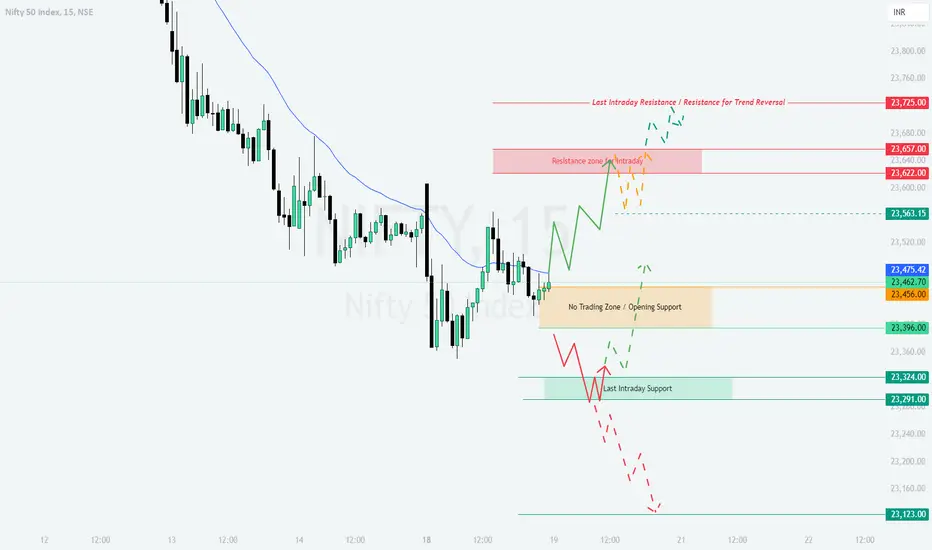
On 18-Nov-2024, the market exhibited a mix of bullish recovery and consolidation. Yellow regions indicated sideways movement, suggesting indecision in the market. Green zones demonstrated bullish recovery attempts, while Red zones highlighted bearish breakdown scenarios. Intraday resistance at 23,725 played a key role in limiting gains, while support at 23,324 helped prevent a deeper sell-off.
Gap-Up Opening Scenario (+100 Points or More):
If Nifty opens around 23,600–23,700 , look for rejection near the resistance zone at 23,657 . Wait for a confirmation candle before entering short positions, targeting the 23,456 support.
If momentum sustains above 23,657 , expect bullish continuation towards 23,725 . Initiate longs after a retest of 23,657 , with a stop loss at 23,600 .
Avoid initiating trades if Nifty stays within 23,657–23,725 without a clear breakout or breakdown.
Flat Opening Scenario (+/- 50 Points):
A flat open near 23,462–23,475 would place the market in the No Trading Zone . Observe price action in this zone to gauge direction.
If the index breaks below 23,456 , short with targets at 23,396 and 23,324 , maintaining a stop loss at 23,475 .
For bullish setups, a breakout above 23,475 could lead to a move toward 23,657 , with stop losses placed at 23,450 .
Gap-Down Opening Scenario (-100 Points or More):
If Nifty opens near 23,324–23,350 , monitor for a pullback to 23,396 . Short positions can be initiated on rejection at 23,396 , targeting 23,291 and 23,123 .
A strong recovery above 23,396 could indicate bullish reversal potential. Longs can be considered after confirmation, with targets at 23,475 .
For aggressive selling, watch for a breach below 23,291 , which may trigger further downside to 23,123 . Use tight stop losses to manage risk.
Risk Management Tips for Options Trading:
Avoid chasing trades immediately after the opening bell; let the first 15–30 minutes establish a clear trend.
Use stop losses based on hourly candle closes to reduce the impact of market noise.
Limit position sizes in volatile zones and avoid holding positions into key economic events.
Keep track of implied volatility (IV) levels to assess premium pricing; avoid overpaying for options.
Summary and Conclusion:
The market's reaction near critical levels such as 23,657 (resistance) and 23,324 (support) will determine the trend for the day. Bullish momentum above 23,657 could target 23,725 , while failure to hold 23,324 may lead to a retest of 23,123 . Follow disciplined trading, and remember that patience and risk management are key to navigating uncertain conditions.
Disclaimer: I am not a SEBI-registered analyst. All information provided is for educational purposes only. Traders are advised to conduct their own research or consult a financial advisor before making any investment decisions.
#NIFTY Intraday Support and Resistance Levels - 18/11/2024Flat opening expected in nifty. After opening if it's sustain above 23500 level and indicates bullish reversal from this level then possible upside rally upto 23750 in opening session. But in case nifty starts trading below 23450 level then possible strong downside fall in nifty upto 23200- level in today's session.

In Depth Analysis for Nifty 50 Index (1-Hour Chart)Symbol: Nifty 50
Timeframe: 1-Hour
---
Technical Analysis:
The Nifty 50 index is currently trading at 23,559.60, moving within a well-defined downward-sloping channel. The price is nearing a crucial support zone (23,480-23,570), which could act as a potential area for a short-term bounce. However, the overall trend remains bearish unless a breakout occurs above the resistance levels.
---
Key Observations:
1. Trend: The index is clearly in a downtrend, forming lower highs and lower lows within the channel. The bearish sentiment remains dominant.
2. Support & Resistance:
Immediate Support: 23,480-23,570. A breakdown below this level could lead to further downside toward 23,200.
Immediate Resistance: 24,070-24,540. These levels correspond to the midline and upper boundary of the channel.
3. Volume Analysis: Declining volumes on the recent down move indicate a potential loss of selling momentum, suggesting the possibility of a short-term pullback.
4. Potential Reversal Zone:
A break above 24,070 could trigger a short-covering rally, pushing prices toward 24,540.
---
Trade Setup:
1. For Bulls:
Entry: Consider going long near 23,480-23,570, provided there are bullish reversal signals like a hammer or bullish engulfing candle.
Target: 24,070, and an extended target of 24,540.
Stop Loss: Below 23,450, to minimize downside risk.
2. For Bears:
Entry: Look for shorting opportunities on rejection near 24,070 or at the channel’s upper boundary (24,540).
Target: 23,480 and further downside to 23,200.
Stop Loss: Above 24,600.
---
Potential Scenarios:
1. Bullish Breakout: A decisive close above 24,070 will confirm a breakout from the channel, opening doors for a move toward higher levels.
2. Continuation of Downtrend: If the index fails to hold the 23,480 support, it could continue its bearish trajectory to 23,200.

Nifty Update , BankNifty Update and Tata Motors UpdateHello Traders ,
Checkout the update on Nifty , BankNifty and Tata Motors. Also checkout our previous analysis to know our accuracy level

NIFTY - Trading Levels and Plan for 18-Nov-2024** Nifty Trading Plan for 18-Nov-2024 **
Previous Day Overview:
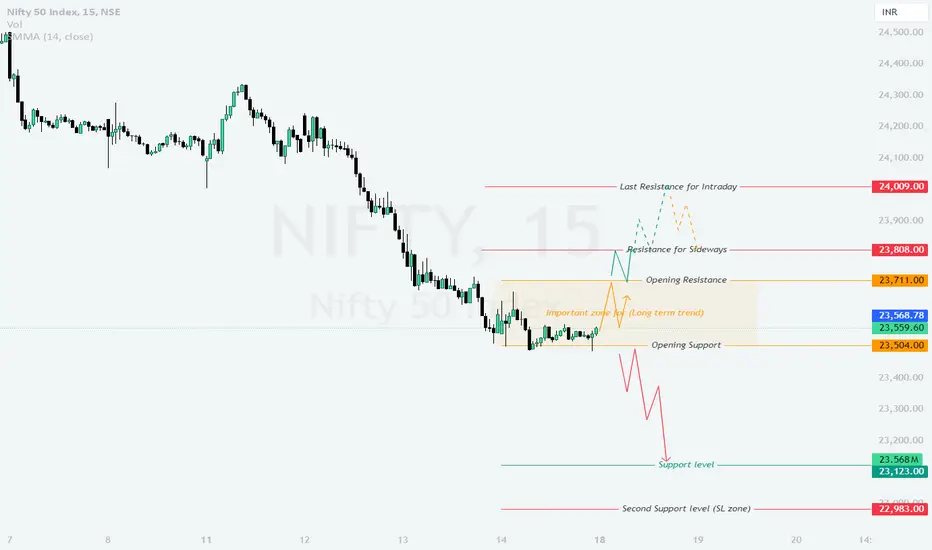
On 17-Nov-2024, Nifty displayed a consolidative pattern near the Important Zone for Long-Term Trend at 23,711 , signaling indecision among traders. The chart highlights three key trends: Yellow showing a sideways movement, Green representing bullish attempts facing resistance near 23,808 , and Red depicting bearish pullbacks testing support at 23,504 . The session emphasizes the significance of these levels in determining market direction.
---
** Opening Scenarios: **
Gap Up Opening (100+ points above)
If Nifty opens above 23,808 , it could test the Last Resistance for Intraday at 24,009 . Monitor the price action in the first 15-30 minutes for consolidation near 23,900 . A sustained breakout above 24,009 could indicate strong bullish momentum. Avoid chasing trades in case of high volatility; instead, wait for a retest of 23,808 as support for a safer entry point.
Flat Opening (within ±50 points)
A flat opening near 23,559 may provide a clearer picture of market sentiment. If Nifty holds above the Opening Resistance at 23,711 , a bullish move toward 23,808 is likely. Conversely, a breakdown below 23,568 could lead to a retest of the Opening Support at 23,504 . Prioritize risk management, as a flat opening could result in sideways movement initially.
Gap Down Opening (100+ points below)
A gap-down opening near 23,504 will shift focus to the Support Level at 23,123 . Allow the first 30 minutes for price stabilization; if Nifty sustains below 23,504 , expect a bearish move toward 23,123 . However, a quick recovery above 23,504 may present a reversal trade opportunity targeting 23,711 .
---
** Risk Management Tips for Options Trading :**
- Use well-defined stop-loss levels, preferably based on hourly candle closes, to avoid unnecessary losses.
- Reduce position sizes when trading gap openings to manage volatility risks effectively.
- Opt for at-the-money (ATM) or slightly out-of-the-money (OTM) options for better liquidity and quicker premium adjustments.
- Avoid over-leveraging, especially in highly volatile market conditions.
---
** Summary & Conclusion :**
For 18-Nov-2024, the key levels to monitor are 23,711 on the upside and 23,504 on the downside. A breakout above 23,808 could signal bullish momentum, while a breach below 23,504 may indicate bearish pressure. The market remains poised for both sideways and directional moves, depending on the opening scenario.
---
**Disclaimer:**
I am not a SEBI-registered analyst. This trading plan is for educational purposes only. Traders are advised to conduct their own analysis or consult with a financial advisor before making any trading decisions.
Key Technical Analysis of Nifty50: Upcoming TrendIntroduction:
Understanding key support and resistance levels is essential for traders and investors looking to capitalize on market movements. This article provides an in-depth analysis of the Nifty50 index's weekly chart, highlighting essential price levels and trends that indicate potential bullish or bearish movements in the coming months. With Nifty's recent performance, it is crucial to evaluate these technical levels to identify future price action possibilities.
1. Previous Resistance Turned Strong Support
Nifty previously broke out of a strong resistance level around the 19000 mark, which now acts as robust support. This previous resistance level, marked with a red zone, signifies a major price zone that could halt potential downward movements, providing a solid foundation for buyers if Nifty pulls back to this level.
2. Support Trend Line and Bullish Continuation
A support trend line, indicating an ongoing bullish trend, extends from early 2023 to the current date. This trend line has been a crucial indicator of the index's positive momentum, providing support on multiple pullbacks. As long as Nifty respects this trend line, it could continue its bullish trajectory, making this level ideal for those looking to enter long positions.
3. The Key Support Zone at Last Swing Low
A major support zone sits around the 21000 level, marked by Nifty’s last swing low. This green zone is a significant area of buying interest. If the index begins a downward correction, this support zone will be closely watched by traders looking for signs of reversal or continued decline.
4. Trend Reversal Zone and Bearish Potential
If Nifty breaks down below the support trend line, it would signal the potential start of a bearish trend. Sellers could see this as an opportunity to enter short positions, especially if the breakdown is accompanied by strong volume. This area is essential for risk management, as a trend line breakdown could lead to a decline toward lower support levels, such as the 21000 zone or even further to 19000.
5. Reversal Confirmation and New Highs
On the upside, a reversal confirmation near the current support trend line could signal a renewed bullish push, with the possibility of Nifty making new highs. If this reversal takes place, it would present an attractive opportunity for long-term investors and buyers aiming for a rally continuation.

#NIFTY Intraday Support and Resistance Levels - 14/11/2024NIFTY will open gap up in today's session. After opening 23750 level will act as an immediate resistance for nifty. Downside 23500 level is important support zone. In case nifty gives breakdown of this level and starts trading below 23450 then strong downside expected. Any bullish rally only expected above 23800+ level.

Nifty 50 Elliot wave analysis on 15 minutes chart.Nifty 50 Elliot wave analysis on 15 minutes chart. We are on a downward trajectory which is expected to continue for some time. Your thoughts/ideas are welcome.

NIfty 50 Analysis for tomorrow (intrday level)today price opened on 4h orderflow and made a bullish wick
which then got rejected at inside bar and in the end of day we have 1hr bearish fvg (orange)
and downside we have 15mn OB (green)
but it seems we would get to see liquidity sweep marked in white dots so wait or avoid trading the breakdown
if the breakdown happens and price makes another bearish fvg then its valid or else it will invalid as trading short

Nifty 50 analysis- "In recent days, Nifty has formed a bearish head and shoulder pattern, indicating potential downside. It has currently reached 26,277.34, which is approximately 10.50% below its previous high. The 23,500 level is a crucial support zone, coinciding with the 200-day Exponential Moving Average (EMA). Historically, Nifty has tended to bounce off this 200-EMA.
However, it's important to note that market sentiment has turned bearish. Therefore, a prudent strategy would be to adopt a cautious approach, considering selling into rallies until we receive clear signs of upward momentum."

NIFTY 450+ Points Profit Short Trade: A Perfect Execution The NIFTY (15-minute timeframe) chart highlights a well-executed short trade setup, delivering exceptional precision and profitability. Using the Risological Trading Indicator , traders were able to navigate this trade seamlessly.
Trade Highlights:
Entry Point : Positioned at 24,207.85, following a strong bearish signal confirmed by the downward Risological Lines and swing trendline alignment.
Targets Achieved : All targets were successfully hit:
TP1: 24,128.20
TP2: 23,999.25
TP3: 23,870.30
TP4: 23,790.60
Stop-Loss: A tight SL at 24,272.35 ensured disciplined risk management.
Key Observations:
Risological Lines : The collapsing Risological Red lines indicated strong bearish momentum, guiding traders to confidently hold the short position.
Momentum Continuation : Steady selling pressure confirmed the trade's directional strength, allowing all targets to be met efficiently.
Conclusion:
This trade on NIFTY showcases the power of technical analysis and precise execution. The well-structured risk-to-reward ratio made this short trade an outstanding success. Traders leveraging the Risological Indicator reaped impressive intraday profits—yet another win for technical discipline!

NIFTY Bears Dominate! 200+ Points Intraday Profit BaggedNIFTY Intraday Short Trade Analysis:
The NIFTY 15m timeframe revealed a strong short trade setup, capitalizing on bearish momentum. As of 12 Nov, 1:17 PM, the trade has already hit TP1 (24128.20) and TP2 (23999.25), delivering over 170+ points profit intraday – a remarkable gain for a single session!
Trade Snapshot:
Entry: 24207.85
Stop Loss (SL): 24272.35
NIFTY Targets:
TP1: 24128.20 ✅
TP2: 23999.25 ✅
TP3: 23870.30
TP4: 23790.60
Key Highlights:
Massive Intraday Momentum : The trade leveraged a steep bearish trend, with prices moving sharply downward.
Confluence of Signals : The short setup aligned perfectly with a downward sloping RISOLOGICAL Lines and bearish candlestick patterns, validating the move.
Quick Scalping Opportunity : The quick descent to TP2 within a short timeframe exemplifies the strategy’s efficiency for intraday traders.
Profit Perspective:
This setup's 200+ points profit intraday is a massive score for NIFTY, offering traders an exceptional risk-to-reward ratio. The move towards TP3 and TP4 looks probable, with continued bearish sentiment driving prices further down.
Conclusion:
A picture-perfect short trade setup on NIFTY has already delivered stellar returns. Traders riding this wave are poised for even greater profits as the index inches toward its lower targets. Keep an eye on the next support levels!

#NIFTY Intraday Support and Resistance Levels - 13/11/2024Today will be flat opening in nifty. After opening important level for nifty is 23800 level. In case nifty gives breakdown of this level and starts trading below 23750 then possible strong downside movement upto 23500 level in today's session. Upside 24000 level will act as a strong resistance for the nifty.

NIFTY : Levels and plan for 13-Nov-2024Intro:
On **12-Nov-2024**, the Nifty 50 index saw consolidation in the lower zone, with strong support around the "Must Try Zone" and signs of buyer activity. Moving forward, we have identified key levels for potential bullish, bearish, and sideways movements. Yellow trends indicate potential sideways movement, Green trends represent a bullish outlook, and Red trends show bearish sentiment.
---
Trading Plan for 13-Nov-2024
**Gap Up Opening (100+ points):**
If the market opens with a significant gap up beyond 24,100 , watch for immediate resistance at 24,395 . If Nifty sustains above this level, we may see a bullish rally toward the next resistance level at 24,464 . However, if selling pressure emerges, expect the index to pull back to the "Opening Resistance" zone around 23,986 , where buyers might attempt to regain control.
**Flat Opening:**
In case of a flat opening near 24,025 , monitor the initial price action closely. If Nifty sustains above this level, a test of the "First Resistance Zone" around 24,361 is likely. Breaking this resistance could lead to a rally up to 24,423 or even the "Last Resistance Zone" at 24,464 . Failure to break through 24,361 could result in a retracement to the "Important Buyer’s Support" at 23,825 .
**Gap Down Opening (100+ points):**
A gap down opening below 23,767 would place the market within the "Important Buyer’s Support" zone. Here, a strong buyer presence could lead to a rebound toward 23,986 . If this level holds, an upward move back to the "Opening Resistance" is possible. However, if the index falls below 23,582 , it could signal further bearishness, targeting the "Possible Bottom Zone" around 23,504 .
---
Risk Management Tips for Options Trading:
- Limit your position size, especially near key resistance or support levels where reversals are more probable.
- In volatile market scenarios, consider using stop-loss orders based on hourly closes to avoid unnecessary stop-outs due to intraday volatility.
- Avoid entering trades in the "No Trade Zone" as highlighted on the chart, as these areas lack clear trend direction and increase the risk of whipsaw movements.
---
Summary & Conclusion:
For 13-Nov-2024 , key levels to watch are 24,395 for resistance on the upside and 23,582 for critical support on the downside. Price action within the "Important Buyer’s Support" zone could dictate market direction. Green trends indicate potential bullish moves, Red trends signal bearish opportunities, and Yellow trends suggest caution with possible sideways action.
---
Disclaimer: I am not a SEBI-registered analyst. This analysis is based on my personal trading strategy and psychological theory. Please perform your analysis or consult a financial advisor before making any trading decisions.
---
Happy trading!

#NIFTY Intraday Support and Resistance Levels - 12/11/2024Nifty will open slightly gap up in today's session. After opening it will face resistance at 24250 level. Possible reversal from this level upto 24050. But in case nifty starts trading and sustain above 24300 then possible strong bullish rally upto 24550 level in today's session. Major downside expected below 24000 level.

NIFTY : Levels and Strategies for 12-Nov-2024Intro:
In the previous session, Nifty traded within a defined range, testing key levels without strong directional movement. We observed a sideways trend (yellow) near 24,122 - 24,171 , while the bullish trend (green) highlighted potential resistance points, and the bearish trend (red) indicated key support zones. Today's session will focus on reactions near these levels to identify any possible breakouts or breakdowns.
Opening Scenarios:
Gap Up Opening (100+ Points Above)
If Nifty opens above the 24,171 level, it may initially face resistance in the First Resistance Zone at 24,327 - 24,361 . A breakout above this weak resistance level could open the path to the Last Resistance for Intraday at 24,423 . Further strength above 24,423 could lead to a move toward the Profit Booking Zone at 24,530 - 24,601 .
Traders may consider long positions if the price sustains above 24,327 , aiming for targets at the higher resistance zones, but they should exercise caution if Nifty struggles to hold above 24,361 .
Conservative traders might look for pullbacks near support levels before entering long positions.
Flat Opening
In the event of a flat opening around 24,122 , the No Trade Zone 24,100 - 24,171 should be monitored closely. Price movement within this zone could indicate consolidation.
A breakout above 24,171 could signal bullish intent, leading to targets at 24,327 - 24,361 . Conversely, a breakdown below 24,100 might drive the index toward the Buyer’s Support at 23,988 .
Flat openings generally suggest patience, so traders may wait for a breakout from the No Trade Zone before initiating positions.
Gap Down Opening (100+ Points Below)
If Nifty opens below 24,100 , it may find support in the Buyer’s Support Zone around 23,988 . If this support holds, a recovery move back towards 24,100 is likely. A failure to hold above 23,988 could bring Nifty down to the Buyer’s Must Try Zone (Do or Die) at 23,828 - 23,777 .
Traders might look for shorting opportunities if Nifty breaks below 23,988 , with a target near the Buyer’s Must Try Zone. Alternatively, a bounce from the Buyer’s Support level could provide a chance for long trades towards 24,100 .
In gap-down scenarios, trading with a cautious mindset is crucial, and it’s often wise to wait for clear price action signals before entering trades.
Risk Management Tips for Options Trading:
Use appropriate stop-loss levels ( 24,100 , 24,327 , 24,423 ) to safeguard against unexpected moves.
Limit position sizes to manage potential risks, particularly during volatile conditions.
Consider using options spreads, like debit or credit spreads, to cap potential losses while still allowing for profit.
Avoid chasing trades in the No Trade Zone; wait for confirmed breakouts or breakdowns to enter options positions.
Summary and Conclusion:
The key levels to watch for 12-Nov-2024 are 24,171 (No Trade Zone upper boundary), 24,361 (First Resistance Zone), and 23,988 (Buyer’s Support). Observing price action near these levels can provide trading opportunities. Manage risks carefully, especially in options, to navigate through volatile market conditions effectively.
Disclaimer:
I am not a SEBI-registered analyst. This trading plan is based on technical analysis and personal insights. Traders should conduct their own analysis or consult a certified financial advisor before making any trading decisions.

NIFTY : Levels and Trading Plan for 11-Nov-2024
Nifty Trading Plan – 11-Nov-2024
Intro:
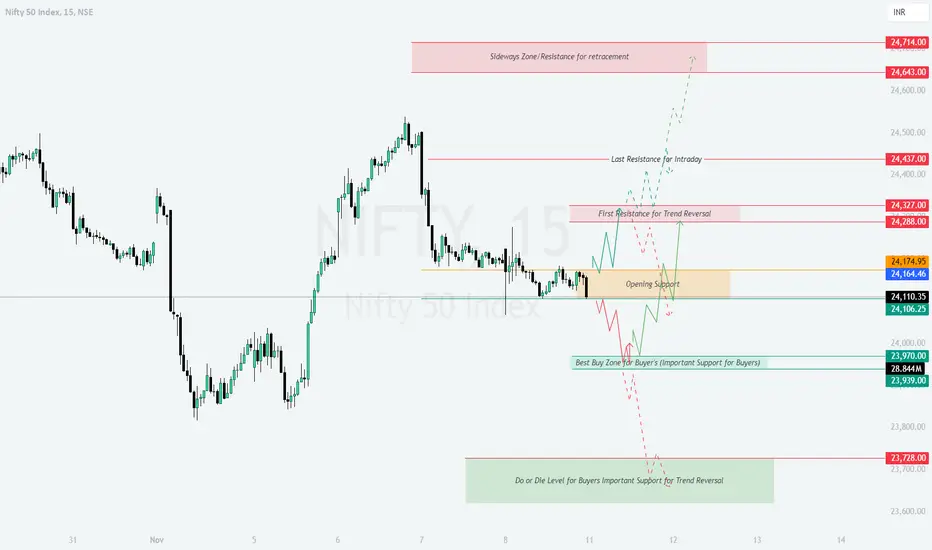
On the previous trading day, Nifty exhibited a mix of sideways and bearish trends, giving us valuable support and resistance zones. The yellow trend zones indicated periods of sideways movement, green zones showed bullish momentum, and red zones highlighted bearish pressure. We’re seeing strong resistance at 24,437 (Last Resistance for Intraday) and crucial support levels around 23,970 (Best Buy Zone for Buyers). Here’s how to approach the 11-Nov session based on potential market openings.
---
Trading Plan for All Opening Scenarios:
Gap Up Opening (100+ Points):
- If Nifty opens with a gap up above the First Resistance for Trend Reversal at 24,327, observe if it sustains above this level for the first 15-30 minutes.
- Bullish Scenario: A sustained move above 24,327 can trigger a bullish trend toward the Last Resistance for Intraday at 24,437. If it continues its momentum, target the Sideways Zone/Resistance for Retracement at 24,714 as the next potential upside. Enter with caution, aiming to buy on retracements toward the 24,327 level.
- Bearish Scenario: If it fails to hold above 24,327 and dips back, expect a retracement toward the Opening Support zone around 24,164. Aggressive traders can look for short entries below this level with a target back toward the Best Buy Zone at 23,970.
Flat Opening:
- If Nifty opens flat around the 24,110 mark, wait for the price to settle for 15-30 minutes before taking any positions.
- Bullish Scenario: A move above the First Resistance at 24,288 can give bullish momentum with targets toward 24,327 and potentially 24,437. Enter long positions if prices show strong support around 24,288.
- Bearish Scenario: If Nifty breaks below the Opening Support level at 24,106, it could signal weakness, with targets around the Best Buy Zone at 23,970. Look for short entries if price action confirms bearish sentiment below 24,106.
Gap Down Opening (100+ Points):
- A gap down opening below 24,000 could lead to initial volatility. Monitor how it behaves around the Best Buy Zone for Buyers at 23,970.
- Bullish Scenario: If Nifty holds above 23,970 and shows signs of a reversal, consider going long with targets around the Opening Support level at 24,106.
- Bearish Scenario: If selling pressure continues and Nifty breaks below 23,970, expect a deeper pullback toward the Do or Die Level for Buyers at 23,728. Look for short opportunities if it sustains below 23,970 with a strict stop loss above the 23,970 level.
---
Risk Management Tips for Options Trading:
- Use limited-risk strategies such as spreads to control risk.
- Set stop losses based on daily candle close to avoid getting stopped out by intraday volatility.
- Adjust position sizing based on your risk tolerance; avoid over-leveraging.
- Consider exiting positions near target levels rather than waiting for exact points. Options premiums can decay quickly.
---
Summary and Conclusion:
The market structure suggests key levels to watch for support and resistance. If Nifty sustains above key resistance at 24,327, it could lead to a bullish move, while a breach below support at 23,970 could prompt further downside. Be patient, wait for confirmation at each level, and manage risk effectively.
---
Disclaimer:
I am not a SEBI-registered analyst. This plan is for educational purposes only. Please conduct your analysis or consult a financial advisor before making any trading decisions.
#NIFTY Intraday Support and Resistance Levels - 08/11/2024Slightly gap up opening expected in nifty. After opening if nifty starts trading above 24300 and sustain above this level then possible strong upside bullish rally upto 24550 level in today's session. Below 24250 expected negative side in index upto 24000 level.

NIFTY : Trading Levels and Plan for 08-Nov-2024Previous Day’s Chart Overview:
On 07-Nov-2024, Nifty displayed a bearish movement with opening tick , with a clear consolidation phase after the breaking mentioned support zone. The chart highlights significant levels for both support and resistance that are likely to influence price movements on 08-Nov. The Yellow trend represents the sideways movement, the Green trend indicates a bullish scenario, and the Red trend shows potential bearish paths.
---
Trading Plan for 08-Nov-2024
Gap Up Opening (100+ points):
If Nifty opens above 24,358.00 (Opening Resistance) and holds, look for buying opportunities on pullbacks near this level. A sustained move above could target 24,460.00 , the next intraday resistance.
Should Nifty face resistance near 24,460.00 and fail to break above, consider short opportunities for a quick pullback to 24,358.00.
Watch for a potential breakout above 24,460.00 which could trigger a move towards the 24,643.00 – 24,714.00 zone, where sideways resistance may impact the uptrend. Book profits or trail stops in this range.
Flat Opening (within ±50 points):
If Nifty opens near 24,190.60 and finds support above 24,174.95 (Opening Support) , consider long positions targeting 24,358.00 (Opening Resistance) .
A failure to hold 24,174.95 could signal weakness; watch for a potential test of 24,106.25 (Best Buying Level) , a strong support level for intraday buyers.
If Nifty consolidates between 24,174.95 and 24,106.25, remain cautious with small trades until a clear breakout or breakdown occurs.
Gap Down Opening (100+ points):
If Nifty opens near or below 24,106.25 (Best Buying Level) , observe if it finds support. A strong buying interest here could provide an opportunity to target the 24,174.95 - 24,190.60 zone.
A breakdown below 24,106.25 may lead to a bearish trend toward 23,970.00 , the next critical support level. Traders can consider short positions here with strict stop-losses.
If Nifty tests and breaks below 23,970.00 , the next “Do or Die” level for buyers is at 23,700.00 , where a trend reversal may occur if supported by volume.
Risk Management Tips for Options Trading:
Always use stop-loss orders, especially when trading near resistance and support levels.
Limit your position size to a maximum of 2-3% of your total capital to manage risk efficiently.
For option trades, consider hedging strategies such as spreads or using out-of-the-money options to minimize premium risks in volatile markets.
Summary & Conclusion:
Tomorrow’s market could present significant trading opportunities given the current setup, especially around key support and resistance zones. Be cautious near the “Do or Die” level for buyers at 23,700.00, as it may lead to a trend reversal. Focus on risk management to protect capital in volatile conditions.
---
Disclaimer:
I am not a SEBI-registered analyst. This analysis is for educational purposes only and should not be considered as investment advice. Please consult a financial advisor before making trading decisions.
