#NIFTY Intraday Support and Resistance Levels - 17/06/2025Today, a flat opening is expected in Nifty near the 24,950 level. The index has been moving in a narrow consolidation zone and currently trades just below an important resistance. If Nifty manages to sustain above the 25,050–25,100 zone after the opening, we may witness bullish momentum building up. This could lead to an upward move toward 25,150, 25,200, and possibly 25,250+ levels during the day.
However, if Nifty fails to hold above the 24,950 mark and slips into weakness, it may invite intraday profit booking. A drop below the 24,900–24,950 level could open the downside toward 24,850, 24,800, and 24,750 levels. This zone has previously acted as a support range, and any break here could intensify selling pressure.
Niftytradesetup

#NIFTY Intraday Support and Resistance Levels - 16/06/2025Today, a slightly gap-up opening is expected in Nifty near the 24,735 level. If Nifty sustains above the 24,750–24,800 zone after the opening, it may lead to a continuation of the upside move toward 24,850, 24,900, and potentially 24,950+ during the day. This zone can attract intraday buying interest, especially if supported by volume and momentum.
However, any rally approaching the 24,950 level should be watched cautiously, as it may act as a reversal zone, triggering profit booking or intraday resistance.
On the other hand, if Nifty fails to hold 24,700 levels and starts drifting lower, fresh selling pressure could emerge, pushing the index toward 24,650, 24,600, and even 24,550 during the session.

NIfty SpotVery good resilience shown by Indian Markets amid Global uncertainty.
Iran - Israel war will surely have an impact on opening of the markets tomorrow..
The way the war is continuing all likely hood of opening deep red...tomorrow
Well but i feel taht will be a good opportunity to buy near 24000-23850 Zone... as it is also a previous GAP so all possibility of finding suppport near that level
Have marked important level on chart.
Like... Share... Comment.

#NIFTY Intraday Support and Resistance Levels - 13/06/2025Today, a gap-down opening is expected in Nifty near the 24,700 level. If Nifty sustains below the 24,700 mark after opening, a continuation of the bearish trend may take place with potential downside targets at 24,650, 24,600, and even 24,550+.
On the other hand, if Nifty manages to reclaim the 24,750–24,800 zone and starts trading above it, we could see a short-term pullback or recovery rally towards 24,850, 24,900, and 24,950+ levels.
However, the 24,950 level will act as a strong resistance for today’s session — any upside attempt may see rejection or profit booking from this zone.

Nifty 12-JUNE-25 VIEW Everything is on chart for SWING view
AREA UP AREA LOW SPACE
AND MY VIEW FOR LONGTERM IS SAME


#NIFTY Intraday Support and Resistance Levels - 12/06/2025Today, a gap-up opening is expected in Nifty near the 25250 level. If Nifty sustains above this zone, we may see bullish momentum extending toward the targets of 25350, 25400, and potentially 25450+ during the session.
However, if Nifty fails to hold above 25250 and begins reversing below 25200, it could trigger a pullback move. A reversal short opportunity may arise in the 25250–25200 range with potential downside targets of 25150, 25100, and 25050.
Overall sentiment remains bullish above 25250, but volatility is likely near resistance levels. Traders are advised to keep tight stop-losses and trail profits cautiously, as the market may remain range-bound with occasional spikes.

#NIFTY Intraday Support and Resistance Levels - 11/06/2025Nifty opened with a slight gap-up near the 25100 level, continuing its recent pattern of consolidation. Despite the positive opening, the index remains well within its established range, suggesting that market participants are still awaiting a decisive breakout. There are no major changes observed in key support or resistance levels compared to the previous sessions, reinforcing the view that the market is currently lacking strong directional momentum.
On the upside, if Nifty sustains above the 25100–25250 zone, it could attempt a move toward 25350, followed by 25400 and potentially 25450+. However, this upward move will require strong follow-through buying to break the current consolidation zone. Until then, any intraday rallies may face resistance near the 25250 mark, making it a crucial level to watch for bulls.
Conversely, failure to hold above the 25200–25250 region could lead to a reversal toward 25150, and if selling pressure intensifies, a further decline toward 25100 and 25050 may unfold. These levels are important short-term supports and have previously acted as buying zones. A break below 25050 may open the gates for deeper cuts, though that remains unlikely unless broader market sentiment weakens.

#NIFTY Intraday Support and Resistance Levels - 10/06/2025Nifty is opening with a gap-up near the 25250 level, approaching a crucial resistance zone. This area has previously acted as a turning point, and today's opening could define whether bulls retain control or face exhaustion.
If Nifty sustains above 25250, we can expect further upside momentum toward 25350, 25400, and 25450+. A clean breakout above this level could open the path to short-term bullish continuation.
However, if the index struggles to hold above 25250 and reverses, profit booking may kick in, pulling the index back toward 25150, 25100, and even 25050.
Holding above 25050–25100 will be key for maintaining a positive structure. A breakdown below this zone may shift sentiment in favor of bears.

#NIFTY Intraday Support and Resistance Levels - 09/06/2025Nifty is opening with a gap-up above the 25050 level, continuing the recent bullish momentum. The index has broken out of its previous range and is now hovering near a key breakout zone.
If Nifty sustains above 25050–25100, we could see further upside toward 25150, 25200, and 25250+. A clean breakout above 25250 may unlock extended targets at 25350, 25400, and 25450+.
However, if the index fails to hold above 25000 and slips back below 24950, it could lead to a short-term pullback. In that case, expect downside toward 24850, 24800, and 24750.

9 june Nifty50 brekout and Breakdown leval
🔵 Call (CE) Buy Levels:
24,768 – Above 10m hold CE by Risky Zone
25,122 –Above 10m hold CE Zone
25,290 – Above 10m hold CE by Zone
25,490 – Above 10m closing, short covering possible
🔴 Put (PE) Buy Levels:
25,290 – Below 10m PE by Risky Zone
25,490 – Below 10m PE by Safe Zone
24,768 – Below 10m hold PE by Zone
🟢 Other Key Zones:
24,530 – CE by Safe Zone
➤ Below this: Unwinding Possible
25,122 – Above: Positive Trade View
➤ Below: Negative Trade View


Nifty Analysis EOD – June 6, 2025 – Friday🟢 Nifty Analysis EOD – June 6, 2025 – Friday 🔴
🎯 25K Now, What's Next?
Nifty opened on a neutral tone, cautiously awaiting the outcome of the RBI Monetary Policy. As the event unfolded and the repo rate cut of 0.5% was announced, the celebration began on Dalal Street—and the charts reflected it.
What followed was a clean, powerful rally, breaking through key levels and carrying the index all the way to the psychological milestone of 25,000, where it closed almost flat on the round number at 25,003.05.
Today’s close is just shy of the May 26th high, and a few hurdles still remain:👉 25,060–25,070👉 25,115–25,130👉 25,180–25,212
These levels will decide whether the breakout from the box range—which we’ve discussed in earlier reviews—truly sustains. As long as there’s no negative trigger over the weekend, bulls may carry the momentum into next week.
🛡 5 Min Chart with Levels
🕯 Daily Time Frame Chart
🕯 Daily Candle Breakdown
Open: 24,748.70
High: 25,029.50
Low: 24,671.45
Close: 25,003.05
Net Change: +252.15 (+1.02%)
📊 Candle Structure Breakdown
Real Body: 254.35 pts (Strong Green)
Upper Wick: 26.45 pts
Lower Wick: 77.25 pts
🔍 Interpretation
A session that began quietly turned into a bullish sprint.
The small upper wick shows there was minimal rejection at higher levels.
The lower wick reflects early dip buying.
The strong green body signals dominant intraday momentum, with bulls in charge from start to finish.
🔦 Candle Type
🟢 Bullish Marubozu–like candle– Almost a full body with small wicks, indicating powerful follow-through buying and confidence among bulls.
📌 Key Insight
25,000 breakout looks clean and technically sound.
Holding above 24,900–24,950 in the coming session could lead to further upside exploration.
All eyes on volume confirmation and whether we can conquer the next resistance band near 25,130+.
🛡 5 Min Intraday Chart
⚔️ Gladiator Strategy Update
ATR: 274.31
IB Range: 91.90 → Medium IB
Market Structure: Balanced
Trades:✅ 10:05 AM – Long Triggered → Target Achieved (1:1.4)✅ 10:40 AM – Long Triggered → Target Achieved (1:2)
📌 Support & Resistance Zones
Resistance Levels
25,062 ~ 25,070
25,116 ~ 25,128
25,180 ~ 25,212
Support Levels
24,972
24,920 ~ 24,894
24,800 ~ 24,768
24,727 ~ 24,737
24,660
💭 Final Thoughts
Momentum is back.Bulls not only broke free from consolidation—they made a statement. The RBI’s surprise move might just be the fuel Nifty needed to launch toward unexplored zones.
📌 “Big breakouts don’t ask for permission. They just happen—when doubt is highest.”
✏️ Disclaimer
This is just my personal viewpoint. Always consult your financial advisor before taking any action.

Nifty50 Index MovementNSE:NIFTY Index is indicating an Upward Movement. The Rectangular Pattern needs to be broken and move upwards which is what is expected. We could soon expect 26k Range.
More over, if the RBI Moneytary policy today make any rate cut, this will accelerate the Movement.
This is truely for Educational Purpose and if the graph goes as expected we can expect good movement for Nifty 50 stocks Primarily.
#NIFTY Intraday Support and Resistance Levels - 06/06/2025Nifty is opening with a slight gap-up around 24750–24760, placing it just above a key resistance-turned-support level. This setup suggests early optimism, but follow-through momentum is crucial for confirmation.
If Nifty sustains above 24800, it may pave the way for a smooth upside toward 24850, 24900, and 24950+. This range could act as a momentum zone for intraday buyers if volume supports the move.
On the flip side, a slip back below 24700 may signal weakness and open downside targets at 24650, 24600, and 24550, pulling Nifty back into a broader consolidation range.

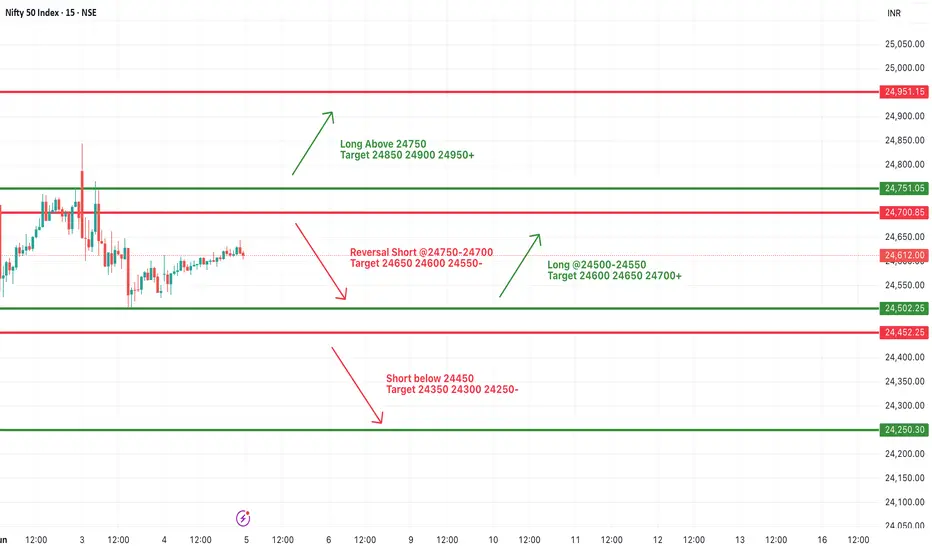
#NIFTY Intraday Support and Resistance Levels - 05/06/2025Nifty is opening with a gap-up near the 24750 level, placing it right at the breakout zone. If the index sustains above 24750, a bullish rally may follow with upside targets of 24850, 24900, and 24950+. Sustained momentum above this level can shift market sentiment toward a more positive bias.
However, traders should be cautious of a reversal from the 24750–24700 zone. If the index fails to hold and reverses downward, a short trade setup could be considered with downside targets of 24650, 24600, and 24550.
In case of further weakness below 24450, the trend may extend on the downside with targets at 24350, 24300, and 24250.
This is a critical level to watch. Wait for a decisive breakout above 24750 or a reversal signal before taking directional trades. Use strict stop-loss and manage positions actively, especially in early session volatility.
#NIFTY Intraday Support and Resistance Levels - 04/06/2025Nifty is opening with a gap-up near the 24700 level, placing it right at a key decision zone. If the index sustains above the 24750–24800 resistance band, it could trigger a bullish breakout with intraday upside targets of 24850, 24900, and 24950+.
However, if Nifty fails to hold this gap-up and slips back below 24700, it could quickly turn into a false breakout. A breakdown below 24700 may invite selling pressure with targets at 24650, 24600, and 24550.
Since the gap-up is near a resistance threshold, early volatility is expected. Wait for confirmation of direction with price-action and volume before taking any directional trade. Use strict stop-loss and consider partial booking around each target zone.

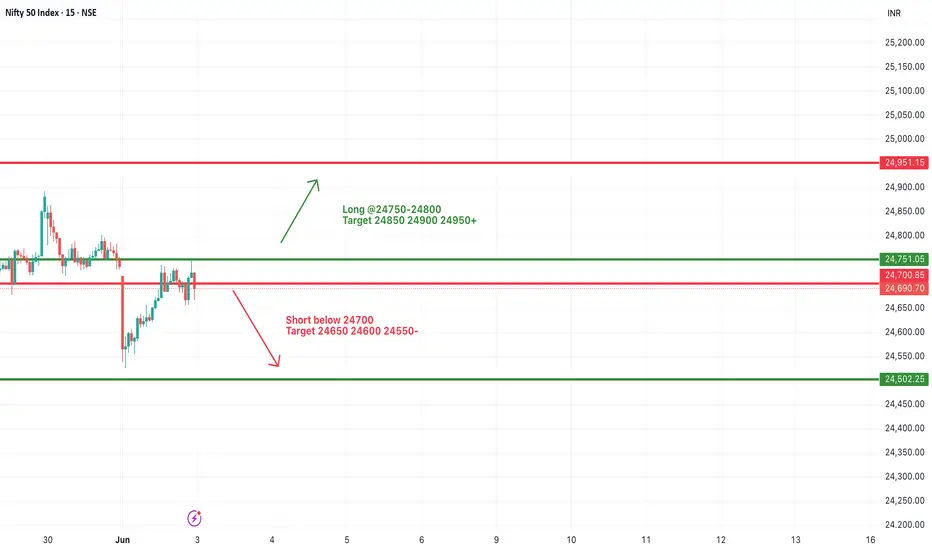
#NIFTY Intraday Support and Resistance Levels - 03/06/2025Nifty is expected to open flat near the 24700 mark, continuing its sideways trend from previous sessions. The index is currently hovering just below the key resistance zone of 24750–24800. A breakout above this level can trigger bullish momentum with upside targets of 24850, 24900, and 24950+. Sustained strength may push the index further toward the 25000–25050 area.
However, if Nifty fails to hold and breaks below 24700, it could lead to bearish pressure. A confirmed breakdown may open downside targets of 24650, 24600, and 24550. Further decline could test the next major support at 24500–24450 levels.
As the market remains range-bound, traders are advised to wait for breakout confirmation with strict stop-loss. Watch for volume and momentum near breakout zones to avoid false signals.
#NIFTY Intraday Support and Resistance Levels - 02/06/2025Nifty is expected to open flat near the 24700–24750 zone. The index has been consolidating in a tight range over the past few sessions, indicating indecision and a potential breakout on either side.
If Nifty sustains above the 24750–24800 zone, a bullish breakout may unfold with upside targets of 24850, 24900, and 24950+. A clear move above 25000 will confirm strong buying momentum with extended targets of 25150, 25200, and 25250+.
On the downside, if Nifty breaks below 24700 and fails to recover, fresh selling pressure could drag the index toward 24650, 24600, and 24550.

Nifty Analysis EOD – May 30, 2025 – Friday🟢 Nifty Analysis EOD – May 30, 2025 – Friday 🔴
Whatever gain on Thursday, wiped out... today! classic trap reset day
📌 Opening Note:After Thursday’s expiry surprise rally, today’s session turned out to be a mean reversion reality check. With a 44-point gap-down, Nifty attempted a recovery but failed to cross the previous day’s high — just 27 points shy, and rolled over into selling pressure.
📊 Nifty Summary:
Today’s price action stayed entirely within yesterday’s range, forming an inside bar pattern — a classic sign of indecision before a breakout. The morning attempt towards the high was quickly sold into, and the index retraced straight to PDL, where the previous day’s swing low came to the rescue at 24,717.40. From there, it bounced back to VWAP and stayed rangebound (~60–70 points) for the rest of the session.
By the close, intraday gains of Thursday were completely erased — ending exactly at the breakout zone of yesterday: 24,736.65.
🛡 5 Min Chart with Levels
🪞 Mirror Candle Alert!Interestingly, today’s candle (May 30) closely mimics the May 28 candle in structure and price levels:
High: 24,864.25 ~ 24,863.95 (🔁 0.30 pt diff)
Close: 24,752.45 ~ 24,750.70 (🔁 1.75 pt diff)
Low: 24,737.05 ~ 24,717.40 (🔁 19.65 pt diff)
This pattern alignment forms a diamond shape across the last 3 days (May 28–30), visible clearly on Daily and 5-min charts. This diamond formation + inside bar combo could be a powerful breakout setup — direction to be confirmed by the next session’s range expansion. Check out 5 min and Daily candle chart for visual insight.
🛡 5 Min Chart with Patterns
🕯 Daily Time Frame Chart
📉 Daily Candle Breakdown:
Candle Type: Inside Bar
Structure:
Real Body: Very small
Wick Sizes: Decent on both ends, implying indecision
Interpretation:
Inside bar at the top of a move with a prior hammer-like candle signals pause or reversal.
A break of 24,717 on downside = bearish confirmation
A break of 24,893 on upside = bullish breakout
🛡 5 Min Intraday Chart
⚔️ Gladiator Strategy Update:
ATR: 276.90
IB Range: 83.95 → Small
Market Structure: Balanced
Total Trades: 3
🔹 10:15 – Short triggered → Trailing SL hit @ 1:1.6
🔹 11:30 – Short triggered → 1:1.5 achieved
🔹 13:40 – Short triggered → SL Hit
📌 Support & Resistance Zones:
Resistance:
24,768 ~ 24,800
24,820
24,882
24,894
24,920
24,972 ~ 25,000
25,062 ~ 25,070 (5th rejection!)
25,116 ~ 25,128
25,180 ~ 25,212
25,285 ~ 25,399
Support:
24,737 ~ 24,727
24,700
24,660
24,640 ~ 24,625
24,590
24,530 ~ 24,480
24,460
📌 What’s Next? / Bias Direction:
Nifty has compressed into a tight 3-day structure — with a diamond and an inside bar pattern.🎯 Watch for breakout beyond 24,894 or breakdown below 24,677 for directional clarity.Bias remains neutral until price decisively exits this range.
💬 Final Thoughts:
“Breakouts don't lie. Ranges prepare. Patience pays.”
Today was a classic trap reset day. Tomorrow, the trigger might fire. Stay sharp.
✏️ Disclaimer:
This is just my personal viewpoint. Always consult your financial advisor before taking any action.

My Recent Trade In Nifty 50 ... On 1 hour time frame nifty is coming to get liquidity on FVG drew here.. after it may go to 25,000. let's see what happens...

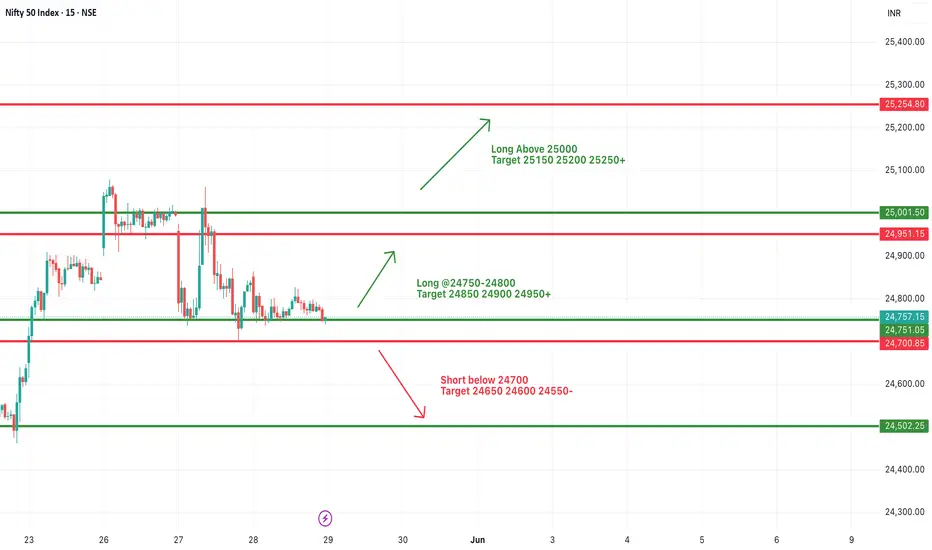
#NIFTY Intraday Support and Resistance Levels - 29/05/2025Today, Nifty is expected to open flat near the 24750 level. If it sustains above the 24750–24800 zone, a bullish move is possible with upside targets at 24850, 24900, and 24950+.
Further rally may be seen if Nifty breaks above the 25000 level, aiming for extended targets of 25150, 25200, and 25250+.
On the downside, if Nifty slips below 24700, a bearish trend may unfold with downside targets at 24650, 24600, and 24550.
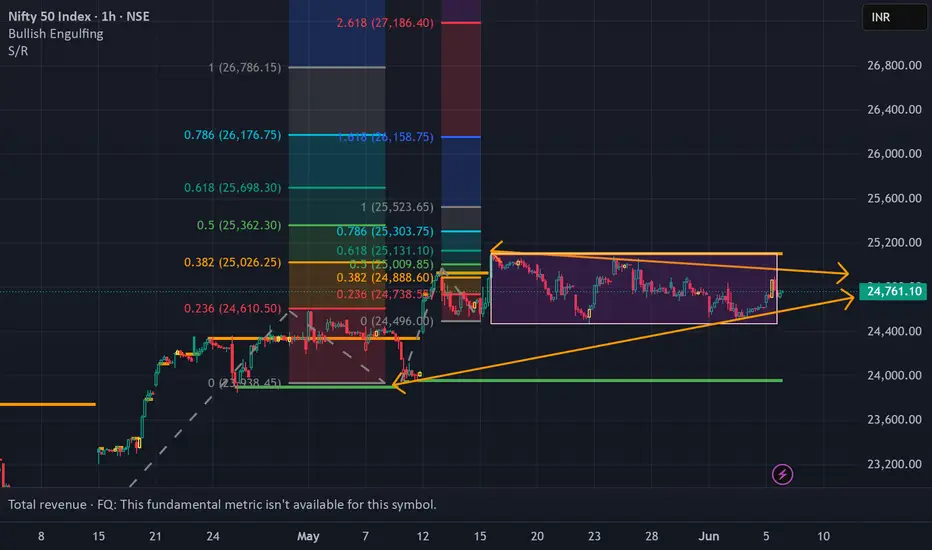
NIFTY 50
1. Ascending Channel:
Nifty is trending within a clear upward (ascending) channel, indicating a bullish trend as long as the price stays within this channel.
2. Support & Resistance:
There is a strong support zone in the range of 24,000–24,200, highlighted by a red-shaded area on the chart.
The current level (24,752.45) is near the middle of the channel and showing signs of minor correction.
3. Two Possible Scenarios (Arrows):
Scenario 1: From the current level, the market could move towards the upper boundary of the channel (around 25,500–26,000).
Scenario 2: There could be a short-term correction (downward movement) first, followed by a bounce from the support zone and then an upward move.
If you find this helpful and want more FREE forecasts in TradingView, Hit the 'BOOST' button
Drop some feedback in the comments below! (e.g., What did you find most useful?
How can we improve?)
Your support is appreciated!
Now, it's your turn!
Be sure to leave a comment; let us know how you see this opportunity and forecast.
Have a successful week
DISCLAIMER: I am NOT a SEBI registered advisor or a financial adviser. All the views are for educational purpose only
