#NIFTY Intraday Support and Resistance Levels - 26/05/2025Today, Nifty is expected to open with a gap-up near the 24950 level. If it sustains above the 24950–25000 zone, it can lead to bullish momentum with upside targets of 25150, 25200, and 25250+. A breakout above 25000 will act as a strong confirmation for further rally.
However, if Nifty fails to sustain above 24950 and slips below the 24900–24850 zone, a short trade opportunity may emerge with downside targets at 24800 and 24750.
Further weakness will be confirmed only if it breaks below 24700, which may drag the index down to 24600, 24550, and 24500.
Niftytradesetup

NIFTY : Trading levels and plan for 26-May-2025📊 Nifty Trading Plan – 26-May-2025
Timeframe: 15 Min | Reference Spot Price: 24,845
Gap Opening Threshold: 100+ Points
🚀 Gap-Up Opening (Above 24,974) – 100+ Points
If Nifty opens above the Opening Resistance level of 24,974, it enters a critical resistance zone that may trigger two-sided moves. The area between 25,195 – 25,294 is marked as the Profit Booking Zone / Last Intraday Resistance .
🟥 This zone has historically seen supply, and sharp up-moves may get trapped without strength in broader participation.
✅ Plan of Action:
– Avoid initiating long trades immediately post gap-up unless price shows strong bullish candles above 25,195.
– For intraday buying, wait for a clean 15-min candle close above 25,294 with strength in heavyweights.
– Ideal entry would be on a retest of the 25,195–25,294 zone if price holds.
– Reversal patterns (like Shooting Star / Bearish Engulfing) near 25,195 – 25,294 can offer sell-on-rise opportunities toward 24,974, then 24,845.
– Watch for volume confirmation – avoid shorting just because price is high.
🎓 Educational Note: Gap-ups into strong resistance zones require caution. Momentum without volume and market-wide confirmation often leads to failed breakouts. Let structure confirm before jumping in.
📈 Flat Opening (Between 24,790 – 24,974)
This places Nifty inside the No Trade Zone defined between 24,790 – 24,974.
🟧 This range is uncertain – the index may move sideways with choppy price action and lack of conviction from buyers or sellers.
✅ Plan of Action:
– Stay on the sidelines in the first 15–30 mins.
– Only consider long trades if price breaks and sustains above 24,974, then aim for 25,195 – 25,294.
– For short trades, wait for a clean breakdown below 24,790 with a bearish candle close to ride down to 24,684 and then 24,558.
– Risk reward is best outside this zone, not inside. Patience is key.
🎓 Educational Note: Flat openings in mid-range zones often cause emotional trades. Use this time to assess volume trends, sectoral strength, and structure. Most clean entries happen post-10:15 AM.
📉 Gap-Down Opening (Below 24,684) – 100+ Points
A gap-down below 24,684 pushes Nifty near its immediate supports at 24,558 (Last Intraday Support) and 24,250 – 24,190 (Buyer’s Zone).
🟩 This is a sensitive area where smart money may attempt reversals, especially near 24,250 – 24,190.
✅ Plan of Action:
– Watch for reversal signs (Hammer, Bullish Engulfing) around 24,558 and especially in the Buyer’s Support Zone: 24,250 – 24,190.
– If price finds footing and sustains above 24,558, reversal trades can be initiated with a target back to 24,684 – 24,790.
– A strong breakdown below 24,190 would confirm bearishness – in that case, avoid catching falling knives.
– Only go short below 24,190 on breakdown candle with next target open toward swing lows.
🎓 Educational Note: Gap-downs into major demand areas offer some of the best R:R setups—but only if there's evidence of absorption and reversal structure. Never go long just because price is “low”.
🛡️ Options Trading – Risk Management Tips
✅ Use slightly In-the-Money (ITM) options for better delta movement and less time decay.
✅ Avoid trading in No Trade Zones; theta will eat up your premiums.
✅ Follow the 1–2% capital risk rule – don’t over-leverage in anticipation of a breakout.
✅ Always define your stop loss using the underlying spot level, not just option premium.
✅ Book partial profits once price moves in favor and trail SL for the rest.
✅ If you hit 2 stop-losses in a row, take a break and re-assess the trend.
✅ Monitor OI data and sectoral strength—don’t blindly follow index candles.
📌 Summary & Conclusion
🔹 No Trade Zone: 24,790 – 24,974
🔹 Profit Booking / Resistance Zone: 25,195 – 25,294
🔹 Opening Supports: 24,684 & 24,558
🔹 Strong Buyer’s Support: 24,250 – 24,190
📈 For Gap-Ups, avoid early longs into resistance zones unless breakout is confirmed.
📉 For Gap-Downs, prepare for potential reversal from Buyer’s Support Zone.
🕒 In Flat Openings, wait 15–30 mins to avoid whipsaws inside No Trade Zone.
⚖️ Best trades occur outside the No Trade Zone with price + structure + volume alignment.
⚠️ Disclaimer:
I am not a SEBI-registered analyst. This trading plan is purely for educational purposes. Please conduct your own analysis or consult a SEBI-registered advisor before taking trades.

Nifty May Touch 25,500 and the FALL......NIfty may go to collect pending stoploss and orders resting above 25000 and after trapping bulls and bears together it may fall to level 24700 within a month.

#NIFTY Intraday Support and Resistance Levels - 23/05/2025Today, a flat opening is expected in Nifty. If after opening Nifty starts trading and sustains below the 24700–24650 zone, a short trade can be considered with downside targets of 24600, 24550, and 24500.
Further weakness may be seen if Nifty breaks below the 24450 level, opening the way for extended downside targets at 24350, 24300, and 24250.
On the upside, if Nifty sustains above 24750, a long position can be initiated. This may lead to bullish movement toward 24850, 24900, and 24950+ levels. However, 24950 will act as a key resistance, and reversal is possible near this zone.

#NIFTY Intraday Support and Resistance Levels - 22/05/2025Today a flat opening is expected in Nifty. After opening, if Nifty sustains above the 24750–24800 level, an upside movement is likely towards 24850, 24900, and possibly up to 24950+, which will act as a strong resistance zone for today’s session. Any rally reaching this level may witness a reversal.
On the downside, if Nifty starts trading below 24700, a major downside movement is expected towards 24600, 24550, and potentially 24500– levels in today’s session.

Nifty Analysis EOD – May 21, 2025 – Wednesday 🟢 Nifty Analysis EOD – May 21, 2025 – Wednesday 🔴
🌀 The Dead Cat Bounces Effect After Yesterday's Quick Fall 🌀
Nifty opened with a 45-point gap-up and, within the first 10 minutes, that gap was filled—marking a low of 24692.65. From there, a sudden burst of buying pressure launched the index above the 24768–24800 resistance zone in just 25 minutes. This sharp move triggered a round of short covering, propelling Nifty to the day’s high of 24946.20.
As shared live on TradingView, the Fib resistance zone of 24930–24940 (0.764–0.786 levels) was a key level to watch. True to expectation, Nifty faced strong rejection from this zone, leading to a V-shaped reversal—wiping out all gains in the next hour and marking a new low of 24685.35.
🌀 Screenshot from Tradingview - 1
🌀 Screenshot from Tradingview - 2
It was a rollercoaster ride in the first half. Post this, Nifty traded mostly within the CPR’s Top Central (TC) and Bottom Central (BC) range—though this range itself was 104 points, keeping the session active and far from boring.
Nifty’s close at 24813, around the VWAP and Central CPR, suggests a temporary equilibrium between buyers and sellers. The good part? We closed above the critical 24768–24800 support-turned-resistance. But there's a catch—the close is below yesterday’s Fib 0.5 retracement, signaling potential caution.
⚠️ Cautionary Note:In the short-term, today’s session fits the textbook example of a Dead Cat Bounce. With weekly expiry tomorrow, it's wise to stay alert and not get trapped in noise. Discipline and patience will be key.
🛡 25 Min Time Frame Chart
🔄 What’s Next? / Bias Direction
Wide trading range remains intact. But here’s the game plan:
📈 Long Setup:Above 24850, watch for strength with targets:→ 24920→ 24980→ 25075
📌 Above 25075, sharp short covering can drive price towards 25222 (Yes, it’s far—but good traders plan ahead, always).
📉 Short Setup:Below 24640–24625, weakness may extend down towards:→ 24500→ 24460
Let price action confirm.
🛡 5 Min Intraday Chart
🥷 Gladiator Strategy Update
Strategy Parameters
ATR: 324.57
IB Range: 151.65 → Medium IB
Market Structure: Balanced
Trade Highlights
✅ 1st Long Trigger: 10:05 AM – Target Achieved (R:R = 1:1.5)
💼 Total Trades: 1
🕯 Daily Time Frame Chart
🔍 Support & Resistance Levels
🔺 Resistance Zones:
24,882
24,920
24,980 ~ 25,000
25,062 ~ 25,070
🔻 Support Zones:
24,768 ~ 24,800
24,660
24,640 ~ 24,625
24,590
24,530 ~ 24,480
24,460
✍️ Final Thoughts
"Volatility doesn’t trap the prepared, it challenges them."
Tomorrow being expiry, let the levels speak. Stay objective, stay adaptive.
✏️ Disclaimer
This is just my personal viewpoint. Always consult your financial advisor before taking any action.

NIFTY 50 21.05 • The market is expected to open on a flat to mildly positive note, reflecting a subdued start in Asian markets. However, concerns remain due to significant FIIs outflows, with over ₹10,000 crore sold yesterday—one of the largest sell-offs since February 28, 2025—amid expectations of MSCI index rebalancing.
• Geo-political tensions in the Gulf region have driven crude oil prices above $66 per barrel, while uncertainty around an India–US trade agreement and a decline in US markets add to investor caution.
• The US market fell 0.4% yesterday, marking a pause after a six-day rally due to profit booking.
• European stocks rose for a fourth consecutive day, helped by renewable-energy stocks after US President Donald Trump lifted an order that halted construction on Equinor ASA’s $5 billion project off the coast of New York.
• UK, Germany and France Index gained up to 0.7%.
• Gift Nifty is trading marginally up.
• Results Today : ONGC, PFC, Mankind Pharma, RVNL, Colgate Palmolive, Oil India, Astral, National Aluminium, Ircon International.
Fundamental Pick: (Duration 1 Year)
Dixon Technology : Buy
(CMP 16566 TP 20500)
Technical View:
• NIFTY (Bearish - CMP: 24683) : Nifty immediate support is at 24550 then 24444 zones while resistance at 24850 then 25000 zones. Now till it holds below 24850 zones, profit booking could be seen towards 24550 then 24444 zones while hurdles can be seen at 24850 then 25000 zones.
• BANK NIFTY (Volatile - CMP : 54877) : Bank Nifty support is at 54500 then 54250 zones while resistance at 55250 then 55555 zones. Now it has to cross and hold 55000 zones for a bounce towards 55250 then 55555 zones while a hold below the same could see a further decline towards 54500 then 54250 levels.
Technical Idea:
GAIL : Buy
(CMP 191 SL 186 TGT 201)
Derivative View:
• Option Buying : Buy weekly Nifty 24650 Put till it holds below 24850 zones. Need to watch Bank Nifty 55000 zones for directional Option buying.
• Option Strategy : Nifty weekly Bear Put Spread (Buy 24700 PE and Sell 24500 PE) at net premium cost of 60-65 points. Bank Nifty Bull Call Spread (Buy 55200 CE and Sell 55700 CE) at net premium cost of 180-200 points.
• Option Writing : Sell weekly 24200 PE and 25300 CE with strict double SL. Sell Bank Nifty 53200 PE and 56800 CE with strict double SL.

#NIFTY Intraday Support and Resistance Levels - 21/05/2025Today will be flat opening expected in nifty. After opening if nifty sustain above 24750 level then expected upside movement upto 24950 level. This level will act as a strong resistance for today's session. Any upside rally can reversal from this level. Major downside expected if nifty starts trading below 24700 level. Downside 24500+ level expected in today's session.

#NIFTY Intraday Support and Resistance Levels - 20/05/2025Flat opening expected in nifty in consolidation zone of 24950-25050 level. No major changes in yesterday's levels. Any strong rally only expected after breakout or breakdown of this zone. Upside bullish rally expected if nifty starts trading and sustain above 25050 level this upside rally can goes upto 25250+ level in today's session. Any major downside rally possible below 24950. Downside 24750 level will act as a strong support for today's session.

#NIFTY Intraday Support and Resistance Levels - 19/05/2025Flat opening expected in nifty in consolidation zone of 24950-25050 level. Any strong rally only expected after breakout or breakdown of this zone. Upside bullish rally expected if nifty starts trading and sustain above 25050 level this upside rally can goes upto 25250+ level in today's session. Any major downside rally possible below 24950. Downside 24750 level will act as a strong support for today's session.

18.5.25 NIFTY Bullish18.5.25
NIFTY
CMP: 25019.80
BUY Above: 25120
Sl: 24494
Tgt: 25116 / 26275
I am not SEBI registered analyst. Views expressed here are for educational purposes only. Please consult your professional financial advisor before investing. We are not responsible for your profits / gains if any.

#NIFTY Intraday Support and Resistance Levels - 16/05/2025Gap up opening expected in nifty near 25200 level. After opening if nifty starts trading above 25300 level then expected strong further upside rally towards the 25500+ level. Any reversal only expected from 25250 level. Downside 25050 level will act as a strong support for today's session.

#NIFTY Intraday Support and Resistance Levels - 15/05/2025Gap up opening expected in nifty near 24750 level. After opening if nifty starts trading and sustain above this level then expected upside movement upto 24950 level. Below 24700 level there will be downside expected upto 24550. 24550 level will act as a strong and important support for nifty. Any major downside only expected below this support level.

Nifty Analysis EOD - May 14, 2025 - Wednesday🟢 Nifty Analysis EOD - May 14, 2025 - Wednesday 🔴
Day Ends with Directional Uncertainty from Nifty
🔍 Nifty Summary
Nifty opened with a 35-point gap-up, displaying early strength by slowly climbing toward 24,747, which aligned with the critical resistance zone of 24,768–24,800 and the CPR top. But that’s where the rally halted.
From the day’s high, it reversed lower, testing both the Previous Day Low (PDL) and Previous Week High (PWH). Interestingly, the index took support there and managed to close right at the CPR, underlining indecision.
The day was marked by broad consolidation within a 232-point range, with no strong directional follow-through. Price stayed majorly around the CPR zone, signaling a range-bound session with underlying uncertainty.
🕵️ Intraday Walk
☀️ Opened with 35-point gap-up; gradually climbed to 24,747.
🚫 Hit resistance at 24,768–24,800 and reversed.
🔽 Fell to test PDL and PWH zone (24535 area).
🛑 Found support and bounced back to close at CPR.
🔄 A day filled with range-bound movement and no clear trend.
📏 Inside Bar Pattern Watch (Daily Chart)
A 3-day Inside Bar Structure is forming:
📅 May 12: Mother Candle
📅 May 13: Baby candle (ignore 29-point upper wick)
📅 May 14 (Today): Another baby candle within May 13 (ignore 12-point lower wick)
This nested inside bar scenario could trigger a directional breakout soon.
🔼 Upside Levels:
If today’s high (24,767) breaks:Target Zones: 24,800 → 24,882 → 24,940
🔽 Downside Levels:
If today’s low (24,535) breaks:Target Zones: 24,480 → 24,400 → 24,365 → 24,330
🔎 Key Fib Observations
📏 Today’s high (24,747) = ~50% retracement of May 13’s candle → signals rise-on-sell tone
📉 Today’s close (24,640) = ~50% retracement of today’s candle → neutral-to-positive bias
These confluences reflect a tug-of-war between bulls and bears, waiting for a breakout.
🕯 Daily Candle Breakdown
Candle Type: Small-bodied candle inside previous day’s range
Today’s OHLC:▫️ Open: 24,613.80▫️ High: 24,767.55▫️ Low: 24,535.55▫️ Close: 24,666.90 (▲+88.55 / +0.36%)
🔍 Key Observations:
⚠️ No directional expansion, despite higher high & low
✅ Inside bar formation continues
✅ Close at candle midpoint → Neutral, with slight positive bias
📊 Sign of energy build-up for a potential breakout
🛡 Gladiator Strategy Update
Strategy Parameters
ATR: 349.73
IB Range: 169.70 → 📏 Medium IB
Market Structure: ⚖️ Balanced
Trade Highlights
⚠️ No trade triggered
💼 Total Trades: 0
🔢 Support & Resistance Levels
🟩 Resistance Zones:
24,730
24,768 ~ 24,800
24,882
24,980 ~ 25,000
25,100 ~ 25,128
25,180 ~ 25,212
🟥 Support Zones:
24,882
24,800 ~ 24,768
24,730
24,660
24,590
24,530 ~ 24,480
24,461
24,420 ~ 24,400
24,365 ~ 24,330
24,245 ~ 24,240
🔮 What’s Next?
A 3-day Inside Bar Formation generally signals a volatility contraction phase. The tighter the coil, the stronger the potential breakout.
If 24,767 breaks, bulls might regain momentum.If 24,535 fails, we may retest deeper supports from 24,480 downward.
📌 Patience over prediction — let the range resolve.
💬 Final Thoughts
“Inside bars are calm before the storm. Stay alert — breakout decides the next play.”
✏️ DisclaimerThis is just my personal viewpoint. Always consult your financial advisor before taking any action.

#NIFTY Intraday Support and Resistance Levels - 14/05/2025Slightly gap up opening expected in nifty near 24700 level. After opening if nifty starts trading and sustain above 24750 level then upside movement expected upto 24950+ target. Downside 24500 level will act as a strong support for today's session. Any major downside expected below this support level.

Nifty Futures Intraday Analysis for May 13, 2025According to our Market Timing indicator, it looks bearish trend for the day. The Support levels are at 24788 and 24395 while Resistance is at 25096.
I am waiting for Sell Signal confirmation from MastersCycle indicator with a proper stop-loss to take my short position.
This is only my view. Traders are suggested to follow own technical analysis and trade with proper risk management.

#NIFTY Intraday Support and Resistance Levels - 13/05/2025Gap up opening expected in nifty. After opening if nifty starts trading above 25000 level then possible strong upside rally upto 150-200+ points expected in index. 24750 level will act as a strong support for nifty. Any downside movement can reversal from this level. Now any major downside only expected below 24700 level.

#NIFTY Intraday Support and Resistance Levels - 12/05/2025Gap up opening expected in nifty near 24500 level. After opening if nifty starts trading above 24550 level then expected this rally can extend upto 24750+ in today's session. Downside 24250 level will act as a strong support for today's session. Any downside movement can reversal from this level. Major downside only expected below 24200.

#NIFTY Intraday Support and Resistance Levels - 09/05/2025Gap down opening expected in nifty. After opening if nifty starts trading below 23950 level then possible further downside upto 23750. Any upside movement can possible if nifty sustain above 24000 level. Upside 24200-24250 zone act as a strong resistance for today's session. Any upside rally can reversal from this level.

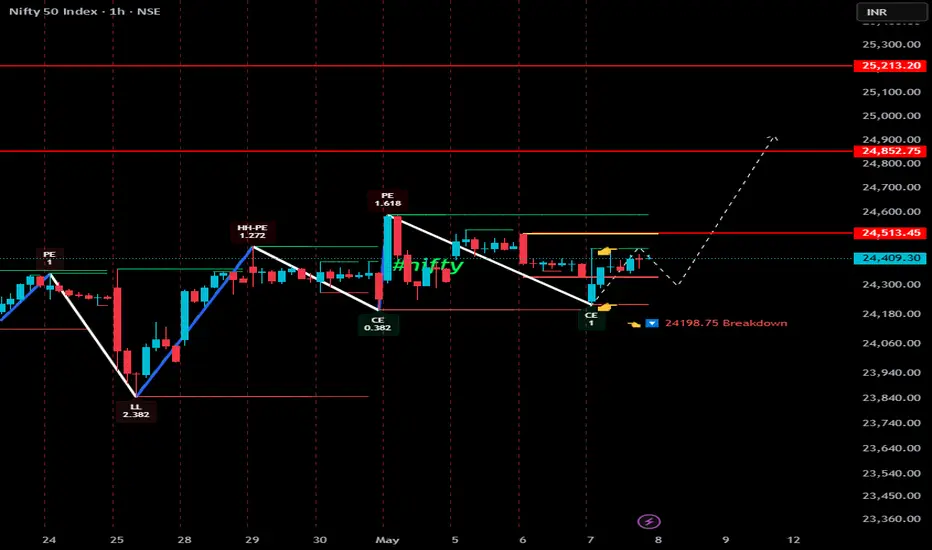
Nifty Short-Term Setup Alertifty is showing signs of strength after a period of consolidation. Watch for a breakout confirmation. On a successful breakout, the next immediate target is 24,310. Maintain proper risk management—set your stop-loss just below the consolidation range.
Plan:
🔹 Breakout Entry
🔹 Target: 24,310
🔹 SL: above consolidation
Stay disciplined.

#NIFTY Intraday Support and Resistance Levels - 08/05/2025Flat opening expected in index. After opening it will face major resistance at 24500 level. If reversal from this level can give downside movement upto 24250 support level. Strong upside rally only expected if nifty starts trading and sustain above 24500 level. Currently nifty consolidating in between range of 24250-24450 levels.

Surgical strike on Nifty call sellers at 24800-900Market Update: Nifty Outlook
Today, amid news of an Indian Army operation, Nifty opened with a significant gap down but swiftly recovered, showing strong upward momentum.
Currently, the chart structure indicates the need for a higher low to set the stage for the next leg of the uptrend towards the 24,800–24,900 zone. A flat opening in the next session could provide the ideal setup for a strong rally.
Notably, a sustained move above 24,500 could trigger a "surgical strike" on call sellers positioned at the 24,800–24,900 levels, potentially leading to sharp short-covering.
We recommend closely tracking price behavior near key support areas for confirmation of the next move.
Nifty Futures Intraday Trend Analysis for May 08, 2025Based on my analysis, Nifty Futures is likely to exhibit a bearish intraday trend tomorrow, with resistance around 24,500 and strong support near 24,260. This outlook does not factor in potential price gaps in either direction.
Traders are advised to conduct their own technical analysis before initiating any positions. Always trade with a well-defined stop-loss. This information is intended strictly for educational purposes.
