NIFTY--Support @19360 ??I am sharing the important levels of Support and Resistance. These levels play a crucial role in trading decisions, as they act as reliable markers of price movements.
------>>Support levels are price points where an asset tends to find buying interest, preventing it from falling further.
---->Resistance levels, on the other hand, are points where selling pressure typically prevents the asset from rising higher.
They serve as key reference points for technical analysis and are vital tools in successful trading strategies.
Trade safe...Thank you guys for your support
Niftytradesetup


#NIFTY Intraday Support and Resistance Levels - 20/10/2023Nifty will be gap down opening in today's session. After opening nifty start trading below 19600 level and then possible downside rally up to 19480 in today's session. in case nifty trades above 19630 level then the upside target can go up to the 19750 level.

NIFTY INTRADAY LEVELS FOR 20/10/2023BUY ABOVE - 19680
SL - 19640
TARGETS - 19720,19750,19780
SELL BELOW - 19600
SL - 19640
TARGETS - 19540,19500,19450
NO TRADE ZONE - 19600 to 19680
Previous Day High - 19680
Previous Day Low - 19510
I am sharing NIFTY levels this levels acts as important support & resistance for intraday. if you want to trade with this levels wait for 15 min Candle closing above that levels. You can trade with breakout and reversal both.
In this channel, I share my expertise in trading strategies, technical analysis, and market trends to help you make informed decisions in your trading ventures.
Stay tuned for daily updates, in-depth market analyses, and real-time trading scenarios to witness firsthand how we transform from Zero to Hero in the trading world. My Only aim is to empower you with the knowledge and skills necessary to navigate the complexities of the financial markets successfully.
Based on price action major support & resistance's are here, the red lines acts as resistances, the green lines acts as supports. If the price breaks the support/resistance, it will move to the next support/resistance line. White lines indicates previous day high & low, high acts as a resistance & low acts as a support for next day.
Please NOTE: this levels are for intraday trading only.
Disclaimer - All information on this page is for educational purposes only,
we are not SEBI Registered, Please consult a SEBI registered financial advisor for your financial matters before investing And taking any decision. We are not responsible for any profit/loss you made.
Request your support and engagement by liking and commenting & follow to provide encouragement
HAPPY TRADING 👍

NIFTY Analysis/Prediction for tomorrow 20-10-2023NSE:NIFTY Analysis/Prediction for tomorrow
If market opens Gap-Up (Above 19670)
🟢 Buy CE above 19750
✔️ Target Should be 19850
🔴 Avoid PE
If market opens flat or gap-down
🟢 Avoid CE
🔴 Buy PE below 19590
✔️ Target Should be 19500
Important Notes:
🚨 Gap-UP & Gap-Down more than 100 points wait for price action.
🚨 Gap-UP & Gap-Down up-to 60 points wait for a pullback.
⚠️ Wait for the 5-minute candle to close for confirmation.
⚠️ Trade Like Either SL or Target.
⚠️ Important: Always maintain your Risk & Reward Ratio.
Disclaimer:
I am not SEBI Registered Advisor.
My posts are purely for training and educational purposes.

NIFTY--Consolidation @19550-19450 ?? I am sharing the important levels of Support and Resistance. These levels play a crucial role in trading decisions, as they act as reliable markers of price movements.
------>>Support levels are price points where an asset tends to find buying interest, preventing it from falling further.
---->Resistance levels, on the other hand, are points where selling pressure typically prevents the asset from rising higher.
They serve as key reference points for technical analysis and are vital tools in successful trading strategies.
Trade safe...Thank you guys for your support

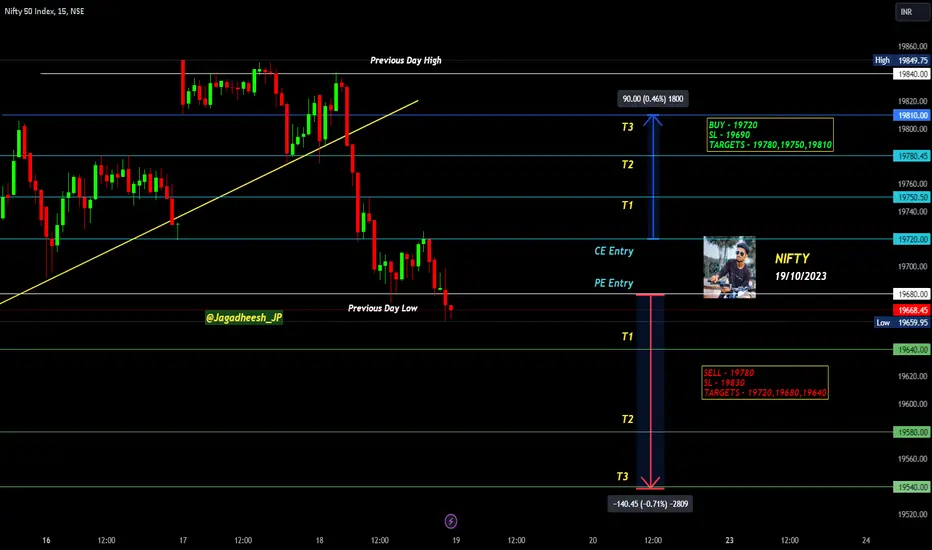
NIFTY INTRADAY LEVELS FOR 19/10/2023BUY - 19720
SL - 19690
TARGETS - 19780,19750,19810
SELL - 19780
SL - 19830
TARGETS - 19720,19680,19640
NO TRADE ZONE - 19680 to 19720
Previous Day High - 19840
Previous Day Low - 19660
I am sharing NIFTY levels this levels acts as important support & resistance for intraday. if you want to trade with this levels wait for 15 min Candle closing above that levels. You can trade with breakout and reversal both.
In this channel, I share my expertise in trading strategies, technical analysis, and market trends to help you make informed decisions in your trading ventures.
Stay tuned for daily updates, in-depth market analyses, and real-time trading scenarios to witness firsthand how we transform from Zero to Hero in the trading world. My Only aim is to empower you with the knowledge and skills necessary to navigate the complexities of the financial markets successfully.
Based on price action major support & resistance's are here, the red lines acts as resistances, the green lines acts as supports. If the price breaks the support/resistance, it will move to the next support/resistance line. White lines indicates previous day high & low, high acts as a resistance & low acts as a support for next day.
Please NOTE: this levels are for intraday trading only.
Disclaimer - All information on this page is for educational purposes only,
we are not SEBI Registered, Please consult a SEBI registered financial advisor for your financial matters before investing And taking any decision. We are not responsible for any profit/loss you made.
Request your support and engagement by liking and commenting & follow to provide encouragement
HAPPY TRADING 👍
NIFTY Trade Zone for Next Week (3-4 of Oct 2023)NSE:NIFTY
NIfty Trendline Support around 19500
Resistance Zone around 19800-19850

NIFTY--Liquidity lies @19500I am sharing the important levels of Support and Resistance. These levels play a crucial role in trading decisions, as they act as reliable markers of price movements.
------>>Support levels are price points where an asset tends to find buying interest, preventing it from falling further.
---->Resistance levels, on the other hand, are points where selling pressure typically prevents the asset from rising higher.
If price breaks the resistance, we have a chance of filling the bearish gap, soo keep in buyside until it touches the zone of resistance and bearish gap.
Take a look at these levels and trade accordingly. Recognizing and respecting these support and resistance levels can help traders make informed decisions and manage risk effectively. They serve as key reference points for technical analysis and are vital tools in successful trading strategies.
Trade safe...Thank you guys for your support

#NIFTY Intraday Support and Resistance Levels - 19/10/2023Nifty will be gap down opening in today's session. After opening nifty start trading below 19600 level and then possible downside rally up to 19530 in today's session. in case nifty trades above 19700 level then the upside target can go up to the 19820 level.

18 OCT 2023 BANKNIFTY SUPPORT AND RESISTANCE LEVELSHello Guys,
Good Morning everyone,
According to the data today market is going to open a Flat
After A Flat opening if Banknifty sustains Above 44500 and takes Support from 44500 then open target for T1-44700, T2-44800,T3-44900
If the Banknifty Flat opening sustains Below 44300 and takes resistance below 44300 then the open Targets for T1-44200, T2-44100,T3-44000
Major Levels 44500,44300,44200
If the market stands in this area of 44500 to 44300, then it is possible that even today the market will remain in the range.

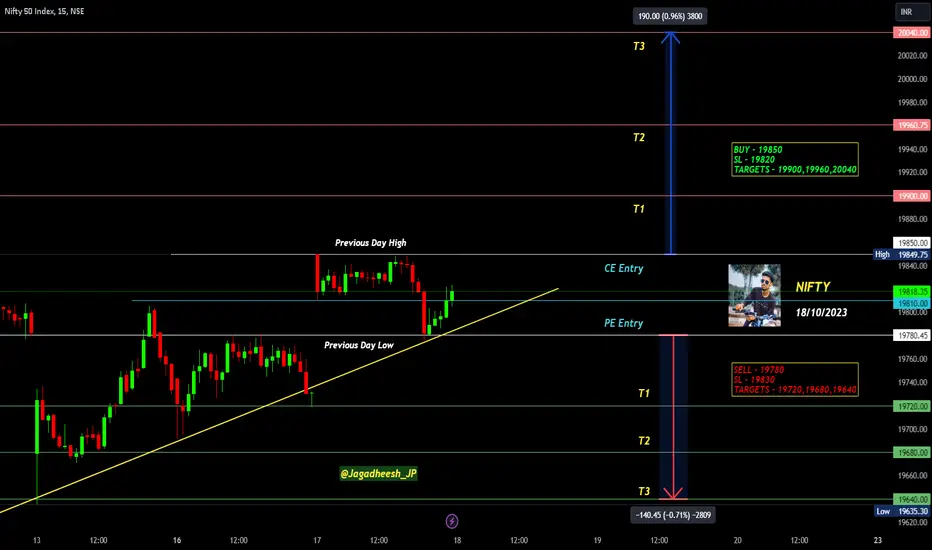
NIFTY INTRADAY LEVELS FOR 18/10/2023BUY ABOVE - 19850
SL - 19820
TARGETS - 19900,19960,20040
SELL BELOW - 19780
SL - 19830
TARGETS - 19720,19680,19640
NO TRADE ZONE - 19780 to 19850
Previous Day High - 19850
Previous Day Low - 19780
I am sharing NIFTY levels this levels acts as important support & resistance for intraday. if you want to trade with this levels wait for 15 min Candle closing above that levels. You can trade with breakout and reversal both.
In this channel, I share my expertise in trading strategies, technical analysis, and market trends to help you make informed decisions in your trading ventures.
Stay tuned for daily updates, in-depth market analyses, and real-time trading scenarios to witness firsthand how we transform from Zero to Hero in the trading world. My Only aim is to empower you with the knowledge and skills necessary to navigate the complexities of the financial markets successfully.
Based on price action major support & resistance's are here, the red lines acts as resistances, the green lines acts as supports. If the price breaks the support/resistance, it will move to the next support/resistance line. White lines indicates previous day high & low, high acts as a resistance & low acts as a support for next day.
Please NOTE: this levels are for intraday trading only.
Disclaimer - All information on this page is for educational purposes only,
we are not SEBI Registered, Please consult a SEBI registered financial advisor for your financial matters before investing And taking any decision. We are not responsible for any profit/loss you made.
Request your support and engagement by liking and commenting & follow to provide encouragement
HAPPY TRADING 👍
NIFTY--Near its Trendline??I am sharing the important levels of Support and Resistance. These levels play a crucial role in trading decisions, as they act as reliable markers of price movements.
------>>Support levels are price points where an asset tends to find buying interest, preventing it from falling further.
---->Resistance levels, on the other hand, are points where selling pressure typically prevents the asset from rising higher.
If price breaks the resistance, we have a chance of filling the bearish gap, soo keep in buyside until it touches the zone of resistance and bearish gap.
Take a look at these levels and trade accordingly. Recognizing and respecting these support and resistance levels can help traders make informed decisions and manage risk effectively. They serve as key reference points for technical analysis and are vital tools in successful trading strategies.
Trade safe...Thank you guys for your support

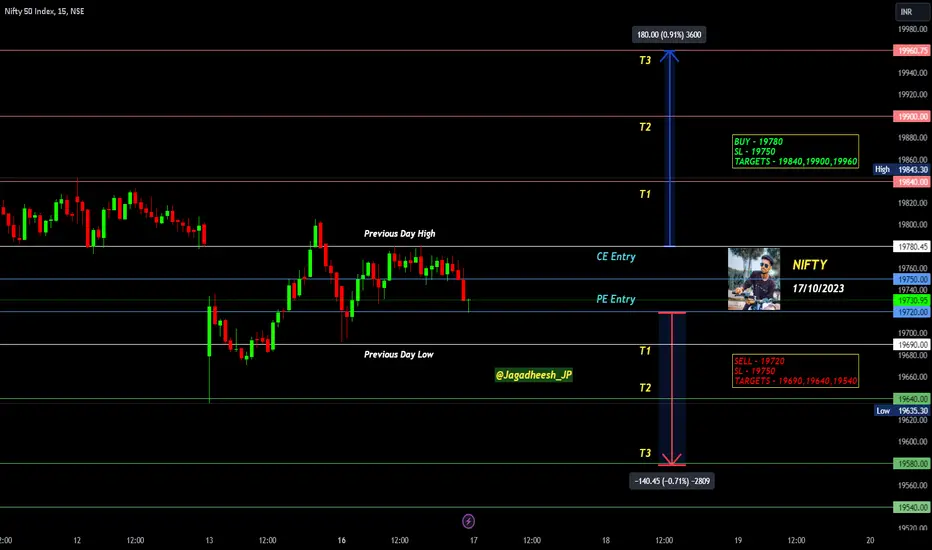
NIFTY INTRADAY LEVELS FOR 17/10/2023BUY ABOVE - 19780
SL - 19750
TARGETS - 19840,19900,19960
SELL BELOW - 19720
SL - 19750
TARGETS - 19690,19640,19540
NO TRADE ZONE - 19720 to 19780
Previous Day High - 19780
Previous Day Low - 19690
I am sharing NIFTY levels this levels acts as important support & resistance for intraday. if you want to trade with this levels wait for 15 min Candle closing above that levels. You can trade with breakout and reversal both.
In this channel, I share my expertise in trading strategies, technical analysis, and market trends to help you make informed decisions in your trading ventures.
Stay tuned for daily updates, in-depth market analyses, and real-time trading scenarios to witness firsthand how we transform from Zero to Hero in the trading world. My Only aim is to empower you with the knowledge and skills necessary to navigate the complexities of the financial markets successfully.
Based on price action major support & resistance's are here, the red lines acts as resistances, the green lines acts as supports. If the price breaks the support/resistance, it will move to the next support/resistance line. White lines indicates previous day high & low, high acts as a resistance & low acts as a support for next day.
Please NOTE: this levels are for intraday trading only.
Disclaimer - All information on this page is for educational purposes only,
we are not SEBI Registered, Please consult a SEBI registered financial advisor for your financial matters before investing And taking any decision. We are not responsible for any profit/loss you made.
Request your support and engagement by liking and commenting & follow to provide encouragement
HAPPY TRADING 👍
17 OCT 2023 BANKNIFTY SUPPORT AND RESISTANCE LEVELSHello Guys,
Good Morning everyone,
According to the data today market is going to open a gap up
After A gap up opening if Banknifty sustains Above 44200 and takes Support from 44200 then open target for T1-44300, T2-44400,T3-44600
If the Banknifty gap up opening sustains Below 44200 and takes resistance below 44200 then the open Targets for T1-44000, T2-43900,T3-43800
Major Levels 44200,44000,44400
If the market stands in this area of 44400 to 44200, then it is possible that even today the market will remain in the range.

NIFTY Analysis/Prediction for Monday 16-10-2023NSE:NIFTY Analysis/Prediction for tomorrow
If market opens between 19720-19780
🟢 Buy CE Above 19810
✔️ Target Should be 19860, 19990
🔴 Buy PE Only below 19690
✔️ Target Should be 19640, 19540
Important Notes:
🚨 Gap-UP & Gap-Down more than 100 points wait for price action.
🚨 Gap-UP & Gap-Down up-to 60 points wait for a pullback.
⚠️ Wait for the 5-minute candle to close for confirmation.
⚠️ Trade Like Either SL or Target.
⚠️ Important: Always maintain your Risk & Reward Ratio.
Disclaimer:
I am not SEBI Registered Advisor.
My posts are purely for training and educational purposes.
