Niftytrading
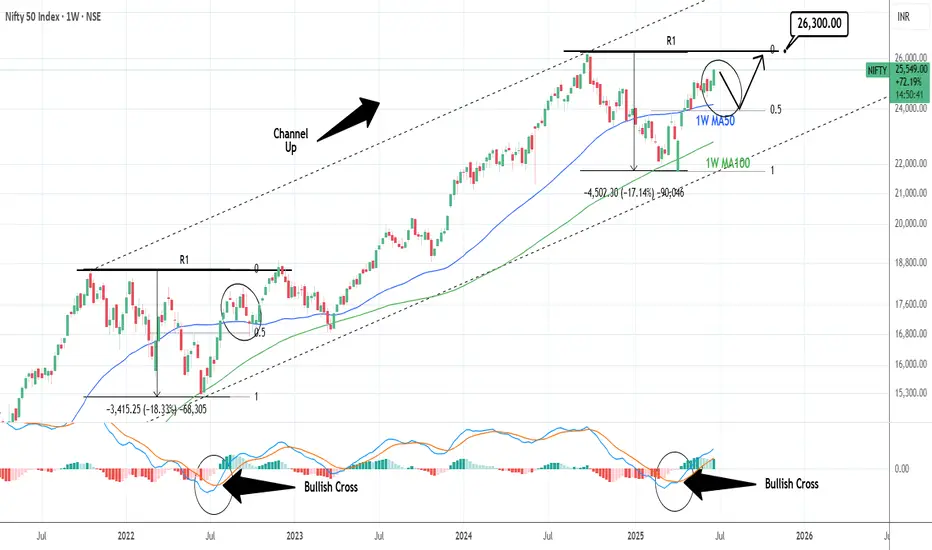
NIFTY: One more opportunity to buy lower.Nifty is on excellent bullish levels on its 1D technical outlook (RSI = 66.330, MACD = 172.380, ADX = 16.480), extending the bullish wave of the 4 year Channel Up. Being close to the R1 already, a pullback to the 0.5 Fib and the 1W MA50 isn't unlikely, as it is what happened in September 2022. That will be our final opportunity to buy low and target the R1 level (TP = 26,300).
## If you like our free content follow our profile to get more daily ideas. ##
## Comments and likes are greatly appreciated. ##
Nifty Analysis EOD – June 18, 2025 – Wednesday🟢 Nifty Analysis EOD – June 18, 2025 – Wednesday 🔴
⚖️ Dhamakedar Start, But Indecisive Close – Weekly Expiry Caution Ahead
Nifty opened with a 65-point gap-down at 24,788.35, but what followed was a power-packed bullish start — within just 25 minutes, it surged over 150 points, hitting a day high of 24,947.55.
However, the euphoria didn’t last.
As the session progressed, the index gradually gave up all its gains, slipped below the previous day’s low, and finally found support at 24,750, a critical level. By the end of the day, Nifty settled around the opening zone at 24,812.05, just +23 points above open, while net change remained −41.35 points from the previous close.
The day showcased both strength and weakness — a typical "everyone-expected-fall-but-it-didn't-fall-enough" kind of day. The long upper wick reflects failed attempts by bulls, while the lack of breakdown keeps the bears in check.
Tomorrow is weekly expiry — caution is advised.
🕯 5 Min Time Frame Chart with Levels
🕯 Daily Time Frame Chart
🕯 Daily Candle Breakdown
Open: 24,788.35
High: 24,947.55
Low: 24,750.45
Close: 24,812.05
Change: −41.35 (−0.17%)
📊 Candle Structure Breakdown
Real Body: 23.70 pts → ✅ Green Candle (tiny body)
Upper Wick: 135.50 pts
Lower Wick: 37.90 pts
🔍 Interpretation
Strong bullish momentum early on, but buyers failed to hold above 24,900.
Long upper wick signals supply or profit-booking at higher levels.
Price closed near open despite wide range → indecision between bulls and bears.
🕯 Candle Type
🟨 Spinning Top – A textbook indecisive candle, often seen at turning points or during pauses in trend.
📌 Key Insight
Buyers couldn’t reclaim or close above 24,950 — resistance strengthened.
Support held at 24,750 — but barely.
Watch 24,950 on upside and 24,750 on downside — a breakout from either may decide expiry-day trend.
🛡 5 Min Intraday Chart
⚔️ Gladiator Strategy Update
ATR: 252.34
IB Range: 170.65 → Medium IB
Market Structure: ⚖️ Balanced
Trades:🚫 Short Trigger at 12:45 : Trapped - SL Hit
📌 Support & Resistance Zones
Resistance Levels
24,894 ~ 24,882
24,972 ~ 25,000
25,060 ~ 25,080
25,102 ~ 25,125
Support Levels
24,825 ~ 24,847
24,725 ~ 24,735
24,660
24,590
💭 Final Thoughts
When price travels 200 points but closes flat, it tells you something: Smart money is waiting.Weekly expiry ahead could bring unexpected moves.✅ Stay nimble. Stay alert.
🧠 “When in doubt, let the market shout — not whisper. Listen for the breakout.”
✏️ Disclaimer
This is just my personal viewpoint. Always consult your financial advisor before taking any action.

Nifty 50 If you find this helpful and want more FREE forecasts in TradingView, Hit the 'BOOST' button
Drop some feedback in the comments below! (e.g., What did you find most useful?
How can we improve?)
Your support is appreciated!
Now, it's your turn!
Be sure to leave a comment; let us know how you see this opportunity and forecast.
Have a successful week
DISCLAIMER: I am NOT a SEBI registered advisor or a financial adviser. All the views are for educational purpose only

Nifty Spot Daily Trend Analysis from April 25, 2025Technical Outlook:
Nifty Spot is approaching a potential resistance near the Gann 720° level at 24,539. A minor correction appears likely, and we are currently awaiting short signal confirmation from one of our proprietary indicators. Should a decline occur, the index may find support around the Sine Wave level of 23,398. A break below this level could suggest a continuation of the bearish momentum.
At present, most indicators are still trending upwards. However, the bar formations on the chart hint at a possible reversal. Once the MastersSignal confirms a short setup, we will reassess confluence around the Gann 720° value to strengthen conviction.
Disclaimer: This is my personal technical view. Traders should conduct their own analysis and implement strict risk management before initiating any trades.

Nifty--Demand Zone and Liquidity @23400 Nifty index is broken the strong resistance at 23800 levels and taken the liquidity at 24220 levels...
now price action is sideways or trading in a range bound market.
expecting some pullback for further continuation....
wait for buyers exhaustion before short...
we have a clear demand zone at 23400 levels...
when price confirms the bullishness here, after the liquidity grab below the demand will observe a strong up move again...
there are bullish gaps @22800 levels...price has to give pullback for further upside move...
the above one is a clear buying plan for the targets of 24800 and 25200 liquidity.
--->>still we have no sign of bearishness is seen in Nifty.

TIME TO BUY NIFTY AGAIN!! NIFTY SEEMS POSITIVEHello All!!
I am back with totally different opinion on Nifty Futures, I had checked with Media and some published articles, most of all are Bearish On Nifty for coming day!!
But I don't think so.......
Today on 04-04-2025, Nifty is negative by more than -1.5%.
I think it is very right time to buy Nifty!!
Nifty futures CMP:22950.00
Nifty has beached its valuable support at 23,270.00
Now, Nifty's next big support is at 22,930.00
RSI is just above it's 40 Mark level!!
If RSI manages to hold that 40 Mark level, Nifty is going to switch it's direction and start moving upwards.
Simple terms: Risk to Reward ratio is most favorable at current market price.
So, if Nifty holds 22,930.00 level and RSI holds it's 40 Mark level, Bulls are back in market.
Target: 24,000.00 with in this month.
Stoploss: Mange as per your risk tolerance capacity.
Let's hope for the best!!
Be cautious, Market is teaching us something which is not so often!!
Note: This is just my attempt to Analyze Nifty chart, I don't recommend any one to trade or invest based on this study. This is just of educational purpose.


NIFTY : Trading Levels and Plan for 28-Mar-2025📌 NIFTY Trading Plan – 28-Mar-2025
📊 Market Overview:
Nifty closed at 23,601, consolidating within a No Trade Zone after a strong uptrend. The market is at a critical juncture, and the price action at key levels will determine the next directional move.
This plan provides clear trade setups for different opening scenarios and helps you navigate market volatility with a structured approach.
🔼 Scenario 1: Gap-Up Opening (100+ points above 23,700)
A gap-up opening above 23,700 will push Nifty closer to the Last Intraday Resistance Zone (23,772). The key factor will be whether Nifty sustains above resistance or faces rejection.
✅ Plan of Action:
If Nifty sustains above 23,772, it can move towards the next resistance at 23,931. A breakout above 23,931 could trigger a rally towards 24,000+, but watch for profit booking at higher levels.
If price faces rejection at 23,772 and reverses, expect a pullback towards 23,650 → 23,600. A strong rejection here could lead to an intraday sell-off.
Avoid fresh longs inside 23,700 – 23,772, as this area may act as a profit-booking zone. Wait for confirmation before taking trades.
🎯 Pro Tip: If the gap-up is quickly filled within the first 15 minutes, it signals weak buying strength and increases the probability of an intraday correction.
⚖ Scenario 2: Flat Opening (Within ±100 points, around 23,600)
A flat opening suggests indecision among traders, and the market will likely take direction after the first few candles. The best strategy is to trade breakouts or breakdowns from key levels.
✅ Plan of Action:
Upside case: If Nifty breaks and sustains above 23,650, it may head towards 23,700 → 23,772. Observe the price action near resistance before taking fresh longs.
Downside case: If Nifty breaks below 23,520, it could test 23,450 → 23,300. A breakdown below 23,300 will turn the trend bearish.
Sideways caution: If Nifty remains inside the No Trade Zone (23,451 – 23,642), avoid taking trades as volatility could trap both buyers and sellers.
🎯 Pro Tip: In a flat opening scenario, wait for a clear 15-minute candle close above or below key levels before entering trades.
🔽 Scenario 3: Gap-Down Opening (100+ points below 23,500)
A gap-down below 23,500 could indicate profit booking or fresh selling pressure. The critical factor will be whether buyers defend key support zones.
✅ Plan of Action:
If price sustains below 23,500, expect a decline towards 23,300. A breakdown below 23,300 may accelerate selling towards the Buyer’s Support Zone (23,136 – 23,300).
If price finds support at 23,300 and rebounds, it may attempt a recovery towards 23,450 → 23,520. A strong close above 23,520 could shift momentum back to the bulls.
Be cautious of bear traps – If the market gaps down but quickly recovers, it could trigger short covering, leading to an upside reversal.
🎯 Pro Tip: If the gap-down occurs near a strong buyer’s support zone, wait for a bullish price action confirmation before entering long trades.
⚠️ Risk Management Tips for Options Traders
🔹 Avoid over-leveraging – Use proper position sizing to manage risk.
🔹 Theta Decay Awareness – If the market consolidates, option premiums will erode rapidly.
🔹 Use Spreads for Protection – Instead of naked options, use spreads to limit risk and improve probability.
🔹 Trade at Key Levels – Avoid impulsive trades; focus on defined support and resistance zones.
📌 Summary & Conclusion
📍 Key Levels to Watch:
🟥 Resistance: 23,772 → 23,931 → 24,000
🟧 No Trade Zone: 23,451 – 23,642
🟩 Support: 23,520 → 23,300 → 23,136
🔸 Bullish Bias: Above 23,772, targeting 23,931 – 24,000
🔸 Bearish Bias: Below 23,500, expecting a fall towards 23,300 – 23,136
🔸 Neutral/Choppy: Inside 23,451 – 23,642, avoid unnecessary trades
🎯 Final Advice:
Stick to the structured trading plan and execute only at key levels.
Avoid emotional trading—wait for confirmation before entering trades.
The first 15-30 minutes after market open will provide better clarity—observe price action before committing to a trade.
📢 Disclaimer
I am not a SEBI-registered analyst. This trading plan is for educational purposes only. Please conduct your own research or consult a financial advisor before making any trades.

Nifty Futures intraday trend for March 25, 2025Nifty Futures broke the key resistance at 23623 and closed higher and the further uptrend is anticipated to take resistance at 23825.
Nifty futures may begin with a gap down opening tomorrow ie March 25th and a down trend in the morning may give us an opportunity to enter long.

Nifty Futures Intraday Trend for March 24, 2025I foresee a bullish trend for the day with a strong support at 23472. The Nifty Futures likely to see the resistance at 23594 and 23672. If breaks 23672, then will move to 23748.
Small traders always trade with Stop-Loss.


BULLISH RSI DIVERGENCE IN NIFTY Bullish rsi divergence in hrly timeframe
Nifty trading on breakout retest zone
Long wicks on bottom indicates buying
On Bigger TF we can see contraction... Big move expected in days/weeks to come

NIFTY : Trading levels and Plan for 14-FEB-2025🔹 Key Levels:
📌 Resistance Zones:
🔴 Last Intraday Resistance: 23,262 – 23,306
🔴 Opening Resistance: 23,119 – 23,185
📌 Support Zones:
🟢 Opening Support/Resistance: 23,015 – 23,019
🟢 Buyer’s Support at Golden Retracement: 22,922 – 22,880
🟢 Stronger Buyer’s Support for Sideways/Consolidation: 22,677 – 22,742
📌 EMA: Price is reacting to the moving average, which could act as dynamic support/resistance.
📊 1️⃣ Gap-Up Opening (100+ points above previous close)
If NIFTY opens above 23,185:
Watch for rejection at 23,262 – 23,306: If price struggles, consider a short trade with SL above 23,320. Target: 23,185 – 23,100.
Sustained breakout of 23,306? Expect bullish momentum. Enter on a retest for targets 23,350 – 23,400.
Avoid impulsive longs at open: Wait for price to consolidate before entering trades.
💡 Pro Tip: If price rejects 23,262, sellers might step in aggressively. Consider buying Put options cautiously.
📊 2️⃣ Flat Opening (±50 points from previous close)
If NIFTY opens near 23,000 - 23,100:
Opening Support/Resistance Zone (23,015 – 23,019): This level will decide the market direction.
Break above 23,100? Expect bullish movement to 23,185. Go long above 23,105 with SL at 23,050.
Break below 23,015? Expect downside movement toward 22,922. Short below 23,010 with SL at 23,050.
💡 Pro Tip: In a flat opening, let price settle before making a decision. Patience pays!
📊 3️⃣ Gap-Down Opening (100+ points below previous close)
If NIFTY opens near 22,880 or below:
22,880 – 22,922 is a retracement support: If price holds, expect a bounce back. Go long above 22,900 with SL at 22,850.
Break below 22,880? Next major support is 22,677 – 22,742. Short below 22,870 with SL at 22,950.
If price reaches 22,677 and holds, expect a bounce. Look for buying opportunities around this level.
💡 Pro Tip: In a gap-down, avoid panic trades. Wait for proper confirmation before entering.
⚠️ Risk Management Tips for Options Trading
📌 Never chase a trade. Let price confirm the level before entering.
📌 Use stop-losses strictly. Protect your capital at all times.
📌 Avoid trading in the No Trade Zone. This is where stop-losses get hunted easily.
📌 Monitor IV (Implied Volatility). If IV is high, options premiums might be inflated. Consider spreads instead of naked options.
🔥 Summary & Conclusion
✅ Key Resistance: 23,119 – 23,185 / 23,262 – 23,306
✅ Key Support: 23,015 – 23,019 / 22,922 – 22,880 / 22,677 – 22,742
✅ Gap-Up: Watch resistance at 23,262. Breakout = bullish, rejection = short.
✅ Flat Opening: Wait for breakout/breakdown from Opening Support before entering.
✅ Gap-Down: 22,880 is crucial. Holding = bounce, breakdown = more downside.
🎯 Stick to the plan, follow discipline, and manage your risks!
⚠ Disclaimer: I am NOT a SEBI-registered analyst. This analysis is for educational purposes only. Trade at your own risk.

NIFTY : Trading Levels and Plan for 13-Feb-2025
🔹 Key Levels:
📌 Resistance: 23,205 / 23,298 – 23,332 (Last Intraday Resistance)
📌 Support: 22,970 / 22,873 – 22,893 / 22,660 / 22,508
📌 No Trade Zone: 23,049 - 23,103 (Avoid trading inside this range)
📊 1️⃣ Gap-Up Opening (100+ points above previous close)
If NIFTY opens above 23,205:
Watch for rejection at 23,298 – 23,332: If price struggles, consider a short trade with SL above 23,350. Target: 23,205 – 23,100.
Sustained breakout of 23,332? Expect bullish momentum. Enter on a retest for targets 23,400 – 23,450.
Avoid impulsive longs at open: Wait for price to consolidate before entering trades.
💡 Pro Tip: If price rejects 23,298, sellers might step in aggressively. Consider buying Put options cautiously.
📊 2️⃣ Flat Opening (±50 points from previous close)
If NIFTY opens near 23,000 - 23,100:
No Trade Zone (23,049 - 23,103): Avoid trading here. Wait for price to break out clearly.
Break above 23,103? Expect bullish movement to 23,205. Go long above 23,105 with SL at 23,050.
Break below 23,049? Expect downside movement toward 22,970. Short below 23,045 with SL at 23,100.
💡 Pro Tip: In a flat opening, let price settle before making a decision. Patience pays!
📊 3️⃣ Gap-Down Opening (100+ points below previous close)
If NIFTY opens near 22,873 or below:
22,873 as support? If price holds, expect a bounce back. Go long above 22,900 with SL at 22,850.
Break below 22,873? Next major support is 22,660. Short below 22,870 with SL at 22,950.
If price reaches 22,660 and holds, expect a bounce. Look for buying opportunities around this level.
💡 Pro Tip: In a gap-down, avoid panic trades. Wait for proper confirmation before entering.
⚠️ Risk Management Tips for Options Trading
📌 Never chase a trade. Let price confirm the level before entering.
📌 Use stop-losses strictly. Protect your capital at all times.
📌 Avoid trading in the No Trade Zone. This is where stop-losses get hunted easily.
📌 Monitor IV (Implied Volatility). If IV is high, options premiums might be inflated. Consider spreads instead of naked options.
🔥 Summary & Conclusion
✅ Key Resistance: 23,205 / 23,298 – 23,332
✅ Key Support: 22,970 / 22,873 – 22,893 / 22,660 / 22,508
✅ No Trade Zone: 23,049 - 23,103
✅ Gap-Up: Watch resistance at 23,298. Breakout = bullish, rejection = short.
✅ Flat Opening: Wait for breakout/breakdown from No Trade Zone before entering.
✅ Gap-Down: 22,873 is crucial. Holding = bounce, breakdown = more downside.
🎯 Stick to the plan, follow discipline, and manage your risks!
⚠ Disclaimer: I am NOT a SEBI-registered analyst. This analysis is for educational purposes only. Trade at your own risk.


NIFTY - Trading levels and Plan for 05-Feb-2025🔹 NIFTY TRADING PLAN – 05-FEB-2025 🔹
📍 Previous Close: 23,707.70
📍 Key Levels to Watch:
🔸 Resistance Zone: 23,743 - 23,845
🔹 Opening Support Zone: 23,591 - 23,644
🟢 Last Intraday Support: 23,491
🟩 Buyers’ Strong Support: 23,345 - 23,388
🎯 Profit Booking Zone: 24,067 - 24,155
🔵 POSSIBLE OPENING SCENARIOS & TRADING STRATEGY 🔵
📈 Gap Up Opening (100+ Points Above 23,807) – Bullish to Cautious Approach
📌 If Nifty opens with a gap-up above 23,807+ , traders should wait for initial price action.
📌 A sustained move above 23,845 can trigger bullish momentum towards 24,067 - 24,155 (Profit Booking Zone).
📌 If Nifty struggles near 23,845 , expect sideways movement or a potential reversal to test 23,743 - 23,707 .
📌 Trade Setup:
✅ Buy on retracement if 23,743 acts as support after a pullback.
🚨 Avoid aggressive buying near resistance without confirmation.
↔️↔️↔️
📊 Flat Opening (Between 23,683 - 23,743) – Key Zone for Decision Making
📌 A flat opening within 23,683 - 23,743 keeps the market in a neutral-to-bullish zone.
📌 If Nifty holds above 23,707 , we can see a push towards 23,845 .
📌 Failure to hold 23,707 might bring weakness towards 23,644 - 23,591 (Opening Support) .
📌 Trade Setup:
✅ If Nifty stays above 23,707 for 15-30 minutes, a breakout trade towards 23,845 is possible.
🚨 If it breaks below 23,644, avoid longs and wait for a deeper support test.
↔️↔️↔️
📉 Gap Down Opening (100+ Points Below 23,607) – Caution Required
📌 A gap-down below 23,607 will bring pressure on support levels.
📌 23,591 - 23,491 is a key demand zone; a strong bounce from here can offer buying opportunities.
📌 If selling continues and Nifty breaks below 23,491 , the next major support is 23,345 - 23,388 .
📌 Trade Setup:
✅ Look for reversal signs near 23,491 - 23,345 before entering long trades.
🚨 If Nifty breaks and sustains below 23,345, expect further downside.
⚠️ RISK MANAGEMENT & OPTIONS TRADING TIPS ⚠️
🔹 Use strict stop-losses based on an hourly close.
🔹 Avoid chasing trades at extreme levels; wait for pullbacks.
🔹 For options trading, consider ATM/ITM contracts for better liquidity.
🔹 Time decay will impact weekly options—exit early if momentum slows.
🔹 Hedge positions if volatility spikes unexpectedly.
📌 SUMMARY & CONCLUSION 📌
✅ Bullish Bias above 23,743 targeting 23,845 - 24,067.
❌ Bearish Break below 23,591 may push towards 23,491 - 23,345.
📊 Key Zone: 23,707 - 23,743—market reaction here will decide the trend.
📌 Wait for confirmation at crucial levels before entering trades!
⚠️ DISCLAIMER ⚠️
🔹 I am not a SEBI-registered analyst. This trading plan is for educational purposes only.
🔹 Please do your own research or consult with a financial advisor before making trading decisions.

NIFTY : Trading levels and Plan for 03-Feb-2025NIFTY Trading Plan for 03-Feb-2025
Key Levels to Watch: Resistance Zones: 🔴 Intraday Resistance Zone: 23,622 - 23,672🔴 Profit Booking / Sideways Zone: 23,822
Support Zones: 🟠 Opening Support / Resistance Zone: 23,475 - 23,565🟢 Opening Support at Retracement: 23,367🟢 Last Intraday Support (Must Try Zone): 23,229 - 23,259🟢 GAP-UP Opening (100+ Points) (Typically above 23,600 region)
➡️ If NIFTY opens above 23,565 and sustains, we need to observe price action at 23,622 - 23,672 (intraday resistance zone).
Bullish Scenario: If price consolidates above 23,672 and breaks out with volume, expect a rally towards 23,822 (profit booking zone). 📈📌 Entry: Above 23,672🎯 Target: 23,750 - 23,822❌ Stop Loss: Below 23,600
Bearish Rejection: If price rejects from 23,672 and fails to sustain, expect a pullback towards 23,500 - 23,475 .📌 Entry: Below 23,620 after confirmation🎯 Target: 23,500 - 23,475❌ Stop Loss: Above 23,680
📝 Educational Tip: In strong gap-up scenarios, avoid chasing the market immediately. Let the price consolidate near key resistance levels before taking a trade.
↔️ Sideways Possibility: If NIFTY stays between 23,565 - 23,672 , it may remain range-bound. Wait for a breakout.
⚖️ FLAT Opening (Near 23,470 - 23,500) ➡️ A flat opening would indicate market indecision and a need for further confirmation.
Bullish Bias: If price takes support at 23,475 - 23,500 and starts moving up, it can retest 23,622 , then 23,672 .📌 Entry: Above 23,500 after bullish confirmation🎯 Target: 23,622 - 23,672❌ Stop Loss: Below 23,450
Bearish Breakdown: If NIFTY breaks below 23,475 , expect a move towards 23,367 or even 23,259 (last intraday support).📌 Entry: Below 23,475🎯 Target: 23,367 - 23,259❌ Stop Loss: Above 23,525
📝 Educational Tip: Flat openings require patience. Let the market establish a clear direction before entering. Avoid overtrading in a choppy market.
🔴 GAP-DOWN Opening (100+ Points) (Typically below 23,375)
➡️ If NIFTY opens below 23,367 , it indicates weakness and possible downside towards 23,259 - 23,229 .
Bearish Continuation: If price sustains below 23,367 , expect selling pressure towards 23,259 and 23,229 .📌 Entry: Below 23,367🎯 Target: 23,259 - 23,229❌ Stop Loss: Above 23,400
Bounce Back Scenario: If NIFTY takes support at 23,259 and shows strong reversal, we may see a move back towards 23,367 or even 23,475 .📌 Entry: Above 23,275 after confirmation🎯 Target: 23,367 - 23,475❌ Stop Loss: Below 23,220
📝 Educational Tip: In gap-down scenarios, watch for institutional buying or aggressive selling. Avoid counter-trend trades without confirmation.
📌 Risk Management Tips for Options Traders ✅ Trade with Defined Risk: Always set a stop loss before entering a trade.✅ Avoid Overleveraging: Keep position sizes within your risk tolerance.✅ Watch for Volatility: Sudden spikes in IV (Implied Volatility) can impact options pricing.✅ Exit at Key Levels: If a trade reaches resistance/support, book partial profits.✅ Use Spreads for Safety: Instead of naked options, consider spreads to minimize risk.
📊 Summary & Conclusion Gap-Up: Watch for resistance at 23,672 ; breakout targets 23,822 . Flat Opening: Key support at 23,475 ; break above 23,500 can lead to bullish movement. Gap-Down: Below 23,367 , expect 23,259 - 23,229 ; bounce possible from support.
🛑 Disclaimer: I am not a SEBI-registered analyst. This analysis is for educational purposes only. Trade at your own risk.
🚀 Happy Trading & Stay Disciplined! 💰

NIFTY : Trading levels and Plan for 31-Jan-2025📌 Nifty Trading Plan – 31st January 2025 📈🔥
A structured trading plan is essential for navigating market movements with confidence. Let's analyze Nifty for 31st January 2025, incorporating key levels and different opening scenarios to optimize trade entries and exits.
📍 Key Levels:
Opening Resistance / Sideways / Profit Booking Zone: 23,415 - 23,500
Last Intraday Resistance: 23,677
Opening Support / Resistance: 23,227 - 23,214
Opening Support Zone: 23,047 - 23,108
Last Intraday Support: 22,897
🚀 Scenario 1: Gap-Up Opening (100+ points above 23,400)
If Nifty opens above 23,400 , it will enter the profit booking zone of 23,415 - 23,500 , where resistance may come into play. A cautious approach is required to avoid getting trapped in a false breakout.
If Nifty sustains above 23,500 , a move towards 23,677 (last intraday resistance) is possible.
If price faces rejection at 23,500 , expect a pullback to 23,415 . Failure to hold this level may lead to further decline toward 23,297 .
Avoid chasing long positions immediately; wait for a retest of support zones for better risk-reward trades.
👉 Pro Tip: If 23,500 is decisively broken with strong volume, it may trigger a fresh rally, offering buying opportunities on dips.
📊 Scenario 2: Flat Opening (23,250 - 23,400)
A neutral start within this range suggests the market is waiting for direction. Here’s how to approach it:
If Nifty holds 23,227 - 23,214 , it could attempt a gradual rise towards 23,400+ .
A breakout above 23,400 will open doors for an upside move toward 23,500 .
A failure to hold 23,214 may push the index down to test the 23,108 - 23,047 support zone.
Traders should watch for price action near 23,227 , as it could act as an intraday pivot for directional moves.
👉 Pro Tip: In a sideways market , consider using options scalping strategies rather than directional trades.
📉 Scenario 3: Gap-Down Opening (100+ points below 23,200)
A weak opening below 23,200 could indicate short-term bearishness. It’s important to assess whether Nifty finds support at lower levels or continues declining.
If Nifty holds 23,108 - 23,047 , expect a pullback rally toward 23,214 - 23,227 .
A breakdown below 23,047 can accelerate selling pressure toward 22,897 (last intraday support).
Look for bullish reversal signs near 23,047 - 23,000 before considering long positions.
If the market forms a lower high after a gap-down, follow the trend rather than trying to catch a falling knife.
👉 Pro Tip: If Nifty struggles to reclaim 23,214 after a gap-down, selling on rise could be a better approach.
🛑 Risk Management & Options Trading Tips: 🎯
Always define a stop-loss before entering a trade to protect your capital.
Avoid overleveraging in uncertain market conditions—risk management is key! 💰
In case of high volatility , wait for confirmation instead of chasing trades impulsively.
Consider hedging strategies (like spreads) to limit losses in options trading.
Check Open Interest (OI) data before trading options to gauge market sentiment.
📌 Summary & Conclusion:
✅ Nifty is at a critical juncture, with 23,227 - 23,214 acting as an opening pivot zone.
✅ Bullish Bias above 23,500 , targeting 23,677 .
✅ Bearish Outlook below 23,047 , targeting 22,897 .
✅ Discipline & patience are crucial—wait for confirmation before taking positions! 🚀
⚠️ Disclaimer: I am not a SEBI-registered analyst. This plan is for educational purposes only . Trade at your own risk and manage capital wisely! 📊🔥

NIFTY : Trading levels and plan for 30-Jan-2025📊 Nifty Trading Plan for 30-Jan-2025
This trading plan covers all possible opening scenarios (Gap-Up, Flat, and Gap-Down) along with crucial resistance and support levels. Follow these levels carefully to maximize your trades.
📈 Scenario 1: Gap-Up Opening (100+ points above 23,176)
If Nifty opens with a gap-up, it will likely test the resistance levels. Key focus points:
🔹 Opening Resistance Zone: 23,253 – 23,287 – If price sustains above this level, it can move towards 23,416. Consider call option trades if momentum remains strong with stop-loss at 23,200.
🔹 Major Resistance Zone: 23,416 – This is a crucial level where sellers might become active. Avoid chasing longs here and book profits.
🔹 If Nifty rejects from 23,253, watch for a retracement towards 23,176 before taking fresh trades.
💡 Pro Tip: Always wait for a retest and confirmation before entering a trade in a gap-up market.
📉 Scenario 2: Flat Opening (Near 23,176)
A flat opening means price action will revolve around the Opening Support / Resistance Zone: 23,176 – 23,200. Key levels to monitor:
🔹 If price sustains above 23,200, expect bullish movement towards 23,253, followed by 23,287. Enter call options only after a breakout confirmation.
🔹 If price rejects from 23,176, it may slip towards 23,142, and if this breaks, expect a drop to 23,059. Put options can be considered here.
🔹 Avoid trading in the Opening Support / Resistance Zone unless a clear breakout/breakdown happens.
💡 Pro Tip: Flat openings often create a trap in the first 15 minutes. Let the market settle before taking a position.
⬇️ Scenario 3: Gap-Down Opening (100+ points below 23,176)
A bearish gap-down could test support levels. Here’s how to trade it:
🔹 Opening Support Zone: 23,059 – If this zone holds, expect a pullback to 23,176. A strong reversal from this level can provide a good call option opportunity.
🔹 If 23,059 breaks, expect further downside towards 22,983, followed by 22,871 (Golden Retracement Zone). Look for put options with SL at 23,059.
🔹 If price sustains below 22,871, expect high volatility. Avoid aggressive long positions.
💡 Pro Tip: In gap-down markets, avoid catching falling knives. Look for proper support confirmation before entering long trades.
🛡️ Risk Management Tips for Options Trading
🔹 Keep a fixed risk per trade (1-2% of capital) to avoid big losses.
🔹 Use ATM (At-the-Money) or slightly OTM (Out-of-the-Money) options for better liquidity.
🔹 Don't overtrade. If your first 2 trades fail, step back and analyze the market.
🔹 Follow proper stop-loss levels to protect capital.
📊 Summary and Conclusion
Resistance Zones: 23,200, 23,253-23,287, 23,416
Support Zones: 23,176, 23,142, 23,059, 22,983, 22,871
Opening Support / Resistance Zone: 23,176 – 23,200 (Wait for breakout/breakdown)
📌 Stick to the plan and manage risk wisely. Market structure matters more than emotions!
⚠️ Disclaimer: I am not a SEBI-registered analyst. This trading plan is for educational purposes only. Trade at your own risk. 😊

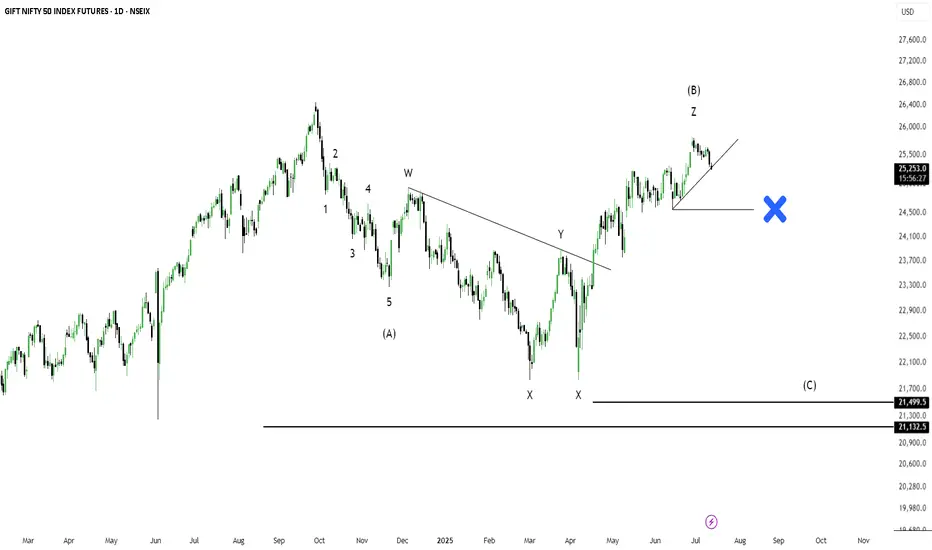
The Wave is Shifting: Anticipate NIFTY’s Next Move!Dear Traders,
I hope this message finds you well in your trading endeavors and personal pursuits. I am excited to share a compelling opportunity with you through a new NIFTY analysis that sheds light on the continuation of the market shift.
Preliminary Analysis Overview:
The correction initiated on September 27, 2024, is a correction for the move from June 17, 2022, to September 27, 2024 (15,183.40 to 26,277.35). This move has spanned over 120 weeks (834 days) in time and 11,093.95 points in price. This necessitates a long-term and deeper correction, which is currently underway. This can be visually represented by the trend lines:
The downward trend from the all-time high continues, which is currently experiencing a corrective phase within a larger correction.
There are two potential phases for the ongoing trend:
Phase I:
The initial phase of correction primarily tested the .236 R of the aforementioned motive wave (refer to the figure below):
Following the correction, there is a correction within the correction in a larger degree (although the primary downtrend remains intact).
This internal correction is anticipated to rise further to test 0.146 R and 0.073 R of the long-term bull market (serving as potential resistances).
RI – 24,254.10
RII – 24,600 ~24,657
RIII – 25,100 ~25,120
*These values are not actual but merely levels.
Time resistances are anticipated on January 9th and February 17th (of considerable strength).
Reference:
Phase II:
Following the completion of the internal correction, the market is anticipated to resume its current downward trend in a more significant manner to test the 38.2 R (21,500 levels) + static support junction, which will be further discussed as the market evolves.
---
**Important Dates to Remember: **
Please note the following significant economic indicators and their release dates:
**January 8, 9, and 10: ** Federal Open Market Committee (FOMC) meeting and employment data release (NFP).
**January 13 and 14: ** Inflation data release.
**January 13-16: ** Sales and inflation data release.
---
**Final Verdict: **
The current uptrend is considered interim. The primary trend remains downward and is anticipated to persist further and deeper. This trend is expected to test the 38.2% resistance level coinciding with the 21,360-support level.
---
**Strategy: **
Given the prevailing market conditions, adopting a bullish stance appears prudent. Key levels to monitor include 24,657 and 25,120, which are expected to be tested. It is imperative to remain vigilant and informed about potential opportunities that may arise.
------
Fellow Traders,
The creation of this valuable analytical resource has required countless hours of dedication and effort. If you find it useful, I humbly request your support by boosting the idea and following me (updates will be provided via this post, new posts, and through minds). Your comments and thoughts on this idea are highly valued, and I am committed to engaging with each one personally.
Thank you for investing your time in reading this article.
Wishing you profitable and fulfilling trading endeavors!
Disclaimer:
Before concluding, I must emphasize that the insights shared are based on my analysis. It is crucial for you to conduct your own research and, if necessary, consult with a financial advisor before making any trading decisions. The dynamic nature of financial markets necessitates that your strategies align with your financial objectives and risk tolerance.
Nifty Intraday and Swing Trade Analysis For 06/01/25 And weekly
In this post, I’m sharing my detailed analysis of Nifty 50’s recent price action, focusing on intraday and swing trades. This setup incorporates technical patterns, volume confirmation, and Smart Money Concepts (SMC) to identify high-probability trade opportunities.
Key Observations
Bearish Momentum Across Timeframes: Both daily and intraday charts show strong bearish trends validated by supply zones and volume spikes.
Critical Levels Identified:
Resistance: 24,200 - 24,400 (Supply Zone).
Support: 23,950 (Intraday) and 23,700 - 23,500 (Swing Levels).
Volume Profile: Volume spikes on breakdowns confirm institutional involvement.
Trade Plan: Intraday
Scenario 1: Sell Below 23,950
Entry: Below 23,950 (confirmed breakdown).
Stop Loss: Above 24,050.
Target 1: 23,900.
Target 2: 23,850.
Rationale: Break below 23,950 signals bearish continuation with strong seller dominance.
Scenario 2: Buy Above 24,050
Entry: Above 24,050.
Stop Loss: Below 23,950.
Target 1: 24,100.
Target 2: 24,150.
Rationale: Reclaiming 24,050 indicates a potential bullish reversal.
Confidence Level: Moderate (requires strong buying volume).
SWING TRADING
Scenario 1: Swing Sell Below 23,900
Entry: Below 23,900.
Stop Loss: Above 24,150.
Target 1: 23,700.
Target 2: 23,500.
Rationale: A breakdown below 23,900 aligns with the long-term bearish structure and supply rejection.
Scenario 2: Swing Buy Above 24,200
Entry: Above 24,200.
Stop Loss: Below 24,000.
Target 1: 24,400.
Target 2: 24,600.
Rationale: Clearing the supply zone at 24,200 would confirm a trend reversal.
Confidence Level: Moderate.
Advanced Concepts Used
Smart Money Concepts (SMC):
Supply Zone: 24,200 - 24,400.
Demand Zone: 23,700 - 23,500.
Liquidity Trap: Below 23,950.
Volume Confirmation:
Selling volume spikes during breakdowns confirm bearish moves.
Low-volume retracements suggest weak buying interest.
Indicators:
RSI: Below 50 on daily charts, supporting bearish momentum.
MACD: Bearish crossover on daily charts aligns with the trend.
Moving Averages: Price below the 20 EMA and 50 EMA reinforces bearish bias.
Why This Trade Setup Stands Out
This analysis combines the best of price action, volume confirmation, and advanced SMC tools. Each level and decision is backed by data and market behavior, ensuring a methodical approach to trading.
Disclaimer
The views and trade ideas shared in this post are for informational and educational purposes only. They are not financial advice and should not be construed as a recommendation to buy, sell, or hold any securities or financial instruments. Trading involves significant risk, and you should carefully consider your financial situation, objectives, and risk tolerance before making any trading decisions.

Riding the Correction: Unlocking NIFTY’s Next Chapter!Dear Traders,
I hope this message finds you well in your trading endeavors and personal pursuits. I am excited to share a compelling opportunity with you through a new NIFTY analysis that sheds light on the continuation of the market shift. The recent upward movement & the following correction in the market have unfolded as anticipated. Over the past two months, my analysis has consistently pointed to an expected correction due to market overvaluation and distinct completion patterns.
Technical Analysis Overview:
There are three potential scenarios for the ongoing trend, ranked based on their likelihood of occurring.
Scenario I:
The move initiated from 20 MAR’23 – 27 SEPT’24 (16,828.35 – 26277.35) has spanned over 80 weeks (18M) and indicates a significant completion of wave patterns, suggesting an imminent correction. See the visual representation of the trend lines and corresponding fib retracement levels here:
The correlation between static supports can be observed around 23,893.70 and 21,181.45. This correction is expected to be visible within a 3-month timeframe.
Potential support levels include
S – I: 24,893 ~ 24,753 ~ 24,430 levels,
S – II: 24,050 ~24,000 levels and
S – III: 23,683 levels.
*These values are not actual but just levels
The correction might extend to deeper levels (22,664 & 21,550) as the market progresses.
Time resistances are anticipated on 09th OCT, 17th OCT, and 30th OCT for all probable scenarios.
---------------
Scenario II:
The move from 26 OCT’23 – 27 SEPT’24 (18,837.85 – 26,277.35) has completed mid-way and is expected to continue after this correction, potentially reaching unprecedented levels. Find the visual representation of this move with trend lines & fib retracements here:
The range of this move is limited to the monthly timeframe, indicating the completion of 1 year from the start of this sub-trend.
Potential support levels include,
S – I: 24,525 ~ 24,378 levels,
S – II: 23,900 ~ 23,893.70 levels and
S – III: 23,450 levels.
---------------
Scenario III:
The move from 04 JUN’24 – 27 SEPT’24 (21,121.45 – 26,277.35) has almost completed its half journey and is facing a correction before extending its uptrend by a few more waves. While this scenario has the lowest probability compared to the others, it is essential to consider its potential impact on the current trend.
The pictorial representation can be seen here:
Further details are not added as the market actions till now does not validate this probability.
---------------
Other Influential Factors:
Geo-political tensions and concerns regarding escalation have historically preceded corrections prior to the US presidential elections, indicating a prevailing bearish sentiment. Tensions in the Middle East have also contributed to the market plunge, albeit not solely responsible for it. Additionally, the FED's likely rate cuts have been influenced by the upcoming US elections, and SEBI's regulatory actions aim to curb over-optimism and maintain market neutrality.
Important Dates to Remember:
Mark your calendars for OCT 9th (RBI interest rate decision @ 10AM) and OCT 10th (US inflation reports).
---------------
Final Verdict:
While the scenarios are meticulously laid out, the selection of the valid scenario remains a work in progress. We are eagerly awaiting further cues from the market and will provide updates as they unfold. However, one thing remains certain – the current trend has reversed (at least for the mentioned time frames). Therefore, adopting a bearish stance could prove to be profitable.
---------------
Strategy:
Considering the current market conditions, adopting a bearish stance seems prudent, especially levels around 24,450 ~ 24,000 are to be tested. Keep a close watch on the market and stay informed for potential opportunities.
Disclaimer:
Before concluding, I must underscore that the insights shared are based on my analysis. It is imperative for you to conduct your research and, if necessary, consult with a financial advisor before making any trading decisions. The dynamic nature of financial markets necessitates that your strategies align with your financial goals and risk tolerance.
Fellow Traders,
Countless hours of dedication and effort have gone into creating this valuable analytical resource. If you find it useful, I humbly ask for your support by boosting the idea and following me (updates will be made via this post, new post & through minds) . Your comments and thoughts on this idea are highly valued, and I am committed to engaging with each one personally.
Thank you for investing your time in reading this article,
Your readership is greatly appreciated.
Wishing you profitable and joyful trading!!!
