Nifty 8th November SetupNo trades taken in Nifty on 4th November as the market traded in a really narrow range for the time given for muhurat trading.
Nifty 8th November Levels:
Buy Above: 17950
Sell Below: 17900
Please LIKE, COMMENT and SHARE to motivate and support me. I'll keep on posting new ideas on Indices & Stocks.
Any comments and critiques will be appreciated even if it's of opposite view as a trader can also be right so many times.
Niftytrading

nifty50 intraday levelsImportant Levels for nifty intraday, UP TRAND.
PLEASE LIKE,SHARE AND FOLLOW.............................................


Nifty - Intraday Profit Booking PossibleNifty is in a Bullish trend and will create a new All-Time High very soon.
But looking at the chart it looks that an intraday profit booking will come to touch the blue line.
Longs be careful.

Important levels for Nifty & Banknifty for 11/05/21 (under 5min)Important levels and my reading of NSE:NIFTY and NSE:BANKNIFTY for tomorrow. Disclaimer: not SEBI registered. Please like/share/subscribe on YouTube if you found this helpful and follow on TradingView.

Important Nifty & Banknifty levels you MUST know! (Hinglish)Important levels and my reading of NSE:NIFTY and NSE:BANKNIFTY for tomorrow. Disclaimer: not SEBI registered. Please like/share/subscribe on YouTube if you found this helpful and follow on TradingView.

NIfty View for 7th April Disclaimer: We are not SEBI registered analysts.All information/calls posted here are for educational purpose only.

NIFTY ANALYSIS 09/11/2020NIFTY MOMENTUM MAY CONTINUE, AVOID SELLING AT HIGHER LEVELS TILL WE GET SOME SIGN OF WEAKNESS. DON'T TRY TO PREDICT THE TOP'S, REMEMBER WE ARE NOT IN A HURRY

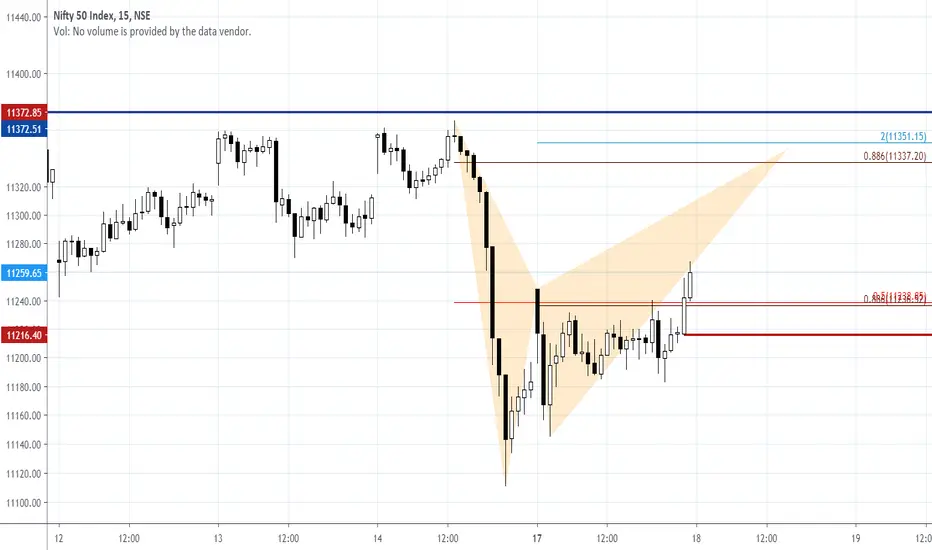
NIFTY - Intraday Trading #Nifty - Holding 11200, it has a probability of bat pattern on 15 min chart.
TRADERSAI - A.I.POWERED NIFTY50 TRADING PLANS for MON 08/03 Hey all,
Our debut message below (published on Thursday, 07/30) explains the notation and how to interpret the trading plans we publish, and who we are in this space. This is the Trading Day-3 of our limited test-launch for the Indian stock market NIFTY 50 Index. Appreciate your feedback and comments.
Good luck with your trading today and have a great week ahead!
***********************************************************
Hey everyone!
After two years of unprecedented growth and consistent performance in the US with daily trading plans on the S&P 500 Index , we are now testing our models on the Indian stock markets with the NIFTY 50 Futures . This is our debut for you all who have been waiting for it!
While we know this would enthrall many readers that have been asking for it, we are cautious about jumping on these trades right away - give these models a few days, see how they perform, and then begin to adapt them to your own trading style and risk appetite. And, please do share your feedback, thoughts, ideas, and suggestions about anything glaring or missing - we are new to the Indian markets and are still trying to learn its idiosyncrasies. Thank you!
Legend:
(i) Use these line crosses on your choice of time frame chart.
Most aggressive - on a 1-minute chart
Moderate - 5 to 15 minute chart
Intraday swing - 30 minute chart
Note that the lower your time frame, the more choppiness and whipsawing you might experience in your results.
(ii) Cross Above (Below) - triggered when the previous close was below (above) the line and the current close is above (below). Aggressive traders may use other criteria such as high crossing the line, close crossing the line without regard to the previous close, etc.
Solid Green Line: Models would go long on a cross above this line
Dotted Green Line: Models would close out a short (buy to close an open short but NOT go long). You can use Close-to-Close basis OR Open-to-Close basis OR Low-to-High, depending on your trading style.
Solid Red Line: Models would go short on a cross below this line
Dotted Red Line: Models would close out a long (sell to close an open buy but NOT go short). You can use Close-to-Close basis OR Open-to-Close basis OR High-to-High, depending on your trading style.
This is NOT an investment advice. This is meant for experienced traders to use as another tool to inform and guide their own trading decisions.

NIFTY - Stucked in 300 points rangeNIFTY is trading in a 300 points range from past 3 trading sessions.
Range : 10030 - 9730

NIFTY IT - HH/HL - catch the momemntum NIFTY IT - we can clearly see Higher Highs and Higher Lows on daily basis from past week .
Keep an Eye on INFY / WIPRO/TECHM/NIITTech/TCH / HCL Tech
Spend few minutes looking at past week charts of these stocks

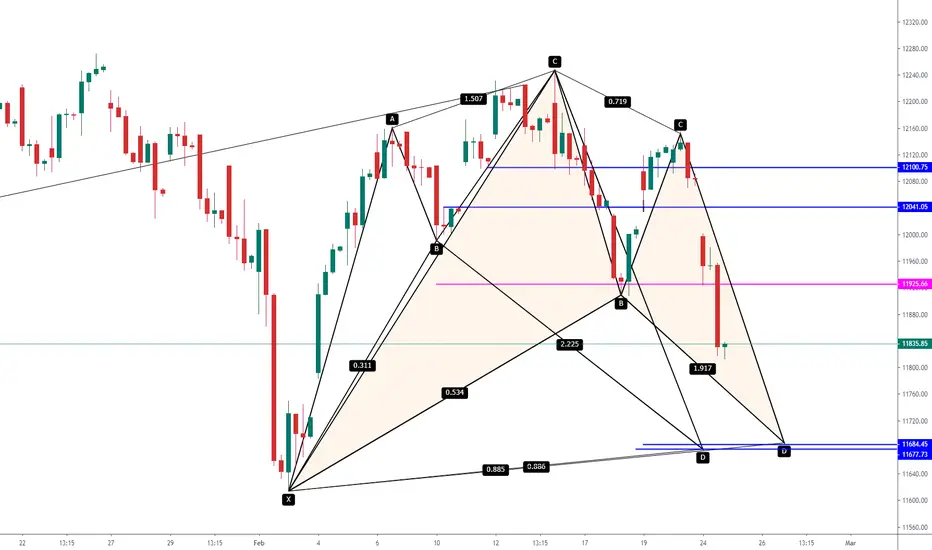
Nifty Intraday Trade Setup for 25th February 2020Hello all ,
corona virus Threat is being worst day by day and it's affecting wold economy. Intraday Trades must be alert in the buy side . Our Harmonic PRZ is on 11684 so index has lot of space in down side . There is 2 sell range
1- 11800
2- If Index shows any up move at first half and reach 11900-11925 then sell from top