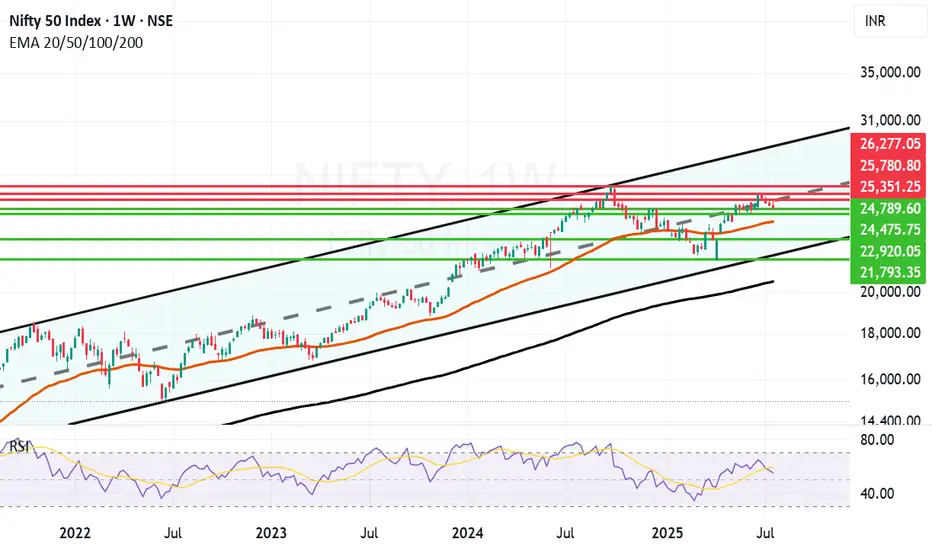
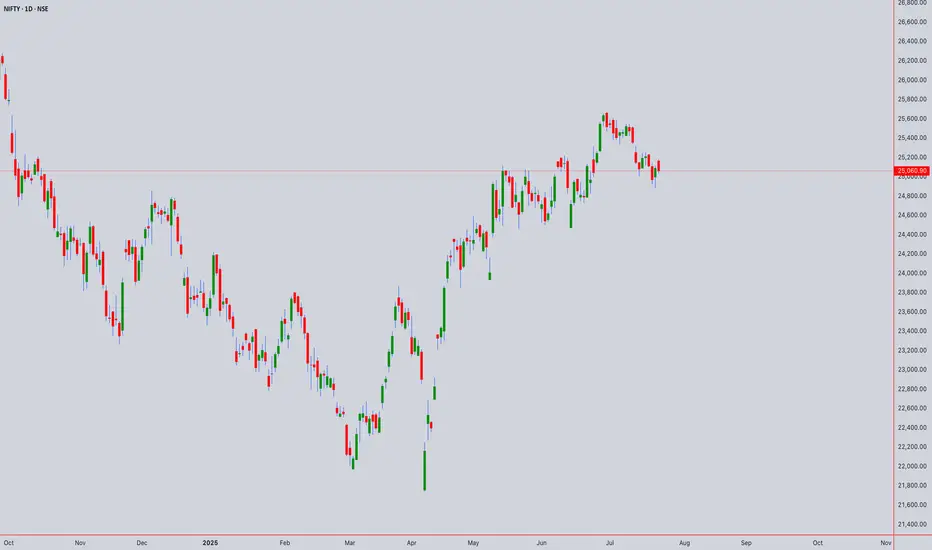
Long term Nifty Outlook Still upbeat. Long term outlook of Nifty is still upbeat. As you can see in the parallel channel in the weekly chart of Nifty. As you can see in the weekly chart Nifty attempted to break free above the Mid-Channel resistance went above it briefly but due to various geopolitical, Tariff and earning related concerns has not yet been successful. In a few years time the channel top can be around 30K and channel bottom seems to be around 21K. Supports for Nifty currently are near 24789, 24475, 23969 (Mother Line support of Weekly chart), 22920 and 21793 (Channel Bottom.) Below that 200 Weeks EMA ot the Father line is at 20577. Resistances for Nifty with long term perspective remain at 25351, 25780 and previous All time high of 26277. Once we get a weekly or monthly closing above 26277 the doors towards 27K+ will open.
Disclaimer: The above information is provided for educational purpose, analysis and paper trading only. Please don't treat this as a buy or sell recommendation for the stock or index. The Techno-Funda analysis is based on data that is more than 3 months old. Supports and Resistances are determined by historic past peaks and Valley in the chart. Many other indicators and patterns like EMA, RSI, MACD, Volumes, Fibonacci, parallel channel etc. use historic data which is 3 months or older cyclical points. There is no guarantee they will work in future as markets are highly volatile and swings in prices are also due to macro and micro factors based on actions taken by the company as well as region and global events. Equity investment is subject to risks. I or my clients or family members might have positions in the stocks that we mention in our educational posts. We will not be responsible for any Profit or loss that may occur due to any financial decision taken based on any data provided in this message. Do consult your investment advisor before taking any financial decisions. Stop losses should be an important part of any investment in equity.
Niftytrend
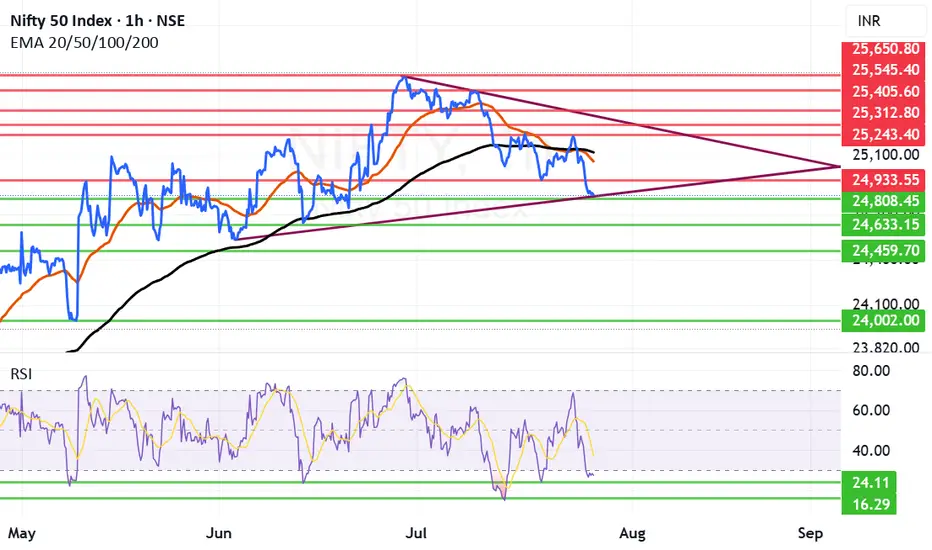
Nifty Next Week: Can Nifty make a comeback after drubbing?Nifty received proper drubbing after falling below critical supports of Mother and Father line. Trump's warning signals for IT companies and the continuing deadlock in Trade deal with US weighing on Indian markets. Additionally the earning season also giving many disappointing and few good result has broken the back of the Bull rally and now Nifty is reeling under 25K levels.
Only silver line in the cloud seems to be that RSI is below 30. Currently RSI is at 27.52. Usually RSI has found support near 24 if not 24 it might bounce back from 16. So hopefully we can see some short covering in the beginning or middle of next week. Also next week the decision for Tariffs should come. If the result will be in favour of India we might see a strong come back as lot of sectors / Large cap stocks currently are looking oversold.
The Supports for Nifty Remain at: 24808 (Strong support), 24633, 24459 Below 24459 the index will be in firm grip of Bears who might try to drag Nifty towards 24K levels or even below that in unlikely circumstances.
The Resistances for Nifty Remain at: 24933, 25058 (Mother Line Resistance of Daily Chart), 25119 (Father Line Resistance) and 25243. After we get a closing above 25243 the Bulls can gain some momentum.
Disclaimer: The above information is provided for educational purpose, analysis and paper trading only. Please don't treat this as a buy or sell recommendation for the stock or index. The Techno-Funda analysis is based on data that is more than 3 months old. Supports and Resistances are determined by historic past peaks and Valley in the chart. Many other indicators and patterns like EMA, RSI, MACD, Volumes, Fibonacci, parallel channel etc. use historic data which is 3 months or older cyclical points. There is no guarantee they will work in future as markets are highly volatile and swings in prices are also due to macro and micro factors based on actions taken by the company as well as region and global events. Equity investment is subject to risks. I or my clients or family members might have positions in the stocks that we mention in our educational posts. We will not be responsible for any Profit or loss that may occur due to any financial decision taken based on any data provided in this message. Do consult your investment advisor before taking any financial decisions. Stop losses should be an important part of any investment in equity.
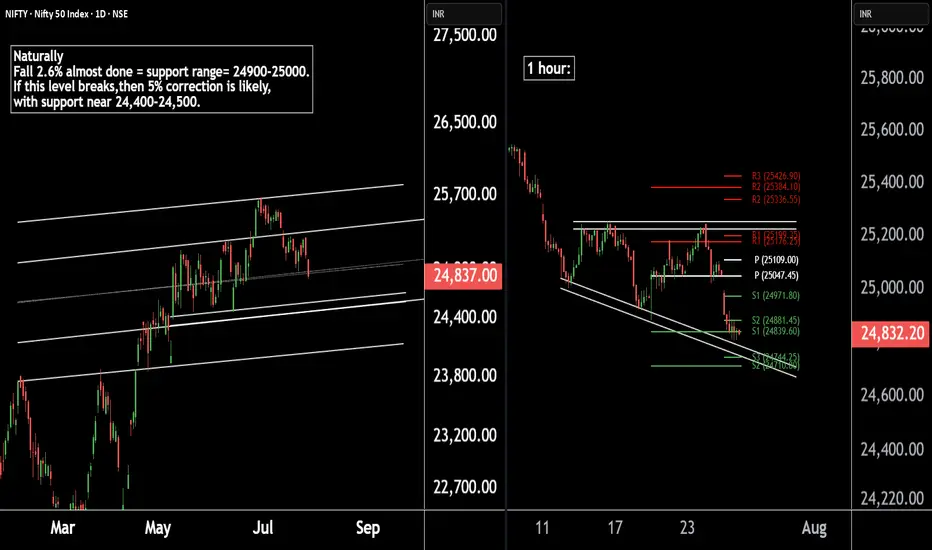
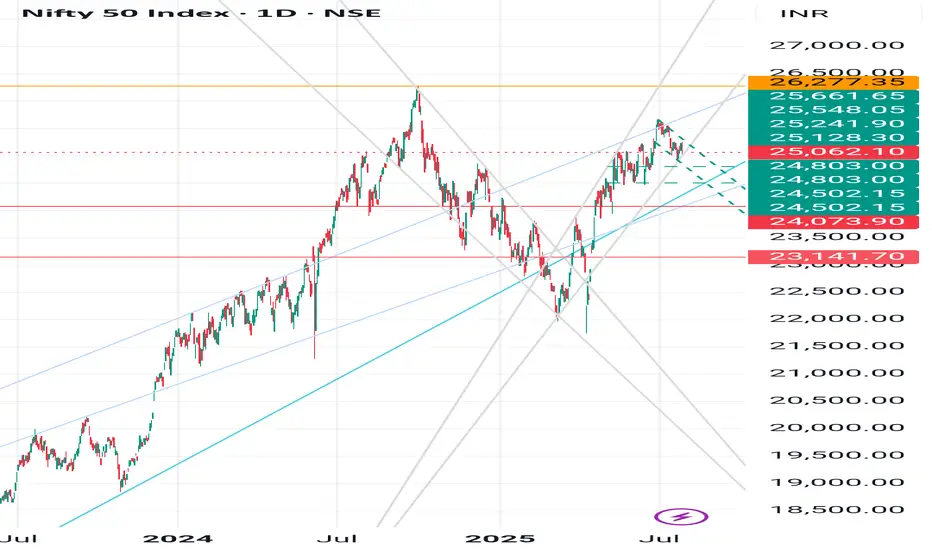
Nifty 50 Update | Technical Levels MappedThere are two chart of Nifty50.
Nifty 50 is trading within a well-defined parallel channel. As part of its natural corrective phase, a potential decline of around 5% cannot be ruled out, with key support anticipated near the 24,400–24,500 zone.
Nifty is forming a broadening wedge pattern on the 1-hour timeframe, with crucial support around 24,740. Additionally, both the weekly and monthly pivot supports are aligned in the 24,740–24,710 zone, reinforcing the significance of this level.
If this level sustain then we may see higher prices in Nifty50.
Thank You !!
Nifty Analysis EOD – July 25, 2025 – Friday🟢 Nifty Analysis EOD – July 25, 2025 – Friday 🔴
"When the tide goes out, you discover who’s been swimming naked." – Warren Buffett
Nifty GapDowns Below Key Support and Slips Further
The market opened with a sharp GapDown, breaching the previous day's low and instantly shedding 150 points within the first hour. Nifty attempted to find footing near the crucial 21st July low zone of 24,850–24,880, but the support gave way, slipping an additional 50 points.
The day mostly drifted around these lower levels with bearish dominance. Though bulls made an effort to recover late in the session, it lacked strength. The index finally settled at 24,837, decisively closing below the 21st July low — signalling a deeper structural breakdown.
📉 Trend & Zone Update
Resistance Zone Shifted To: 25,144 ~ 25,155
Support Zone Shifted To: 24,729 ~ 24,755
📊 What If Plans – 28th July Outlook
🅰️ Plan A (Contra Long Setup)
If market opens inside the previous day range and finds support at 24,815 ~ 24,850
Then potential targets are 24,920, 24,965, and 25,020
🅱️ Plan B (Trend is Friend – Short Continuation)
If market opens inside range and faces resistance around 24,965 ~ 24,995
Then aim for 24,850, 24,815, 24,780, and 24,730
⏸️ On-the-Go Plan
If market Gaps Up/Down outside previous day’s range
Then wait for the Initial Balance (IB) to form and act based on structure and S/R levels.
🕯 Daily Time Frame Chart with Intraday Levels
🕯 Daily Candle Breakdown
Open: 25,010.35
High: 25,010.35
Low: 24,806.35
Close: 24,837.00
Candle Structure
Body: Strong red candle (−173.35 pts)
Upper Wick: None (open = high)
Lower Wick: 30.65 pts
Interpretation:
A textbook bearish Marubozu — shows sellers had control throughout.
Bears stepped in immediately from open, preventing any bullish response.
Minimal lower wick implies limited buyer defense even at the session low.
Key Insight:
Bears are in command; bulls must reclaim 25,000+ quickly to prevent further downside.
If 24,800–24,820 breaks, eyes shift to 24,700–24,750 zone next.
🛡 5 Min Intraday Chart
⚔️ Gladiator Strategy Update
ATR: 192.95
IB Range: 87.4 → Medium
Market Structure: Imbalanced
Trades Triggered:
🕙 10:10 AM – Short Entry → 🎯 Target Hit (1:2.4 R:R)
🧭 Support & Resistance Levels
Resistance Zones
24,920
24,965
24,995 ~ 25,018
25,080
25,140 ~ 25,155
Support Zones
24,780
24,755 ~ 24,729
24,640
📌 Final Thoughts
When strong candles appear back-to-back with no meaningful recovery in between, it’s not just a correction — it’s a statement. In this market phase, reacting to price structure rather than assumptions will keep you on the right side. Stay nimble, stay prepared.
✏️ Disclaimer
This is just my personal viewpoint. Always consult your financial advisor before taking any action.

Nifty Chart📉 Nifty Technical Outlook – Bearish Bias with Macro Overhang
Nifty continues to show bearish momentum, having taken strong resistance near the 25450–25800 zone, which aligns with the runaway gap on the daily chart and the 78.6% Fibonacci retracement level from the recent decline.
On the short-term chart, a Head and Shoulder breakdown has already occurred, followed by a retest, which supports the ongoing weak sentiment.
In addition to technical factors, India–US trade talks are currently in focus. Uncertainty around tariffs, tech cooperation, and strategic agreements may keep market participants cautious in the near term. Any negative development could add to downside pressure, while a breakthrough might limit losses.
🔻 Key Technical Levels:
Major Resistance: 25450–25800 (Runaway Gap + Fibo 78.6%)
Immediate Support: 24200 (short-term support zone)
Next Support: 23700 (historical support level)
As long as Nifty stays below 25450, the trend remains bearish, with potential downside toward 24150–24200 and further to 23700, depending on trade talk developments and market sentiment.
📝 Note: This analysis is intended only for study and educational purposes. Please consult a qualified advisor before making any investment decisions. Market behavior is subject to change based on news, global trends, and macroeconomic factors.

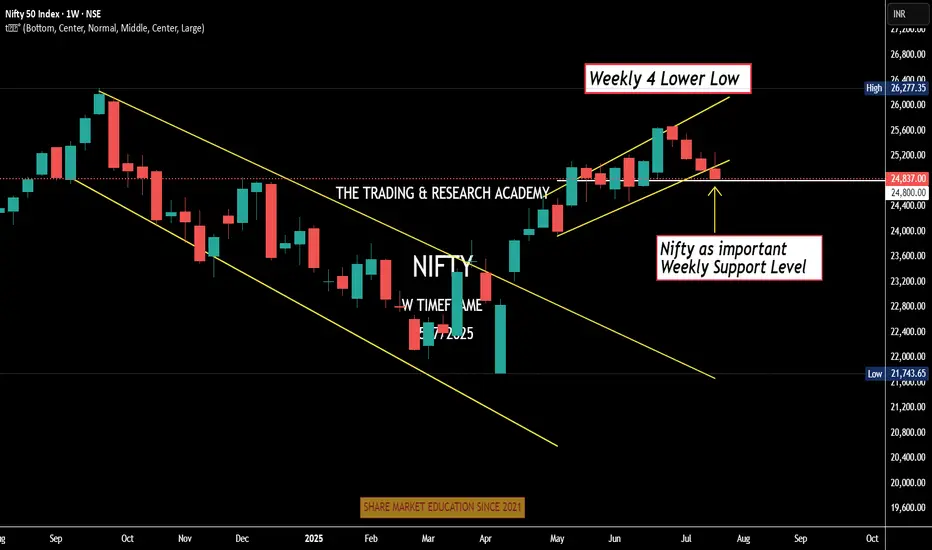
Weekly Nifty Analysis Next week, can we have a small bounce in #Nifty?
4 Lower Low
Daily channel Breakdown
Index at crucial weekly support level
Can one bullish week / Doji be expected. One news here or there & boom!
We have monthly expiry this week, let's see.
Reliance: 24837 - 1st target exact doneAs posted yesterday, 24836.65 this target is done today.
Now sideways move are expected for 1-2 sessions and 24545 is expected slowly.
Keep an eyes on this level.
As soon as this is done we can expect big upside moves with rapid action. 👍🚩

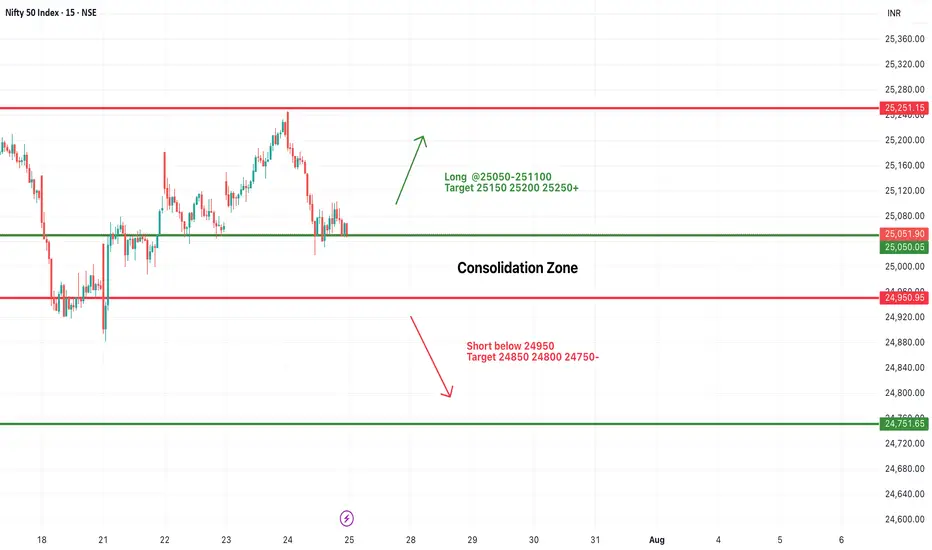
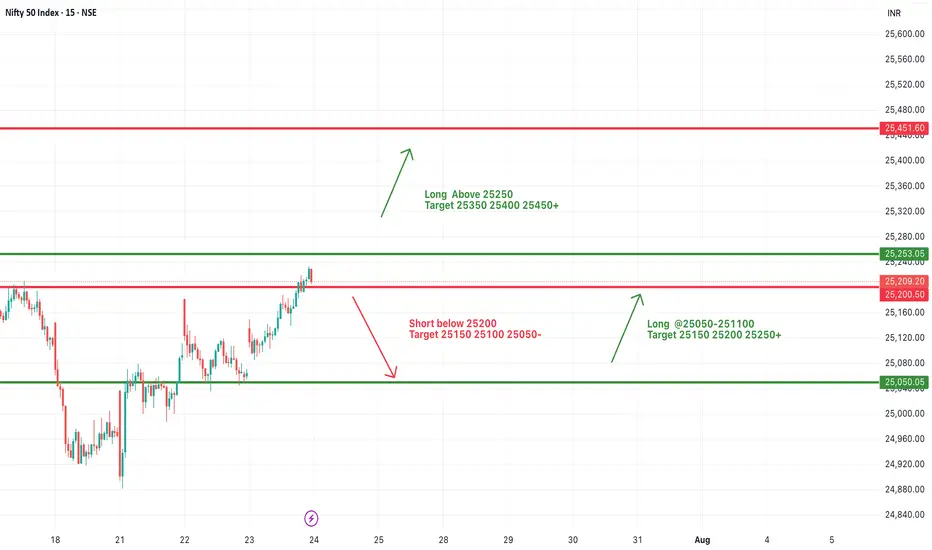
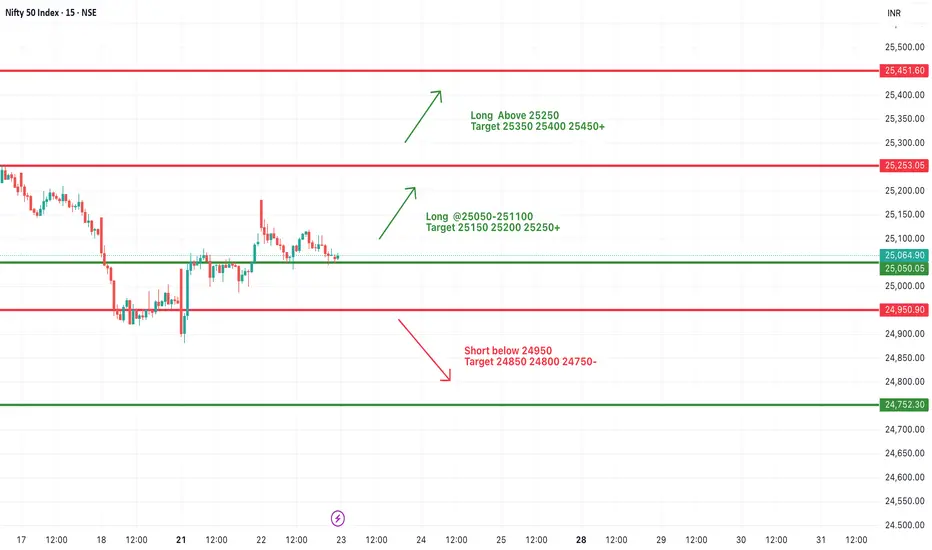
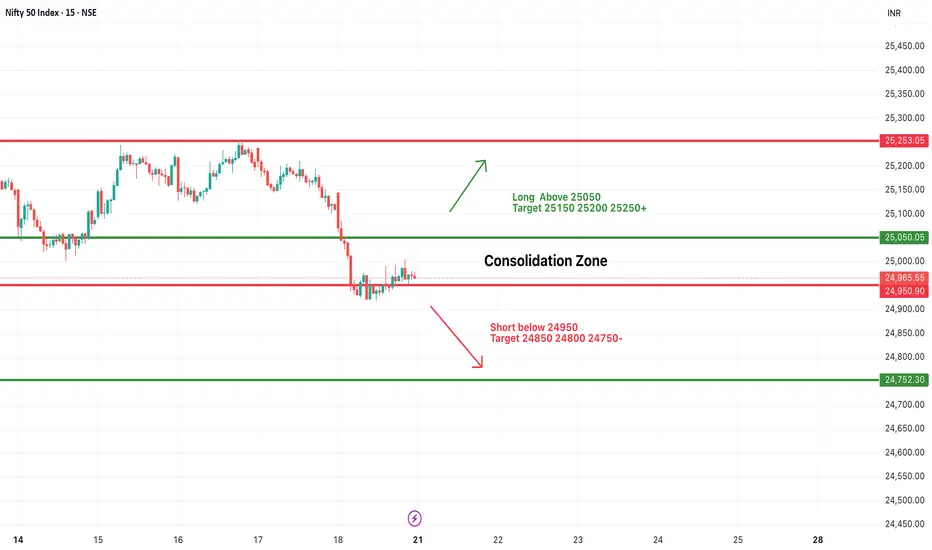
#NIFTY Intraday Support and Resistance Levels - 25/07/2025Nifty is expected to open with a slight gap-down and is currently trading within a tight consolidation zone between 24,950 and 25,050. This narrow 100-point range has acted as a critical zone over the past sessions, indicating indecision and low conviction among traders.
A sustained move above 25,050–25,100 may provide a long opportunity with potential upside targets of 25,150, 25,200, and 25,250+. Strong bullish momentum will only be confirmed if Nifty manages to close above 25,250, which may push the index further toward 25,350–25,400 in the coming days.
On the other hand, a breakdown below 24,950 will shift the bias toward bearishness. A short setup could then target 24,850, 24,800, and 24,750- levels.
Until then, expect sideways price action between 24,950 and 25,050. Traders should wait for a breakout or breakdown before entering fresh trades. Avoid aggressive entries inside this tight band.
Nifty : range bound and down trend Nifty is making a pattern and following a channel for finishing up the pattern. Important levels to watch next is : 24800 & 24500 as major support.
Post this we nay expect great rally towards upside 2600, 26700
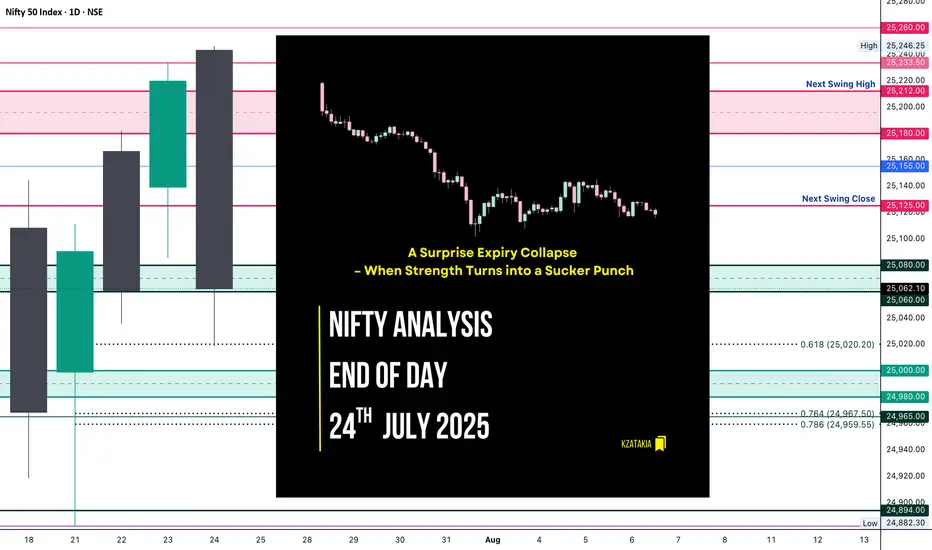
Nifty Analysis EOD – July 24, 2025 – Thursday 🟢 Nifty Analysis EOD – July 24, 2025 – Thursday 🔴
📉 A Surprise Expiry Collapse – When Strength Turns into a Sucker Punch
Today’s session was an unexpected twist.
Nifty opened above the previous day’s high, giving early hope to the bulls—but within the first hour, it slipped to 25,155 and formed its IB. What followed was a sharp 136-point fall, breaking not just yesterday’s low, but also the July 22nd low. This sudden bearish momentum was completely news-driven, and expiry-day long unwinding only added fuel to the fire.
Despite a strong close yesterday, today’s fall erased all of July 23rd’s gains and brought us right back to July 22nd’s close—neutralizing the recent upward effort.
The day closed at 25,062, marginally above key support. Technically, today’s low respected the 0.618 Fib retracement level drawn from July 21st’s low to July 23rd’s high—so a dead cat bounce is possible if no further bad news hits. But if we open below 25,050 tomorrow, expect more downside pressure toward 24,960–24,890 zones.
🕯 5 Min Time Frame Chart with Intraday Levels
🕯 Daily Time Frame Chart with Intraday Levels
🕯 Daily Candle Breakdown
Open: 25,243.30
High: 25,246.25
Low: 25,018.70
Close: 25,062.10
Change: −157.80 (−0.63%)
Candle Structure Analysis:
🔴 Body: Large red body (181.2 pts) shows strong intraday selling.
☁️ Upper Wick: Tiny (2.95 pts) → sellers dominated from the start.
🌊 Lower Wick: Moderate (43.4 pts) → small recovery near close.
Candle Type:
Almost a bearish Marubozu — clear domination by sellers with barely any upper shadow, signaling intense sell pressure.
Key Insight:
Bulls lost control after open.
Bears took charge below 25,155.
Close near support, but bias cautious.
Bulls must reclaim 25,150+ for recovery, else 25,000 may give way.
🛡 5 Min Intraday Chart
⚔️ Gladiator Strategy Update
ATR: 185.97
IB Range: 83.55 → Medium
Market Structure: Balanced
Trades Triggered:
⏰ 10:05 AM – Short Entry → SL Hit
⏰ 11:10 AM – Short Entry → Target Hit (1:3.6 Risk:Reward)
📊 Support & Resistance Levels
Resistance Zones:
25,125
25,155
25,180 ~ 25,212
25,233
Support Zones:
25,080 ~ 25,060
25,020
25,000 ~ 24,980
24,967 ~ 24,959
24,882
🔮 What’s Next?
A gap-up or stable open may trigger a dead cat bounce toward 25,150–25,180.
A gap-down below 25,050 confirms bearish continuation → next targets: 24,960 / 24,890.
Watch price action around the 25,020–25,060 zone closely.
🧠 Final Thoughts
“Markets are never wrong – opinions often are.”
— Jesse Livermore
Today was a reminder of how expiry day surprises and news flows can flip the narrative. Stay flexible, and keep a bias—but not a blind one.
✏️ Disclaimer
This is just my personal viewpoint. Always consult your financial advisor before taking any action.
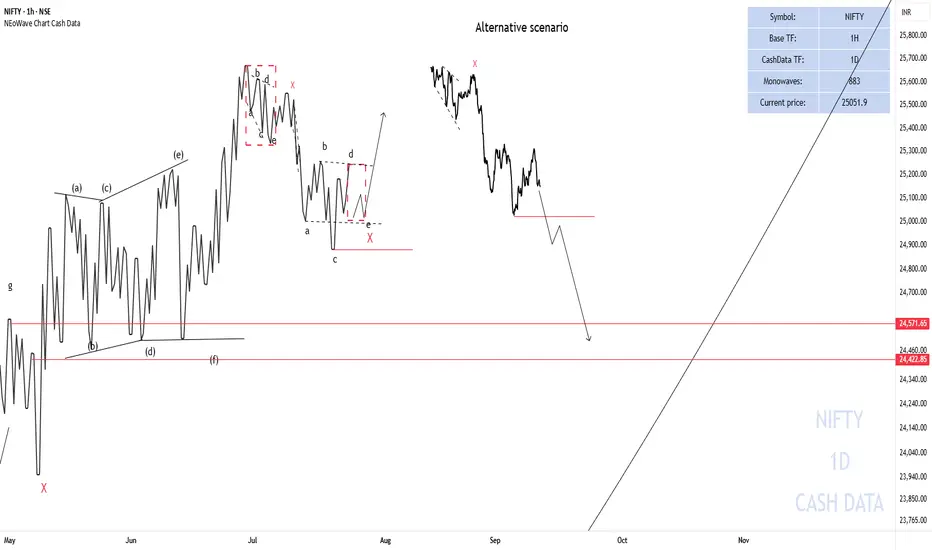
NIFTY50 Analysis ScenariosNIFTY briefly went below 25000 points but could not consolidate so a possible scenario is that X- wave is forming, triangle - X - triangle and then the upward movement starts.
Alternative scenario
If the end of wave-c of the reverse triangle breaks (red horizontal line), NIFTY could decline to the specified range.
Good luck
NEoWave Chart
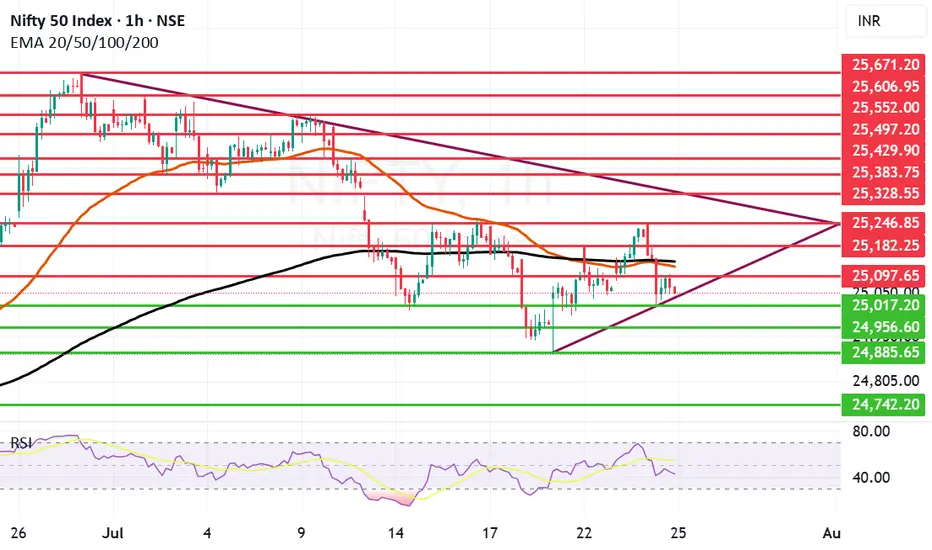
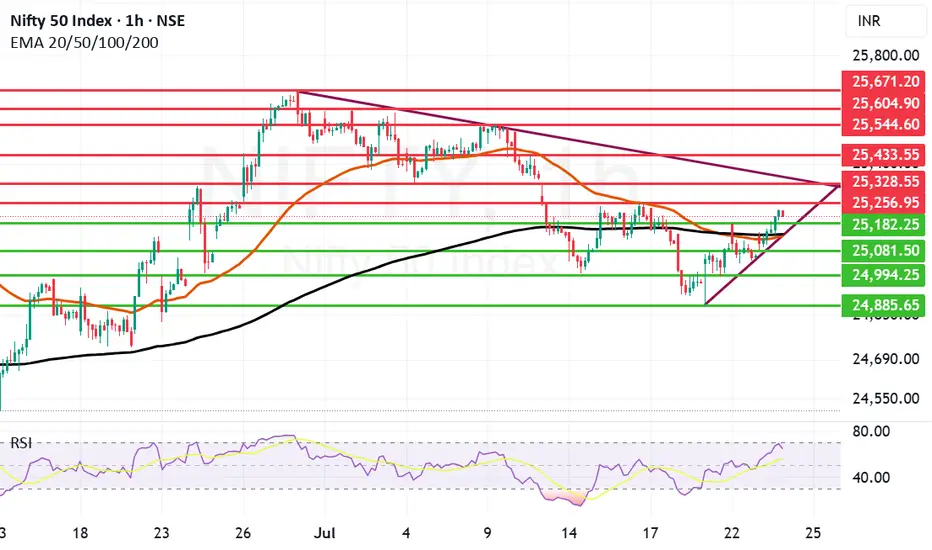
Nifty falls again as it can not sustain above 25240 level. Nifty again has shown some weakness as it was not able to sustain levels above 25240. The fall was lead by IT index which ended with deep cuts and fell 2.12% the other indices that saw fall were FMCG, Realty and Small Cap index. Trump's stance against Tech companies hiring from India and the deadlock in the trade deal also contributed to fall today. Index fell 157.8 points today and ended below both Mother and line on hourly chart. In the daily chart the candle we saw today was a bearish engulfing candle so further weakness can not be ruled out. The 2 major supports for nifty remain at 25017 and 24956 if these two supports are broken we may see Nifty falling towards 24885 or even 24742. Resistances for Nifty remain at 25097, 25138, 25182 and 25246. Only after we get a closing above 25246 we can see Nifty rally upwards.
Disclaimer: The above information is provided for educational purpose, analysis and paper trading only. Please don't treat this as a buy or sell recommendation for the stock or index. The Techno-Funda analysis is based on data that is more than 3 months old. Supports and Resistances are determined by historic past peaks and Valley in the chart. Many other indicators and patterns like EMA, RSI, MACD, Volumes, Fibonacci, parallel channel etc. use historic data which is 3 months or older cyclical points. There is no guarantee they will work in future as markets are highly volatile and swings in prices are also due to macro and micro factors based on actions taken by the company as well as region and global events. Equity investment is subject to risks. I or my clients or family members might have positions in the stocks that we mention in our educational posts. We will not be responsible for any Profit or loss that may occur due to any financial decision taken based on any data provided in this message. Do consult your investment advisor before taking any financial decisions. Stop losses should be an important part of any investment in equity.
#NIFTY Intraday Support and Resistance Levels - 24/07/2025Nifty is expected to open with a bullish gap-up today, breaching the 25,250 resistance zone. This level has been acting as a consolidation ceiling in recent sessions, and today’s opening above it indicates strong buying momentum in the market.
If Nifty sustains above 25,250, we may witness a fresh upside rally towards the immediate targets of 25,350, 25,400, and 25,450+. A decisive breakout above this zone would mark the continuation of the upward trend and may attract aggressive long-side participation.
On the downside, if Nifty slips and sustains below 25,200–25,250, weakness could resume. A break below 25,200 may lead to a correction toward 25,150, 25,100, and possibly even 25,050-, which will now act as a crucial support zone.
Overall, today's session may remain bullish above 25,250 with momentum trades favored on the long side.
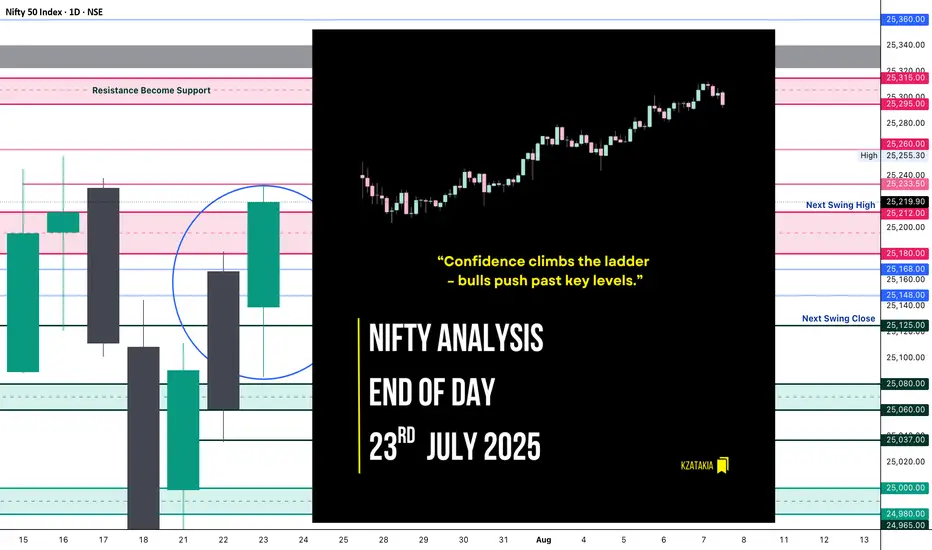
Nifty Analysis EOD – July 23, 2025 – Wednesday 🟢 Nifty Analysis EOD – July 23, 2025 – Wednesday 🔴
“Confidence climbs the ladder – bulls push past key levels.”
Nifty opened with a Gap Up of 78 points and initially retraced 54 points, finding solid footing around the CPR Zone. Once reclaimed VWAP, the index climbed in a methodical, low-volatility uptrend, breaking one resistance after another: CDH, R1, 25150, PDH, and the key zone 25200~25212 — finally touching the anticipated resistance at 25333, and closing just below that at 25219.90, close to the day’s high.
📌 Flashback from Yesterday's Note:
“If this is truly a retracement, 25K must hold in upcoming sessions, and bulls will need to reclaim 25,200 to regain their grip.”
👉 This expectation played out to perfection today — gradual yet confident bullish strength led Nifty to reclaim 25200 and close above it.
🔍 Today’s close of 25220 is higher than the last 7 sessions, suggesting a bullish shift in structure. However, bulls now face the real test — breaching the 25300 ~ 25350 resistance zone.
🕯 5 Min Time Frame Chart with Intraday Levels
🕯 Daily Time Frame Chart with Intraday Levels
🕯️ Daily Candle Breakdown
Open: 25,139.35
High: 25,233.50
Low: 25,085.50
Close: 25,219.90
Change: +159.00 (+0.63%)
Candle structure analysis:
Real body: Green body = 80.55 pts → strong bullish body
Upper wick: 13.60 pts → very small
Lower wick: 53.85 pts → moderate
Candle Interpretation:
The session opened stable, dipped to 25,085, but strong buyers showed up, helping price climb throughout the day and close near high. A firm green candle, signaling buyers in control.
Candle Type:
A Bullish Marubozu–like candle, not perfectly clean but represents strong continuation momentum.
Key Insight:
Close above 25200 confirms a bullish grip
If price holds above 25220–25250, next push could be towards 25280–25330
Immediate support now moves to 25,120–25,140
🛡 5 Min Intraday Chart
⚔️ Gladiator Strategy Update
ATR: 181.35
IB Range: 64.35 → Medium
Market Structure: Balanced
Trades Triggered:
⏱️ 10:45 AM – Long Entry → Trailing SL Hit (1:2.65 RR)
🔁 Support & Resistance Levels
Resistance Zones:
25,180 ~ 25,212
25,233
25,260
25,295 ~ 25,315
25,340 ~ 25,322 (Gap Zone)
Support Zones:
25,168
25,125
25,080 ~ 25,060
25,037
🧠 Final Thoughts
“Momentum is not magic—it’s built one level at a time.”
Bulls showed strength with control and consistency today. With 25200 reclaimed, they now hold the ball — next challenge lies at the gates of 25300–25350. Will they break through or pause for breath? Tomorrow holds the answer.
✏️ Disclaimer:
This is just my personal viewpoint. Always consult your financial advisor before taking any action.
Strong Comeback by Nifty few Resistances ahead.Nifty made a remarkable comeback today ending 159 points up closing at 25219. Infosys has posted better than expected result and as of now the Infosys ADR is up by 1.26%. So if there is a turnaround in the IT sector we can see Nifty fly upwards.
The next resistance ahead of Nifty is at 25256 if we get a closing above this the next will be at 25328. These 2 will be critical resistances to cross. Once we get a closing above 25328 Nifty can target 25433 and 25544. Above 25544 Nifty becomes very strong. In case Nifty is not able to cross 25256 or 25328 levels the supports for Nifty are at 25182. After this zone there is a dual support of Mother and Father line of Hourly chart at 25136 and 25142.
These are very strong supports. (Thus the zone between 25182 to 25136 is full of supports). We hope that these supports are held. In case we get a closing below 25136 Nifty will again fall into bearish territory and can plunge towards 25081, 24994 or even 24885.
The shadow of the candles right now is positive but 2 very important resistances mentioned earlier are yet to crossed so game is in balance but only slightly in favour of Bulls.
Disclaimer: The above information is provided for educational purpose, analysis and paper trading only. Please don't treat this as a buy or sell recommendation for the stock or index. The Techno-Funda analysis is based on data that is more than 3 months old. Supports and Resistances are determined by historic past peaks and Valley in the chart. Many other indicators and patterns like EMA, RSI, MACD, Volumes, Fibonacci, parallel channel etc. use historic data which is 3 months or older cyclical points. There is no guarantee they will work in future as markets are highly volatile and swings in prices are also due to macro and micro factors based on actions taken by the company as well as region and global events. Equity investment is subject to risks. I or my clients or family members might have positions in the stocks that we mention in our educational posts. We will not be responsible for any Profit or loss that may occur due to any financial decision taken based on any data provided in this message. Do consult your investment advisor before taking any financial decisions. Stop losses should be an important part of any investment in equity.
Comprehensive Technical Analysis: NIFTY50 ₹25060.90 as of 22/07Long-Term (Monthly/Weekly) - SWING PERSPECTIVE
Trend & Structure:
Elliott Wave:
Primary Trend: Bullish (Wave 3 or 5 ongoing since 2023).
Current Phase: Likely final sub-wave (Wave 5) targeting ₹25,800–26,200.
Risk: Completion of Wave 5 may trigger a 10–15% correction (ABC pattern) toward ₹22,500–23,000 (38.2% Fib retracement).
Wyckoff & Volume:
Accumulation/Distribution: Monthly volume declining near highs → early distribution signals.
Key Level: Close below ₹24,800 confirms distribution phase (bearish reversal).
Gann Analysis (Price-Time Squaring):
Square of 9:
Key Resistance: ₹25,317 (√25,060 ≈ 158.3; 158.5² = 25,132 → 159² = 25,281).
Major Support: ₹24,649 (157.5²), ₹24,000 (psychological + Gann 45° angle).
Time Cycle:
Aug-Sep 2025 critical for reversal (90-day cycle from April 2025 high).
Ichimoku (Weekly):
Kumo Cloud: Price above cloud → bullish bias.
Lagging Span (Chikou): Above price (26 weeks back) → no congestion.
Warning: Tenkan (9) below Kijun (26) on weekly → momentum loss.
Moving Averages (Weekly):
Bullish Stacking: EMA(20) > EMA(50) > SMA(100) → trend intact.
Support: EMA(20) at ₹24,200
Medium-Term (Daily/4H) - SWING ENTRY
Candlestick Patterns:
Daily: Doji/Spinning Top near ₹25,060 → indecision.
4H: Bearish Shooting Star → resistance at ₹25,150–25,200.
Harmonic Patterns:
Bullish Bat potential (PRZ: ₹24,600–24,750).
Bearish Crab if price rejects ₹25,300 (PRZ: ₹25,280–25,350).
Gann Angles:
1x1 Angle Support (from June 2025 low): ₹24,900 (break → accelerates selling).
Price-Time Squaring:
24th July = 180° from Jan 2025 low → watch for volatility.
RSI + Bollinger Bands (Daily):
RSI(14): 68 (neutral-bearish divergence → weakening momentum).
BB(20,2): Price near upper band (₹25,200) → overbought.
VWAP (4H): Price above VWAP → intraday bullish, but divergence at highs.
Intraday (1H/30M/15M/5M)
Ichimoku (1H):
Tenkan (9) > Kijun (26): Bullish.
Kumo Twist: Support at ₹24,950 (cloud top).
Sell Signal: If price breaks below Kijun (₹25,010).
Moving Averages (30M):
EMA(20): ₹25,040 (intraday support).
Death Cross: EMA(20) < SMA(50) on 15M → short-term bearish.
RSI + BB (15M):
RSI(14): 72 → overbought.
BB Squeeze: Bands narrowing → expect breakout (bearish bias below VWAP).
Gann Intraday Levels (5M):
Resistance: ₹25,100 (1x1 angle), ₹25,180 (2x1).
Support: ₹24,980 (1x1 downside), ₹24,920 (2x1).
Synthesis & Trading Plan
Bullish Scenario (Swing):
Trigger: Hold above ₹24,900 (Gann 1x1) + RSI > 60 on weekly.
Target: ₹25,800–26,200 (Wave 5, Gann Square 159²).
Stop Loss: ₹24,650 (Harmonic Bat PRZ).
Bearish Reversal (Intraday/Swing):
Trigger: Close below ₹24,950 (Ichimoku cloud) + RSI < 50.
Target: ₹24,600 (Harmonic Bat), ₹24,000 (monthly SMA).
Stop Loss: ₹25,200 (Bollinger upper band).
Intraday Levels (23rd July):
Resistance Support
₹25,100 (1H VWAP) ₹25,000 (psych)
₹25,180 (Gann 2x1) ₹24,950 (Ichimoku)
₹25,280 (Sq9) ₹24,800 (daily pivot)
Key Risk Factors
Gann Time Cycle: 24–28 July = high volatility (price-time square).
Elliott Terminal Wave: Wave 5 exhaustion → strict stop losses.
VWAP Divergence: Failure to hold above VWAP on 4H → short.
Instrument: NIFTY50
Strategy:
Swing: Wait for daily close above ₹25,150 (confirms bullish) or below ₹24,800 (bearish).
Intraday: Sell rallies to ₹25,100–25,150 (RSI>70, BB squeeze) for ₹24,950.
Verified Tools:
Gann Square of 9 + Ichimoku for precision entries.
RSI/BB for overbought/oversold filters.
For those interested in further developing their trading skills based on these types of analyses, consider exploring the mentoring program offered by Shunya Trade.(world wide web shunya trade)
I welcome your feedback on this analysis, as it will inform and enhance my future work.
Regards,
Shunya Trade
world wide web shunya trade
⚠️ Disclaimer: This post is educational content and does not constitute investment advice, financial advice, or trading recommendations. The views expressed here are based on technical analysis and are shared solely for informational purposes. The stock market is subject to risks, including capital loss, and readers should exercise due diligence before investing. We do not take responsibility for decisions made based on this content. Consult a certified financial advisor for personalized guidance.
#NIFTY Intraday Support and Resistance Levels - 23/07/2025Nifty is expected to open with a gap-up today, continuing its sideways movement within a tight range. There are no significant changes in key levels from the previous session, indicating a consolidative phase in the market. Price action near these levels will be crucial for intraday direction.
On the upside, a bullish continuation can be expected if Nifty sustains above 25,050–25,100. This zone has been acting as a breakout point, and a sustained move above can lead to an intraday rally toward 25,150, 25,200, and 25,250+. Further strength will be confirmed if Nifty crosses 25,250, opening the possibility to test 25,350, 25,400, and even 25,450+ levels.
On the downside, if Nifty breaks below 24,950, it may trigger a short setup with potential downside targets of 24,850, 24,800, and 24,750-. This breakdown would indicate weakness, especially if it comes with volume.
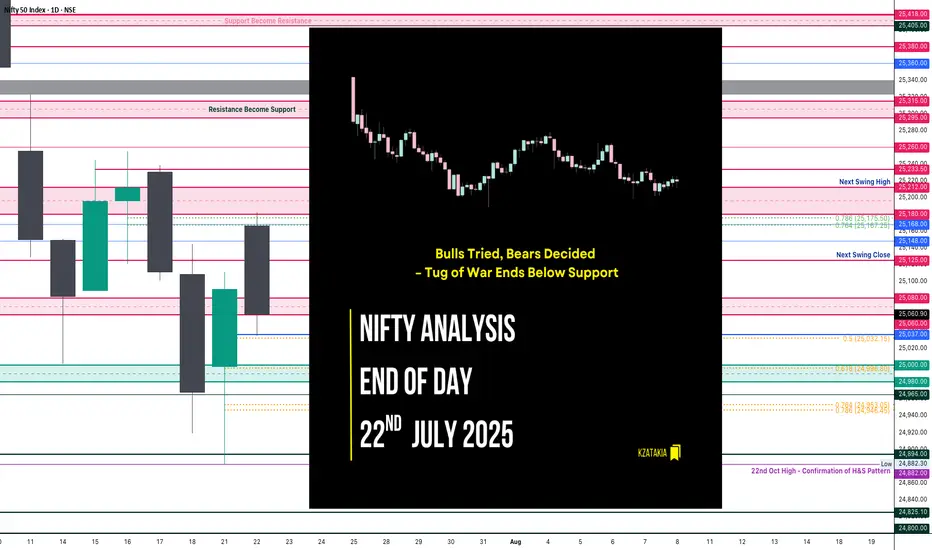
Nifty Analysis EOD – July 22, 2025 – Tuesday🟢 Nifty Analysis EOD – July 22, 2025 – Tuesday 🔴
"Bulls Tried, Bears Decided – Tug of War Ends Below Support"
Nifty opened with an 88-point gap-up, continuing the bullish sentiment, right at the resistance zone of 25,180 ~ 25,212. However, the market opened at the high (OH) and quickly slipped around 100 points to form the Initial Balance (IB). After a brief bounce back to the mean, it faced resistance, leading to a breakdown of IB and further losses of 77 points.
A supportive bounce emerged near 25,060 ~ 25,080, but the price was pushed down again by PDH + VWAP + R1. The day closed below PDC and under the support zone at 25,065, showing bearish dominance despite a volatile tug-of-war between bulls and bears.
Today’s low tested the 0.5 Fibonacci retracement level (from yesterday’s low to today’s high). If this is truly a retracement, 25K must hold in upcoming sessions, and bulls will need to reclaim 25,200 to regain their grip.
🕯 5 Min Time Frame Chart with Intraday Levels
🕯 Daily Time Frame Chart with Intraday Levels
📊 Daily Candle Breakdown
Open: 25,166.65
High: 25,182.00
Low: 25,035.55
Close: 25,060.90
Change: −29.80 (−0.12%)
Candle Structure:
Real Body: Red (−105.75 pts) → Decent bearish body
Upper Wick: 15.35 pts → Small
Lower Wick: 25.35 pts → Moderate
Interpretation:
Price opened strong but faced selling near 25,180, leading to a steady drop throughout the session. The lower wick shows some buying attempt near 25,035, but the close below open signals bears dominated.
Candle Type:
Bearish candle with moderate lower wick – resembles a Bearish Engulfing setup after a green candle, suggesting profit-booking or fresh selling.
Key Insight:
Sellers defending 25,180–25,200 firmly
Holding above 25,030–25,050 is critical; breaking this could retest 24,950–25,000
Bulls must reclaim 25,120–25,150 for momentum revival
🛡 5 Min Intraday Chart
⚔️ Gladiator Strategy Update
ATR: 182.32
IB Range: 92.6 → Medium
Market Structure: Balanced
Trades Triggered:
10:45 AM – Short Trade → Trailing SL Hit (1:0.8)
12:45 PM – Long Trade → SL Hit
📌 Support & Resistance Levels
Resistance:
25,080 ~ 25,060
25,125
25,168
25,180 ~ 25,212
Support:
25,037
25,000 ~ 24,980
24,965
24,894 ~ 24,882
24,825
24,800 ~ 24,768
🧠 Final Thoughts:
"Markets often dance between zones of power — where bulls flex and bears press. It's not chaos, it's the choreography of sentiment."
The 25,000–25,212 zone continues to be the battlefield. Let’s see who seizes the upper hand tomorrow.
✏️ Disclaimer:
This is just my personal viewpoint. Always consult your financial advisor before taking any action.
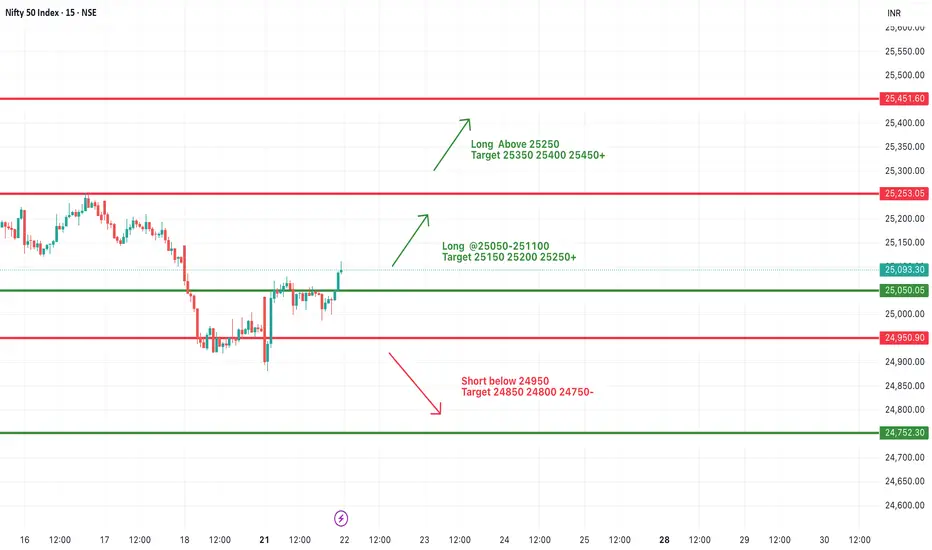
#NIFTY Intraday Support and Resistance Levels - 22/07/2025Today, Nifty is expected to open slightly gap-up, indicating positive early sentiment. After breaking out from the previous day’s consolidation zone, the index has shown strength around the 25,050 level, which will now act as an important intraday support. If this level is held during the early session, we can expect further upside continuation.
A move above the 25,050–25,100 zone can trigger upward momentum with potential targets at 25,150, 25,200, and 25,250+. Sustained strength above 25,250 will open the door for further bullish moves toward 25,350, 25,400, and 25,450+, making it a favorable long scenario for trending market conditions.
However, if the index fails to hold above the 25,050 level and starts trading back below 24,950, it may again enter a bearish territory. In such a case, downside targets of 24,850, 24,800, and 24,750- are possible, indicating weakness and reversal from resistance.
Nifty Analysis EOD – July 21, 2025 – Monday 🟢 Nifty Analysis EOD – July 21, 2025 – Monday 🔴
“Shock, Squeeze, and a Strong Close — Bulls Reclaim 25K”
Today’s move was nothing short of shocking. In the first 45 minutes, Nifty plunged more than 150 points, breaking through key levels and touching 24,882. But what followed was a V-shaped recovery that caught both Friday’s shorts and those who shorted below PDC/PDL completely off guard.
The index powered up to mark a day high of 25,080, and sustained above CPR and VWAP throughout most of the session. A final push came around 2:55 PM, breaking the intraday trendline and CDH, registering a fresh high before closing near the top at 25,090.70.
✅ Bulls not only held 25K — they dominated the battlefield all day, recovering almost everything lost during Friday’s drop.
🕯 5 Min Time Frame Chart with Intraday Levels
🕯 Daily Time Frame Chart with Intraday Levels
🕯 Daily Candle Breakdown
Open: 24,999.00
High: 25,111.40
Low: 24,882.30
Close: 25,090.70
Change: +122.30 (+0.49%)
📊 Candle Structure Breakdown
Real Body: 91.70 points → strong bullish body
Upper Wick: 20.70 points → slight hesitation near highs
Lower Wick: 116.70 points → deep intraday buying from the lows
🔍 Interpretation
Mildly negative open, followed by a sharp 150-point fall
Buyers stepped in strongly near 24,880, triggering a sharp reversal
V-shape recovery sustained above CPR & VWAP, closing near high
Close is not just above open — it’s above Friday’s close and 25K mark
🕯 Candle Type
Hammer-like Bullish Reversal Candle — Long lower wick with green body, signaling strong dip buying and possible short-term trend reversal
📌 Key Insight
Strong defense at 24,880–24,900 created the base for reversal
Close above 25,090 shifts near-term bias in favor of bulls
25,110–25,140 is the next resistance to watch
As long as we stay above 24,900, buyers hold the edge
🛡 5 Min Intraday Chart
⚔️ Gladiator Strategy Update
ATR: 186.31
IB Range: 166.8 → Wide IB
Market Structure: 🟡 Balanced
📉 Trades Triggered:
10:09 AM – Long Trade → ❌ SL Hit
📌 Support & Resistance Levels
Resistance Levels:
25,080 ~ 25,060
25,125
25,168
25,180 ~ 25,212
Support Levels:
25,037
25,000 ~ 24,980
24,965
24,894 ~ 24,882
24,825
24,800 ~ 24,768
💭 Final Thoughts
🧠 “Volatility doesn’t confuse the market — it reveals who’s in control.”Today’s V-shaped reversal erased all doubts from Friday’s fall. Buyers didn’t just defend — they counterattacked and reclaimed 25K with authority.Follow-through above 25,125 on Monday could confirm trend resumption.
✏️ Disclaimer
This is just my personal viewpoint. Always consult your financial advisor before taking any action.

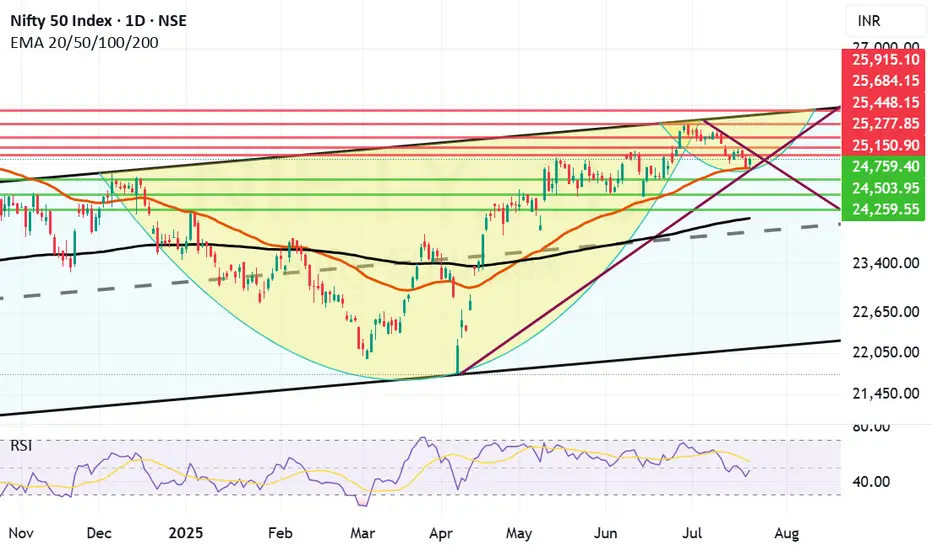
Nifty has taken support at Mother line as expected.Despite poor showing by Reliance post result and TCS continuing to fall Nifty staged a remarkable comeback on the back of Pvt Sector banking which did well. Bank Nifty came back strongly posting 1.19% gains today which enabled Nifty to rise 122 points or 0.49%. Capital Goods, Finance and Metals indices also gained more than 1% each.
Resistances for Nifty now remain at: 25150, 25277 (Trend line resistance), 25448, 25684 and finally channel top resistance at 25915.
Supports for Nifty remain at: 24938 (Mother Line Support of Daily Chart), 24759, 24503, 24259 and finally 24116 (Father Line support of Daily chart).
Shadow of the candle right now is neutral to positive and RSI is 47.63 with median RSI resistance at 54.09.
Disclaimer: The above information is provided for educational purpose, analysis and paper trading only. Please don't treat this as a buy or sell recommendation for the stock or index. The Techno-Funda analysis is based on data that is more than 3 months old. Supports and Resistances are determined by historic past peaks and Valley in the chart. Many other indicators and patterns like EMA, RSI, MACD, Volumes, Fibonacci, parallel channel etc. use historic data which is 3 months or older cyclical points. There is no guarantee they will work in future as markets are highly volatile and swings in prices are also due to macro and micro factors based on actions taken by the company as well as region and global events. Equity investment is subject to risks. I or my clients or family members might have positions in the stocks that we mention in our educational posts. We will not be responsible for any Profit or loss that may occur due to any financial decision taken based on any data provided in this message. Do consult your investment advisor before taking any financial decisions. Stop losses should be an important part of any investment in equity.
#NIFTY Intraday Support and Resistance Levels - 21/07/2025Nifty is likely to start the day with a flat opening, as current price action is indicating a consolidation phase near the lower range. The zone between 24,950–25,050 is acting as a key area of indecision, where prices are stuck in a tight range, showing a lack of clear momentum. This consolidation could lead to a breakout or breakdown depending on how the index reacts at key levels.
If Nifty sustains above 25,050, it may trigger a short-term upward move, breaking the consolidation phase. In such a scenario, an upside rally towards 25,150, 25,200, and 25,250+ levels can be expected, making it a favorable long setup for intraday traders.
On the contrary, if the index slips below 24,950, the selling pressure may increase, and downside momentum can accelerate. A breakdown here could pull the index towards support levels of 24,850, 24,800, and even 24,750-, which would confirm bearish strength.
Traders are advised to avoid aggressive positions within the consolidation zone and wait for a breakout or breakdown for directional trades. Quick entries with partial profit booking at every level and strict stop-losses are recommended to manage risk efficiently in today’s range-bound environment.
Wkly Market Wrap: Nifty Under Pressure, S&P 500 Hits Record HighThe Nifty 50 closed the week at 24,968, down 180 points from the previous week's close. It traded within a tight range, posting a high of 25,255 and a low of 24,918—perfectly aligning with the range I’ve been tracking between 25,600 and 24,700.
As I’ve been highlighting over the past few weeks, the monthly chart continues to show weakness, and now even the weekly chart is starting to reflect bearish signals. This growing weakness is a notable concern.
What to Watch for Next Week:
If Nifty sustains above 25,100, we could see a potential rebound toward the 25,400–25,450 resistance zone.
However, a breakdown below this week's low of 24,918 opens the door to a retest of key support near 24,500.
What’s interesting is that, despite Nifty’s indecision, the number of bullish stocks on the monthly time frame has increased significantly. Last week, there were 18 such stocks on my radar; now that number has jumped to 26, even after excluding about 10 others that showed bullish patterns but had high volatility.
This divergence—index showing weakness while quality stocks turn bullish—could indicate a possible bear trap being set by institutional players. If true, we might see a sharp short-covering rally after a final shakeout.
Nifty Outlook:
For the upcoming week, I expect Nifty to remain range-bound between 25,400 and 24,500. A decisive breakout or breakdown from this range could lead to sharp directional movement, so traders should stay alert.
Global Markets: S&P 500 Soars to New Highs
The S&P 500 closed at a record high of 6,296, with a weekly high of 6,315 and low of 6,201. The index remains in strong uptrend mode.
A breakout above 6,315 could see it testing 6,376, 6,454, and potentially 6,500 in the coming sessions.
My next major Fibonacci target is 6,568.
As long as 6,149 holds on a weekly closing basis, I continue to view every dip as a buying opportunity.
Final Thoughts:
The Indian markets are sending mixed signals, with the broader index showing caution while individual stock strength is quietly building. This divergence warrants a tactical approach—stay nimble, respect levels, and be ready for sharp reversals or breakouts.
Next week could be crucial. Stay focused, stay disciplined.
