ANANT RAJ CAN HIT 1000 MARK!Hey, back with an another weekend picks, i have pick Anant Raj this stock showing bullish momentum and it can gives you around 30 to 40% in couple of month add in your watchlist.
Niftytrend

Good Leap by Nifty today in anticipation of RIL/INFY results. Good Leap by Nifty today in anticipation of RIL/INFY results and closed 98 points up at 23311. Real test is the level of between 23377 (Mother Line) and 23398 (Important Resistance).
This includes today's high and Mother line resistance and another important resistance. After closing above this zone the next resistances will be at 23469, 23598, 23736 and finally 23770 (Father Line resistance of Hourly chart.)
Supports for Nifty on the lower side now remain at 23267, 23147 and 23053. If we get a poor result for Reliance these levels will be tested once again and there will be pressure on Bulls and Bears will again try to overpower Nifty. The tussle has reached a delicate stage now and thing can give. (Either a Breakout of Breakdown).
Disclaimer: The above information is provided for educational purpose, analysis and paper trading only. Please don't treat this as a buy or sell recommendation for the stock or index. We do not guarantee any success in highly volatile market or otherwise. Stock market investment is subject to market risks which include global and regional risks. I or my clients might have positions in the stocks that we mention in our posts. We will not be responsible for any Profit or loss that may occur due to any financial decision.

Short A significant Head and Shoulders (H&S) formation is forming, and if the neckline is breached, the target is 20,200, which also aligns with the 50% retracement of the rally. As I noted in my previous post, this seems like a more plausible target.

#NIFTY Intraday Support and Resistance Levels - 16/01/2025Gap up opening expected in nifty. Expected opening near 23400 level. 23350-23400 will act as a strong resistance for today's session. Strong upside rally only expected if nifty starts trading above 23400 level. This rally can goes upto 23600+ level in today's session. Downside expected below 23350 level. This downside can goes upto 23050 level.

23K has emerged as a good support zone for Nifty. As of now the 2 day's positive closing has given hopes of 23K levels being a good support zone. However there are 4 major hurdles in the path of Nifty before it can move ahead with full force. Reliance result tomorrow can be of some help to Nifty if at all it is positive. On the other hand if Reliance result is negative it can be a major hurdle looking at the weightage of the script in the index. US Inflation data to be announced later tonight can also give a direction to the markets all over. FII selling pressure can diminish if Dollar falls and Rupee starts making a steady gain. After making a high of 86.69 2 days back USD is currently at 86.34 declining a bit which has increased optimism in the mood of market. Market Mood index is at 33.25 and has recovered from Extreme fear zone and has entered the fear zone.
Supports for Nifty remain at: 23053, 22663 and 22376 levels. Below 22376 Bears can drag Nifty further down by another 400 to 1000 points.
Resistances for Nifty remain at: 23283, 23397 (Mother line resistance), 23598, 23803 (Father line resistance), 24198 and finally 24802 levels. Bulls can be back in the game truly after closing above 24802 level only.
Disclaimer: The above information is provided for educational purpose, analysis and paper trading only. Please don't treat this as a buy or sell recommendation for the stock or index. We do not guarantee any success in highly volatile market or otherwise. Stock market investment is subject to market risks which include global and regional risks. I or my clients might have positions in the stocks that we mention in our posts. We will not be responsible for any Profit or loss that may occur due to any financial decision

#NIFTY Intraday Support and Resistance Levels - 15/01/2025Gap up opening expected in nifty. After opening nifty will face resistance at 23350 level and expected reversal from this level towards the downside movement upto 23050 level. This downside can be extend for further strong sell side if nifty starts trading below 23000 level. Any major upside rally only expected if nifty gives the breakout and sustain above the 23400 level.

Nifty 50: Bearish Trend with Key Support LevelsOverview of the Chart:
The chart represents the daily candlestick pattern for the Nifty 50 index, combined with the following indicators and tools:
ZLMA (Zero Lag Moving Average) for 50 and 100 periods.
Fibonacci Retracement Levels drawn from the most recent high to low.
RSI (Relative Strength Index) to measure momentum and overbought/oversold conditions.
MACD (Moving Average Convergence Divergence) to analyze momentum and trend direction.
ZLMA (Zero Lag Moving Averages):
50 ZLMA (Black Line): This represents the short-term trend. The index is currently trading below this moving average, indicating bearish momentum in the short term.
100 ZLMA (Blue Line): This acts as a long-term trend indicator. The index is also below this level, signaling a weakening trend in the medium to long term.
The convergence of these two ZLMAs suggests a key resistance zone around the 24,000–24,150 range. Until the price breaks above these levels, the overall bias remains bearish.
Fibonacci Retracement Analysis:
The Fibonacci retracement levels are drawn between the recent swing high of 26,282.35 and swing low of 21,296.50. Key levels:
23.6% Retracement (25,105.70): This acted as resistance during earlier retracements and failed to hold.
38.2% Retracement (24,377.75): Another resistance level where the price struggled and has recently broken down.
50% Retracement (23,789.40): The index is now below this level, which may act as immediate resistance.
61.8% Retracement (23,201.10): The current level is hovering close to this support. If breached, the next target would be the 78.6% retracement (22,363.45).
The inability to reclaim higher Fibonacci levels reinforces the bearish trend.
RSI (Relative Strength Index):
Current RSI: 35.05, below the neutral level of 50.
The RSI is nearing the oversold region (below 30), which might indicate a potential bounce. However, this is not confirmed yet, as momentum remains weak.
Previous RSI divergence patterns do not suggest immediate reversal signals.
MACD (Moving Average Convergence Divergence):
MACD Line (-173.87) is well below the signal line (-235.40), confirming the bearish momentum.
The histogram bars remain negative, showing no signs of reversal yet.
The MACD's placement suggests that the bearish phase is intact and any uptrend might be corrective.
Volume Analysis:
The volume appears consistent but does not show any significant spikes. This suggests a lack of strong buyer interest at the current levels.
Declining volume during pullbacks indicates weak bullish attempts.
Current Levels to Watch:
Support Levels: 23,201.10 (61.8% Fibonacci) and 22,363.45 (78.6% Fibonacci).
Resistance Levels: 23,789.40 (50% Fibonacci), followed by 24,150 (near the ZLMA 50 and 100).
Conclusion:
The Nifty 50 index is in a bearish phase, trading below its key moving averages and important Fibonacci levels. The RSI and MACD confirm the negative sentiment. However, the proximity to the 61.8% Fibonacci retracement level and oversold RSI suggests that there might be a short-term bounce, especially if 23,201.10 holds as support. A failure to hold this level would open the doors for a deeper correction towards 22,363.45.
Traders should closely watch volume and price action near these support and resistance levels to further confirmation of trend direction.
Note:
Studies are for educational purposes only.
We will not be responsible for any of your Profits & Losses.
Please trade with a proper risk management strategy to avoid huge capital loss.

#NIFTY Intraday Support and Resistance Levels - 14/01/2025Today nifty will open gap up near the 23200 level. After opening it will face resistance at this level. Small upside rally expected if nifty starts trading above 23200 level this rally can goes upto 23350 level. Expected strong rejection from this level and further downside movement in nifty. After reversal confirmation from this level downside expected target will be upto 23050. Further strong fall in index expected below 23000 level.

NIFTY : Trading Levels and Plan for 14-Jan-2025Trading Plan for 14-Jan-2025
This structured plan outlines potential strategies for different opening scenarios. Follow it step by step to make informed decisions and manage risk effectively.
Scenario 1: Gap-Up Opening (100+ Points Above 23,091)
🟢 A gap-up opening often indicates strong bullish momentum, but it’s crucial to watch for resistance at key levels.
Key Levels: Focus on 23,239 (Immediate opening resistance) and 23,374 (Last intraday resistance).
Plan of Action:
If Nifty opens near 23,239 and shows signs of rejection, wait for a bearish confirmation candle. Enter a short trade targeting 23,091 .
If it sustains above 23,239 , consider a long trade with a target of 23,374 . Place a stop loss below 23,239 .
Risk Management Tip: For options, use call spreads instead of naked call buying to reduce time decay losses.
Scenario 2: Flat Opening (Near 23,091)
🟡 Flat openings indicate neutral sentiment, often requiring more patience for market direction.
Key Levels: Monitor the No-Trade Zone (23,048 - 23,091) .
Plan of Action:
Avoid trading within the No-Trade Zone unless a breakout above 23,091 or a breakdown below 23,048 occurs.
Above 23,091 : Initiate a long trade with a target of 23,239 . Place a stop loss below 23,091 .
Below 23,048 : Go short with a target of 22,900 . Stop loss above 23,048 .
Risk Management Tip: Avoid impulsive trades. Let the market establish direction first.
Scenario 3: Gap-Down Opening (100+ Points Below 23,048)
🔴 A gap-down opening suggests bearish sentiment. Look for opportunities near strong support levels.
Key Levels: Focus on 22,825 - 22,689 (Buyer’s Try Zone).
Plan of Action:
If Nifty approaches the Buyer’s Try Zone and shows a bullish reversal, initiate a long trade with a target of 23,048 . Stop loss below 22,689 .
If it sustains below 22,689 , consider a short trade targeting 22,600 .
Risk Management Tip: Use option strategies like put spreads to limit risk in highly volatile markets.
Tips for Risk Management in Options Trading:
✔️ Avoid trading aggressively during the first 15 minutes of market opening. Let volatility settle.
✔️ Focus on spreads (e.g., bull call spread or bear put spread) to control risks better.
✔️ Use proper position sizing: Limit risk to 2-3% of your total capital per trade.
✔️ Adjust positions dynamically as levels are tested or broken.
Summary and Conclusion:
The market is poised for volatile movement on 14-Jan-2025. Stick to the plan and respect the No-Trade Zone for flat openings. Use the Buyer’s Try Zone for potential reversals in case of a gap-down opening. Patience, discipline, and effective risk management will be your key to success.
Disclaimer:
I am not a SEBI-registered analyst. This analysis is for educational purposes only. Please do your research or consult a financial advisor before making any trading decisions.

Nifty in search of bottom. As it was expected Nifty plummeted further in search of bottom. Nifty closed at 23085 which is near a fragile support of 23057. It does not look likely that The reasons for the fall are various as explained in the previous posts. Some of reasons being constant selling of FIIs under the guise risk free return available in US debt market in addition to other value buying options emerging in other developing markets.
Nifty valuations have seen reasonable correction now buying can emerge slowly in next 1 to 4 weeks as per my understanding. Dollar is at valuations that are hardly justified and once the correction in Dollar starts we will see FIIs returning to Indian markets. The bottom support levels are at 23057, 22800, 22421, 21783, 21294 and finally 20813 region. It will be interesting to see which of these levels emerge as a firm bottom from where Nifty can bounce back. Resistances for Nifty now seem to be at 23359, 23690 (Father Line Resistance), 23938, 24060 (Mother Line Resistance), 24525, 24948, 25379, 25782 and finally 26277. Once previous ATH is crossed we will see new highs in Nifty hopefully within this year in the range of 27 or 28K. As of now little bit of pain still remains in the market. Nifty is already in the EXTREME FEAR ZONE AT 23.30. Long term investors can start value buying. (As per Ticker tape).
Extreme fear zone (<30) suggests a good time to open fresh positions as markets are likely to be oversold and might turn upwards.
Extreme greed zone (>70) suggests to be cautious in opening fresh positions as markets are overbought and likely to turn downwards.
Disclaimer: The above information is provided for educational purpose, analysis and paper trading only. Please don't treat this as a buy or sell recommendation for the stock or index. We do not guarantee any success in highly volatile market or otherwise. Stock market investment is subject to market risks which include global and regional risks. I or my clients might have positions in the stocks that we mention in our posts. We will not be responsible for any Profit or loss that may occur due to any financial decision taken based on any data provided in this message. Do consult your investment advisor before taking any financial decisions. Stop losses should be an important part of any investment in equity.

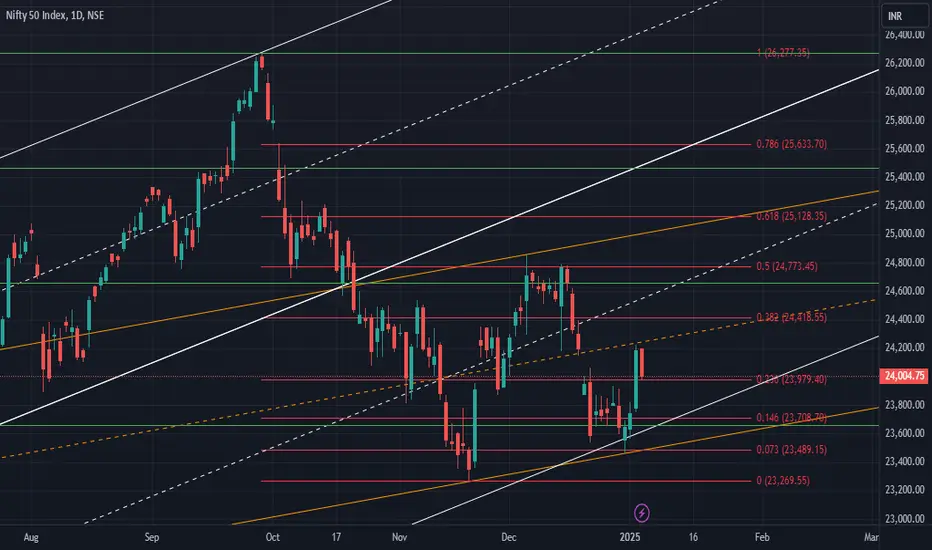
The Wave is Shifting: Anticipate NIFTY’s Next Move!Dear Traders,
I hope this message finds you well in your trading endeavors and personal pursuits. I am excited to share a compelling opportunity with you through a new NIFTY analysis that sheds light on the continuation of the market shift.
Preliminary Analysis Overview:
The correction initiated on September 27, 2024, is a correction for the move from June 17, 2022, to September 27, 2024 (15,183.40 to 26,277.35). This move has spanned over 120 weeks (834 days) in time and 11,093.95 points in price. This necessitates a long-term and deeper correction, which is currently underway. This can be visually represented by the trend lines:
The downward trend from the all-time high continues, which is currently experiencing a corrective phase within a larger correction.
There are two potential phases for the ongoing trend:
Phase I:
The initial phase of correction primarily tested the .236 R of the aforementioned motive wave (refer to the figure below):
Following the correction, there is a correction within the correction in a larger degree (although the primary downtrend remains intact).
This internal correction is anticipated to rise further to test 0.146 R and 0.073 R of the long-term bull market (serving as potential resistances).
RI – 24,254.10
RII – 24,600 ~24,657
RIII – 25,100 ~25,120
*These values are not actual but merely levels.
Time resistances are anticipated on January 9th and February 17th (of considerable strength).
Reference:
Phase II:
Following the completion of the internal correction, the market is anticipated to resume its current downward trend in a more significant manner to test the 38.2 R (21,500 levels) + static support junction, which will be further discussed as the market evolves.
---
**Important Dates to Remember: **
Please note the following significant economic indicators and their release dates:
**January 8, 9, and 10: ** Federal Open Market Committee (FOMC) meeting and employment data release (NFP).
**January 13 and 14: ** Inflation data release.
**January 13-16: ** Sales and inflation data release.
---
**Final Verdict: **
The current uptrend is considered interim. The primary trend remains downward and is anticipated to persist further and deeper. This trend is expected to test the 38.2% resistance level coinciding with the 21,360-support level.
---
**Strategy: **
Given the prevailing market conditions, adopting a bullish stance appears prudent. Key levels to monitor include 24,657 and 25,120, which are expected to be tested. It is imperative to remain vigilant and informed about potential opportunities that may arise.
------
Fellow Traders,
The creation of this valuable analytical resource has required countless hours of dedication and effort. If you find it useful, I humbly request your support by boosting the idea and following me (updates will be provided via this post, new posts, and through minds). Your comments and thoughts on this idea are highly valued, and I am committed to engaging with each one personally.
Thank you for investing your time in reading this article.
Wishing you profitable and fulfilling trading endeavors!
Disclaimer:
Before concluding, I must emphasize that the insights shared are based on my analysis. It is crucial for you to conduct your own research and, if necessary, consult with a financial advisor before making any trading decisions. The dynamic nature of financial markets necessitates that your strategies align with your financial objectives and risk tolerance.
#NIFTY Intraday Support and Resistance Levels - 13/01/2025Gap down opening expected in nifty near the 23350 level. After opening if nifty starts trading below 23350 level then expected quick downside rally upto 23200 level. For today's session 23200 level will act as a important support for nifty. Upside 23500 level will act as a strong resistance. Any upside rally can be reversal from this level. Bullish movement in index only expected above 23550 level.

BANKNIFTY : Trading levels and Plan for 13-Jan-2025Bank Nifty Trading Plan for 13-Jan-2025
Key Levels to Watch:
🔹 Last Intraday Resistance: 49,596 – 49,666
🔹 Opening Resistance Zone: 49,164 – 49,270
🔹 Opening Support/Resistance: 48,802
🔹 Support Zone on Day Chart: 48,484
🔹 Major Support Level: 47,788
Gap-Up Opening (+200 Points Above)
If Bank Nifty opens above 49,270:
📈 Plan for Long Trades:
Look for bullish momentum towards the Last Intraday Resistance Zone (49,596 – 49,666).
A breakout above 49,666 with strong volume can push prices toward 49,800 or higher.
Enter long trades only after confirmation with a strong bullish candle.
Stop Loss: Below 49,270 for a favorable risk-reward ratio.
📉 Rejection Scenario:
If the price fails to hold above 49,666, book profits on long trades and wait for a pullback near the Opening Resistance Zone (49,164 – 49,270) for re-entry.
💡 Tip: Hedge gap-up trades with put options to manage volatility.
Flat Opening (±50 Points Around 48,779)
If Bank Nifty opens near 48,779:
⚠️ Wait for Directional Clarity:
Avoid entering trades immediately. Let the price action define the trend between 48,484 (Support) and 49,270 (Resistance).
🟢 Bullish Breakout Plan:
A breakout above 49,270 may lead to a rally toward 49,596 – 49,666.
Go long only after a retest of the breakout level with a stop loss below 48,802.
🔴 Bearish Breakdown Plan:
If the price breaks below 48,484, it could slide toward 47,788.
Consider shorting only if strong selling pressure is observed. Keep a stop loss above 48,802.
💡 Tip: Avoid overtrading in flat openings. Wait for the first 30 minutes to confirm the trend.
Gap-Down Opening (-200 Points Below)
If Bank Nifty opens below 48,484:
🔻 Reversal Plan:
Look for buying opportunities near 47,788 (Major Support).
If a bullish reversal is confirmed, go long with a target toward 49,164 – 49,270.
🚨 Breakdown Scenario:
If the price breaks below 47,788, expect further downside.
Avoid catching a falling knife—wait for consolidation before considering long trades.
💡 Tip: Use ATM or ITM options to benefit from intraday volatility in a gap-down scenario.
Summary:
For a Gap-Up Opening , focus on a breakout above 49,666 but be cautious around key resistance levels.
For a Flat Opening , wait for a decisive breakout or breakdown from the range 48,484 – 49,270.
For a Gap-Down Opening , 47,788 will act as a critical support zone. Look for reversal opportunities or breakdown trades.
💡 Risk Management Tip: Avoid over-leveraging, and consider straddle/strangle strategies to capture volatile moves.
Disclaimer:
I am not a SEBI-registered analyst. This trading plan is for educational purposes only. Please consult a certified financial advisor before making trading decisions. Trade wisely! 💼

NIFTY : Trading Plan and Important levels for 13-Jan-2025Key Levels to Watch:
Profit Booking Zone: 23,775 – 23,830
Last Intraday Resistance: 23,663
Opening Resistance: 23,588 – 23,613
No Trading Zone: 23,437 – 23,470
Opening Support: 23,339
Initial Support: 23,250
Buyer's Support Zone: 23,057 – 23,094
Gap Up Opening (100+ Points Above)
If Nifty opens above 23,613:
Monitor price action near the 23,663 resistance zone. A breakout with strong volume above this level can lead to a rally towards the Profit Booking Zone at 23,775–23,830. Consider initiating long positions if confirmation occurs.
If the price struggles near 23,663, wait for a rejection pattern and evaluate for potential pullback trades back to the Opening Resistance zone (23,588–23,613).
💡 Risk Management Tip: When trading gap-ups, avoid entering impulsively. Let the price settle for the first 15 minutes. Use tight stop losses for trades near resistance zones.
Flat Opening (±50 Points Around 23,437)
If Nifty opens within the No Trading Zone (23,437–23,470):
Stay cautious and avoid taking trades until the price breaks out of this consolidation range.
A breakout above 23,470 with strength can lead to a move toward the Opening Resistance zone (23,588–23,613). Enter long positions only after a successful retest of this breakout.
A breakdown below 23,437 could push the price toward Opening Support (23,339). Short positions can be initiated after confirmation.
💡 Risk Management Tip: Avoid overtrading in no-trade zones. Patience is key to spotting high-probability setups.
Gap Down Opening (100+ Points Below)
If Nifty opens below 23,339:
Watch for buying opportunities in the Initial Support zone (23,250). If the price forms a bullish reversal pattern, consider entering long trades targeting the Opening Resistance zone (23,588–23,613).
If selling pressure persists and Nifty moves toward the Buyer's Support Zone (23,057–23,094), this zone becomes crucial for long trades with tight stop losses.
A breach of 23,057 with strong volume can lead to further downside. Avoid long trades until support is regained.
💡 Risk Management Tip: In gap-down scenarios, avoid catching falling knives. Use smaller lot sizes and wait for strong reversal signals before entering trades.
Summary & Conclusion
For a gap up, focus on levels above 23,613 and monitor the resistance zones carefully for breakouts or rejections.
For a flat opening, wait for a breakout or breakdown from the No Trading Zone (23,437–23,470) to avoid false moves.
For a gap down, be patient around Initial Support (23,250) or Buyer's Support Zone (23,057–23,094) for reversal trades.
💡 Options Trading Tip: Use OTM strikes near key levels for intraday trades. Always hedge your positions, especially in volatile conditions.
Disclaimer:
I am not a SEBI-registered analyst. This plan is for educational purposes only. Please consult with your financial advisor before taking any trades. Trade responsibly!

Long in HINDUNILVR HINDUNILVR is on the 200EMA support and it's a high possibility for 2550 first target.

#Nifty50 What Lies Ahead for Nifty & S&p500,13-17th Jan 2025The Nifty Index experienced a sharp decline this week, closing at 23,431, a significant 570 points below the previous week's close. While the index reached a high of 24,089, it ultimately succumbed to selling pressure, finding support at 23,344. As forecasted, the Nifty traded within the predicted range of 24,500 to 23,300. For the upcoming week, I anticipate the index to remain confined within a range of 23,950 to 22,900 .
Given the prevailing bearish sentiment, a potential short-term bounce could unfold next week to lure in unsuspecting buyers before a renewed downward move. Historically, whenever the Nifty has breached the support of the 50-week Exponential Moving Average (WEMA50), it has typically undergone a 5-6% correction. Based on the current level of 23,431, the Nifty may find crucial support near the 22,200-22,400 zone.
Turning to the US markets, the S&P 500 found support at the 100-day Exponential Moving Average (DEMA100) level of 5,817 and closed at 5,827. The upcoming week will be pivotal. If the S&P 500 successfully defends the 5,807 low, a potential rally towards the 5,926-5,944 range could materialize. However, a weekly close below the 5,800 mark would signal a significant bearish turn for global markets, potentially triggering a deeper correction towards the 5,637 or even 5,504 levels.
Wishing readers a very happy Lohri and Makar Sakranti.

Nifty looking weak after closing below Mid-channel. Nifty looking very weak after closing below Mid-channel support and 50 weeks EMA Mother line support. Mother line support or the 50 Week EMA was at 23442 and the closing we got is at 23431. If Nifty does not recover quickly and claims the Mid-Channel and 50 Weeks EMA, we might be in for more fall with supports at 23273, 22800 (Major Support Zone). If we get a weekly closing below 22800 we will fall totally into bear territory. In such a scenario bears can drag Nifty further down to 22025, 21294 or even near channel bottom of 20813. 20813 will again be a major Parallel chanel bottom support. Resistances on the upper side will be at 23442, 23938, 24525 and 24948 before we can reclaime 25K levels. Later in the year when we get a closing above 25K levels we may again face the 25782, 26277 previous Nifty peak will be major resistances. Nifty channel top post recovery seems to be at 27255. We may reach there in hopefully by mid or end H2 2025. Value Investors can start looking out for bottom fishing and value buying opportunities specially in the Large and selective mid and small caps.
Disclaimer: The above information is provided for educational purpose, analysis and paper trading only. Please don't treat this as a buy or sell recommendation for the stock or index. We do not guarantee any success in highly volatile market or otherwise. Stock market investment is subject to market risks which include global and regional risks. I or my clients might have positions in the stocks that we mention in our posts. We will not be responsible for any Profit or loss that may occur due to any financial decision taken based on any data provided in this message. Do consult your investment advisor before taking any financial decisions. Stop losses should be an important part of any investment in equity.

#NIFTY Intraday Support and Resistance Levels - 10/01/2025Today will be flat opening expected in nifty. After opening important level for nifty is 23500 level. In case nifty starts trading below this level then expected strong downside movement in index. Above this level expected nifty will consolidate in between range of 23550-23750 levels. Below 23500 level next support for nifty will be 23200 so 250-300+ points rally expected below this level.

NIFTY : Trading Plan and Levels for 10-Jan-2025
Introduction:
Nifty has been consolidating within a defined range, with 23,622 acting as immediate resistance and 23,490 providing opening support. The "No Trade Zone" marked around 23,557-23,622 highlights areas of indecision where price movement lacks clarity. This trading plan evaluates different opening scenarios, including gap-up, flat, and gap-down openings, considering a gap of 100+ points.
Scenarios for 10-Jan-2025:
Gap Up Opening (100+ Points Above 23,622):
If Nifty opens above 23,622:
Monitor Retest of 23,622: A retest and hold of this level can be a potential opportunity to go long, with the first target at 23,787 and a stretch target at 23,843. Place a stop loss below 23,600 to protect capital.
Failure to Hold 23,622: If the price fails to sustain above 23,622, expect a correction toward 23,557. Wait for a reversal signal before taking any fresh positions.
Options Trading Tip: For a gap-up opening, consider buying call options close to the money if 23,622 holds as support. Avoid buying options with low liquidity.
Flat Opening (Near 23,557):
If Nifty opens near 23,557:
Focus on Breakout or Breakdown: Let the price action settle for the first 30 minutes. A breakout above 23,622 offers a long opportunity, with targets at 23,787-23,843.
Break Below 23,490: A breach of 23,490 could lead to a bearish move toward 23,364. Avoid long positions unless there’s a recovery signal around 23,490.
Risk Management Tip: Use proper position sizing. Avoid risking more than 2% of your capital on any single trade.
Gap Down Opening (100+ Points Below 23,490):
If Nifty opens below 23,490:
Watch for Reversal at 23,364: This support zone may attract buyers. Look for bullish reversal patterns to go long, targeting 23,490.
Break Below 23,364: A breach below 23,364 could lead to a significant downside toward 23,251. Aggressive short positions can be taken only after confirmation with a stop loss above 23,364.
Options Trading Tip: For a bearish gap-down, consider buying put options near resistance levels or selling call spreads for a safer risk-reward ratio.
Summary and Conclusion:
Nifty’s price action around 23,622 and 23,490 will determine the market’s trend for the day. Avoid trading within the "No Trade Zone" (23,557-23,622) unless a clear breakout or breakdown is visible. Risk management is key, especially in volatile conditions. Always use stop losses and stick to your trading plan.
Disclaimer:
I am not a SEBI-registered analyst. This trading plan is for educational purposes only. Please consult your financial advisor before taking any trades. Trade responsibly.

Bearish or Bounce Ahead?
Here’s my detailed analysis and outlook for Nifty based on daily and weekly charts:
Daily Chart Insights
Trend:
Nifty is in a clear downtrend with lower highs and lows since breaking 24,000.
Currently consolidating near 23,500, which acts as a critical support zone.
Volume Profile:
High selling volume on down days shows persistent institutional pressure.
Buyers are defending 23,500, but no strong confirmation of reversal yet.
Key Levels:
Resistance:
23,800-23,850: Immediate resistance with heavy Call OI.
24,050: Higher timeframe resistance.
Support:
23,500: Immediate support.
23,400-23,350: Breach could lead to more downside.
Indicators:
RSI: Near oversold (~40), but no bullish divergence.
Moving Averages: Below 50-DMA and 200-DMA, confirming bearish momentum.
Weekly Chart Insights
Trend:
Downtrend continues, with Nifty failing to reclaim critical levels like 24,200.
Last week’s bearish candle shows sellers remain dominant.
Volume Profile:
Increased selling volume on red candles confirms institutional sell-off.
Buyers look weak below 23,500.
Key Levels:
Resistance:
24,000-24,200: Strong supply zone.
24,400: Major resistance for any upside rally.
Support:
23,400-23,350: Breakdown could lead to 23,000.
23,000: Psychological and historical support zone.
Indicators:
RSI: Around 35, nearing oversold territory but with downside room.
MACD: Bearish crossover confirms momentum on the downside.
Prediction for the Month
Bearish Case (High Probability):
Failure to reclaim 23,800 could continue the downtrend.
Breach of 23,500 may lead to:
Target 1: 23,350.
Target 2: 23,000.
Bullish Case (Low Probability):
Breakout above 23,800 could trigger a short-term rally:
Target 1: 24,050.
Target 2: 24,400.
Outlook:
The market remains moderately bearish for the next month unless strong buying emerges at 23,500 or a breakout above 23,800 occurs.
What’s your view? Let’s discuss!
Disclaimer: This is my personal analysis and not financial advice. Please trade responsibly.

Prospects of Further downside in Nifty hanging by the thread. Pretty bad closing by Nifty today which has further downside in Nifty hanging by the thread. As you can see we are near the bottom of the pennant structure. If the downside is broken by any chance possibility of further downside can not be ruled out. However if the support of today's low is maintained possibility of upside will open up. Silver lining in the cloud is DII being on buying side and RSI has take an upward turn with closing above yellow line.
The supports for Nifty now are at 23463 Bollinger lower band support, 23380 and 23365 (Final Support).
Resistances on the upper side for Nifty are at 23682 (Bollinger mid band), 23722 (Mother line resistance), 23787 (Bollinger upper band), 23889 and finally 23980 (Father line resistance). Above 23980 closing the door for further up side will open. With Medium term targets being at 24073, 24103, 24232, 24302 and finally 24401. Above 24401 closing Bulls can jump back to business.
Disclaimer: The above information is provided for educational purpose, analysis and paper trading only. Please don't treat this as a buy or sell recommendation for the stock or index. We do not guarantee any success in highly volatile market or otherwise. Stock market investment is subject to market risks which include global and regional risks. I or my clients might have positions in the stocks that we mention in our posts. We will not be responsible for any Profit or loss that may occur due to any financial decision taken based on any data provided in this message. Do consult your investment advisor before taking any financial decisions. Stop losses should be an important part of any investment in equity.


#NIFTY Intraday Support and Resistance Levels - 09/01/2025Flat opening expected in nifty. After opening expected downside rally from the resistance zone near 23750 level. This downside movement can goes upto 23550 level. Any bullish rally only expected if nifty starts trading and sustain above 23800 level. This bullish rally can goes upto 24050 level after the breakout. Downside below 23500 level sharp fall expected in nifty upto the 23200 level.
