Nifty Review & Analysis - DailyPrice Action :
Nifty opened at previous day's close and tested pivot level finding buying around 23565 levels and rallied almost 200 points till 23775 levels and saw small profit booking. Post noon saw buying around 23700 levels and tested above 23800 and saw small profit booking towards end of the day loosing momentum. If sustained below 23800 can again test 23700-23730 levels and above 23820 if sustained can test 23950 levels.
Trend:
Nifty formed Higher High and Higher Low suggesting Long Trend
Options Data:
23700-800 Puts added Open Interest showing support. 23700 and 23900 CE shedded OI, don't have much resistance till 24050-100 levels.
Futures Data:
Nifty Futures closed positively with Increase in Open Interest suggesting Bullish
Outlook for Next Session:
Nifty looks Bullish above 23800 for tgt 24000-24050. (for next wkly expiry)
Positons:
Wait for 30min candle close above 23800 to go long for tgt 24000.
Niftytrend

F&O Trading Idea - Nifty & Bank Nifty, INDEX & StocksWe get rejection Trades at these levels. These are highly dependable levels for rejection when approached first (Virgin).
Look out for reversal candlestick patterns like Morning or Evening Star, etc.
Simple things work BEST in market! Rest of the Gyan can be built around it ;)
It works for Index, Stocks & even with wild animals like NIFTY now! It was BNF earlier, Hope you have realized by now :)

#NIFTY Intraday Support and Resistance Levels - 01/01/2025Flat or slightly gap up opening expected in nifty. For today's session 23800 level will be the upside resistance for the nifty. Any major bullish rally only expected above this level. Downside 23550-23600 zone works as a support for today's session. Any major downside expected below this support zone. Between the 23550-23800 level consolidation movements possible in index.

The Year that was and the year that can be. 2024/2025 story.Highlights of 2024:
a) Single digit return for Nifty in 2024. Nifty and Sensex rise 9% each.
b) Mid and Small Cap both rise 24% each.
c) Pharma and Real Estate both rise 40% each.
d) Trent, M&M and Bharti Airtel are the best performing Nifty stocks.
e) Asian Paints, Indusind Bank and Nestle are the worst performing Nifty stocks.
f) Dixon, BSE, OFSS and RVNL are the best performing Midcap stocks.
g) Vodafone Idea, AU SFB & Bandhan Bank are top Mid cap loosers.
Zones Where Nifty can form base and give closing in 2025.
Pessimistic Zone: In case of very negative year and some global catastrophe we can find Nifty forming a bottom between 19922 to 18476. *(Looks very unlikely as of now)*
Negative Zone: In case we have a negative closing for the year we may find Nifty closing the year between 21137 to 19922. *(Possible but we might get a bottom here and then the index might move upwards)*
Neutral Zone: The combination of Neutral to negative and neutral to Positive zone ranges from 26277 to 21137. Nifty can consolidate in this range. *(These are the lows and high of 2024).*
Positive Zone: We can see Nifty making a new high above 26277 and 27880. After which we can see a dip and further consolidation. *(A probable scenario)*
Optimistic Zone: In case we have a fantastic year we might see Nifty making a major peak between 27880 and 30060. *(This is a very optimistic scenario and less likely but you can never say never)*
Above assumptions of Nifty in 2025 are made based on Fibonacci Retracement applied from top to bottom and Bottom to top on the 2024 candle.
Disclaimer: The above information is provided for educational purpose, analysis and paper trading only. Please don't treat this as a buy or sell recommendation for the stock. We do not guarantee any success in highly volatile market or otherwise. Stock market investment is subject to market risks which include global and regional risks. We will not be responsible for any Profit or loss that may occur due to any financial decision taken based on any data provided in this message.

NIFTY ForecastThis is a long term forecast and path I see for NIFTY 50.
Of course it would not be in straight line. But I see a 50% decline in Nifty between now and June 2026.
It would be a pretty painful 2025 and 2026 for India.
All the best.
Marketpanda
Disclaimer: The information provided is for general informational and educational purposes only, and does not constitute financial, investment, or legal advice. None of the content shared should be relied upon as the sole basis for making investment decisions. Prior to making any financial or investment decisions, it is strongly recommended that you consult with a qualified financial advisor, accountant, or other professional who is familiar with your individual circumstances and risk tolerance. Any reliance you place on the information presented is strictly at your own risk, and we are not responsible for any losses, damages, or liabilities resulting from your investment or trading activities.

Nifty 50 - Elliot Wave AnalysisNifty 50 - Elliot Wave Analysis.
Nifty is undergoing a correction phase and is expected to continue the Downward trajectory.

BAJAJ AUTO Shortterm VIEW BEARISHAfter a good run from Rs.4,000 (in APRIL 2023) Stock has doubled and more to Rs.10,000.
Along the journey We have seen small consolidations at Rs.8,500-9,300 and stock reached Rs.10k After that we have seen a small dip towards 8,800.
Now its forming a HNS Pattern in Weekly TF.
I expect a Downside correction to 7,000-7,300 Zone.
I also believe Automobile Sector will go through some consolidation.

#NIFTY Intraday Support and Resistance Levels - 31/12/2024Flat opening expected in nifty. After opening if it's sustain above 23600 level then possible upside movement in starting session. Upside 23800 level will act a strong resistance for today's session. Major downside in nifty expected if it's gives breakdown of 23500 level. This downside rally can goes upto 23250 level in today's session.

NIFTY 50 31th DECEMBER 2024 If Nifty breaks 23,820, it may move towards 23,960 and then 24,020.
Green zone (23,504–23,460) serves as a strong support

Aditya Birla FashioMcap: Rs 30,000 cr
Losses as Capex still growing
Rumours of splitting the company.
Technically, in a downturn but has posted 26% for the year and outperformed Nifty.
Target 190 !!
timeline: Mid May 25.

NIFTY : Trading levels and Plan for 31-Dec-2024[
Intro: Review of Previous Plan (30-Dec-2024)
Check plan V/s Actual performance for 30-Dec-2024 here : .
b]Trading Plan for Nifty - 31-Dec-2024
Key Color Codes in the Plan:
Yellow Trend: Sideways
Green Trend: Bullish
Red Trend: Bearish
Trading Plan for 31-Dec-2024:
Scenario 1: Gap-Up Opening (100+ points above 23,768)
If Nifty opens above 23,768 , the price is expected to move towards the Last Resistance for Intraday (23,866) .
Observe price action near 23,866 ; a breakout with sustained volume can trigger a long position targeting the Resistance for sideways at 24,010–24,058 .
If rejection occurs at 23,866 , look for bearish patterns (e.g., evening star or bearish engulfing). Initiate a short trade with a target of 23,737 .
Place a stop-loss 20 points beyond the breakout/rejection level to manage risk.
Scenario 2: Flat Opening (23,636–23,768)
A flat opening indicates indecision, and the market is likely to remain within the Yellow sideways zone .
Avoid trading aggressively in the Opening Resistance/Support zone (23,737–23,768) . Wait for a breakout above 23,768 to initiate long positions , targeting 23,866 .
On the downside, a breakdown below 23,636 could lead to bearish momentum towards the Buyer’s Support zone at 23,427 . Initiate short trades if the price sustains below 23,636 , with a stop-loss above 23,700 .
Scenario 3: Gap-Down Opening (100+ points below 23,604)
A gap-down below 23,604 could lead to bearish pressure, testing the Buyer’s Support zone at 23,427 .
Observe reversal patterns (e.g., hammer or bullish engulfing) at 23,427 . If confirmed, initiate long trades targeting 23,604 .
If the support fails, further bearish action could drive the price towards 23,320 . Enter short trades on confirmation of the breakdown, with a stop-loss above 23,500 .
Risk Management Tips for Options Trading:
Focus on in-the-money options to reduce the impact of time decay in sideways markets.
Use hedged strategies like iron condors to capitalize on low volatility within the sideways trend.
Always calculate your maximum loss and ensure it does not exceed 2% of your trading capital .
Avoid holding positions overnight without clear directional bias in the market.
Summary and Conclusion:
The key levels for tomorrow’s trading session are 23,768 on the upside and 23,427 on the downside.
Patience is critical within the Yellow sideways zone ; wait for clear breakouts or breakdowns.
Use defined stop-loss levels to minimize risk and maximize reward.
Disclaimer:
I am not a SEBI-registered analyst. This plan is for educational purposes only. Please conduct your analysis or consult with a financial advisor before making any trading decisions.

Nifty analysis for intraday 31/12/2024.Nifty has been trading in a range for the last 7 trading sessions.
Index is trading around the 20 EMA and giving sharp recovery on both sides.
Today it has closed below the moving averages. If the market starts trading below the No trading zone, bearish entry can be created for next support levels.
On the upper side the break out 23900 can clear the round number figure and test the Daily 20 EMA.
Wait for the price action near the levels before entering the trade.

Nifty after multiple efforts not able to close above 23900.Nifty again tried to climb up and made a high of 23915 however there was tremendous selling pressure at that level and not only it could not sustain 23900 but also it failed to sustain 23800 or even 23650 levs. Nifty closed at 23644 levels. This is a closing below the Father line (200 days EMA) which was at 23693. This closing is indicative of weakness. Shadow of the candle has turned negative as of now. There is a strong support at 23567. If this support is broken the door way towards 23273 or even 22800 will open up. Relative strength index is 37.40 and RSI support is at 30 and 27.54 levels. Incase of positive closing tomorrow which looks little difficult as of now the resistances will be at 23650, 23693 (Father Line), 23809, 23961 and finally 24159 and finally Mother line (50 Days EMA) Resistance at 24266.
So as of now it looks like we will have a modest close for the year. It has been an year for Nifty which Amplifies with 'what could have been'. Right now we are around 10% of the peak and at 9% yearly gains as compared to yearly closing. Hoping that law of averages catches up next year and we reach new highs next year and close the year robustly.
Disclaimer: The above information is provided for educational purpose, analysis and paper trading only. Please don't treat this as a buy or sell recommendation for the stock. We do not guarantee any success in highly volatile market or otherwise. Stock market investment is subject to market risks which include global and regional risks. We will not be responsible for any Profit or loss that may occur due to any financial decision taken based on any data provided in this message.

#NIFTY Intraday Support and Resistance Levels - 30/12/2024Slightly gap up opening expected in nifty. After opening if nifty sustain above the 23850 level then expected upside rally upto the 24000+ level in today's session. Major downside expected if nifty not sustain above levels and starts trading below the 23800. This downside can goes upto the 23650 level.

NIFTY : Trading levels and Plan for 30-Dec-2024Trading Plan for Nifty - 30-Dec-2024
Intro: Review of Previous Plan (27-Dec-2024)
In the previous trading plan, we highlighted key zones, including the No Trade Zone (23,761–23,830) , the Last Intraday Resistance (24,010–24,058) , and the Buyer’s Support at 23,427 . As evident in the uploaded chart, Nifty traded within the highlighted zones, respecting the identified levels. The sideways momentum (Yellow trend) continued for most of the session, and an intraday attempt to breach the resistance zone was met with selling pressure, resulting in a close near the No Trade Zone.
Key Color Codes in the Plan:
Yellow Trend: Sideways
Green Trend: Bullish
Red Trend: Bearish
Trading Plan for 30-Dec-2024:
Scenario 1: Gap-Up Opening (100+ points above 23,930)
If Nifty opens above 23,930 , the market will be entering a bullish momentum zone. Look for a retest of the 24,010–24,058 resistance zone.
If the resistance is broken and sustained (hourly close above 24,058), initiate a long position targeting the retracement profit-booking resistance at 24,310 .
Place a stop-loss below the breakout level at 23,980 .
If the resistance holds, wait for rejection signals (red bearish candles) to initiate a short trade with a target of 23,761 .
Scenario 2: Flat Opening (23,800–23,850)
A flat opening indicates consolidation within the No Trade Zone (23,761–23,830) .
Avoid aggressive entries until Nifty decisively breaks out of the zone.
A breakout above 23,830 may signal a bullish move toward 24,010 . Look for confirmation with volume before entering a long trade .
On the downside, a breakdown below 23,761 could push Nifty toward 23,636 , the Last Intraday Support. In this case, initiate a short position with a stop-loss above 23,800 .
Scenario 3: Gap-Down Opening (100+ points below 23,730)
A gap-down opening below 23,730 signals bearish momentum. Observe if the price approaches the Buyer’s Support at 23,427 .
If the support holds, watch for reversal patterns (e.g., hammer or bullish engulfing) to initiate a long position targeting 23,761 .
A breakdown below 23,427 could extend the bearish trend to 23,300 or lower. Initiate a short trade if the breakdown is confirmed with a stop-loss above 23,500 .
Risk Management Tips for Options Trading:
Use defined risk strategies such as debit spreads to limit potential losses.
Avoid holding positions close to expiry to reduce time decay impact.
Trade with 1–2% of your total capital per trade to manage exposure.
Be cautious of high IV (Implied Volatility) spikes during gap openings.
Summary and Conclusion:
The plan emphasizes trading with confirmation signals and respecting highlighted zones.
Stay disciplined in the No Trade Zone to avoid unnecessary risks.
Follow the breakout and breakdown scenarios with defined stop-loss levels to maintain a favorable risk-reward ratio.
Disclaimer:
I am not a SEBI-registered analyst. All views are for educational purposes only. Traders are advised to do their analysis or consult with a financial advisor before making trading decisions.

#NIFTY50 TRADE SETUP - 30TH DECEMBER !!Nifty 50 Chart Analysis - 1 day Chart VieW
NSE:NIFTY
Nifty 50 Chart Analysis - Detailed Breakdown
Key Observations:
1. Current Price Zone: The Nifty index is trading at 23,832, with the price consolidating near recent lows.
2. Key Resistance Zones:
- 24,197.50: A significant resistance level, aligning with prior price rejections and a potential reversal area.
- 24,069.95: Intermediate resistance that needs to be cleared for bullish continuation.
3. Key Support Zones:
- 23,586.25: A strong support zone where buyers might step in, preventing further downside.
- 23,262.15: A deeper support level, marking the lower boundary of the recent bearish structure.
4. Market Sentiment: The price action indicates uncertainty, with equal probabilities of breakout above the resistance or breakdown below support.
Price Movement Summary:
- Upside Potential: A breakout above 24,197.50 could push the index towards 24,300+ levels. Thiszone has been highlighted in the chart as a bullish target area (marked in red box).
- Downside Risk: If the index breaks below 23,586.25, it could test 23,262.15 or lower, as depictedin the bearish target zone.
Trading Plan:
1. Bullish Plan:
- Entry: Above 24,069.95.
- Target 1: 24,197.50.
- Target 2: 24,300+.
- Stop-Loss: Below 23,961.55 (current pivot zone).
2. Bearish Plan:
- Entry: Below 23,586.25.
- Target 1: 23,536.60.
- Target 2: 23,262.15.
- Stop-Loss: Above 23,832.45.
Summary:
- Nifty is at a critical juncture, with immediate resistance at 24,069.95 and support at 23,586.25.
- Traders should wait for confirmation (breakout or breakdown) before initiating positions.
- Risk management is crucial as the index approaches year-end volatility.
Disclaimer:
This content is for educational purposes only. It is not a recommendation to buy or sell any financial instrument.The creator is not a SE-BI-registered advisor. Please consult with a certified professional before making investment decisions.

#Nifty50 Outlook for upcoming week 30-3rd Jan 2025The Nifty roared this week, gaining a solid 226 points, closing at a strong 23813! It reached a peak of 23938 before dipping to 23647. As predicted, the Nifty stayed within the 24100-23000 range, forming an interesting inside candle pattern. Excitingly, a bullish "W" pattern has emerged on the weekly chart!
If the Nifty can hold above the crucial 23900 level next week, we could see it trading between 24300 and 23400 . However, while a bounce is expected, the bearish Monthly chart might tempt big players to unload their positions. Stay alert!
Across the pond, the S&P500 took a 2.5% hit, closing at 5970 after reaching a high of 6049. The 5870-5850 support zone is critical. A breach could trigger a faster selloff, potentially testing the 5637/5551 support levels. For an upward move, the S&P500 needs to conquer 6050, paving the way for resistance levels at 6094/6142/6225.
Bottom line: Use any bounce next week as an opportunity to lock in profits. Stay informed and trade wisely!"
Wishing everyone a very happy & prosperous New Year.

Nifty on Weekly chart delicately placed. (Medium Term Outlook)Nifty is placed delicately on a weekly chart. Shadow of the candle is slightly positive but as the closing of the year looms large FIIs and the Bears might again try to sell on rise. On the positive side if FII will be on the buying side for the 2025 beginning and create fresh positive positions we might see a positive rally on the upside. The supports for Nifty remain at 23532, 23271 and 22724. 22724 is a very important support below which we might see a free fall which as of now can range till 21302 or even 20587. However there does not seem any trigger as of now which can bring Nifty to this levels but you never say never. On the positive side if there is a fresh buying trigger and a positive rally overall the resistances on the upper side seem to be near 23901, 24300, 24881 and finally 25409. 25409 is a strong resistance and closing above it will not only open the doors for touching the previous highs 26277 but also push Nifty towards making new highs.

Nifty IntradayPure technical levels...
if the early morning momentum continues during after noon session can test 24100 levels
currently forming a flag with lesser volume and also forming a base
Momentum has to be there for upside

#NIFTY Intraday Support and Resistance Levels - 27/12/2024Gap up opening expected in nifty above the 23850 level. After opening if it's sustain above this level then expected movement upto 24000 level. 23700-23850 levels are the consolidation zone for nifty. Any major downside expected below the 23700 level.

NIFTY : Trading levels and plan for 27-Dec-2024Trading Plan for Nifty – 27-Dec-2024
Intro: Yesterday's Plan vs. Actual
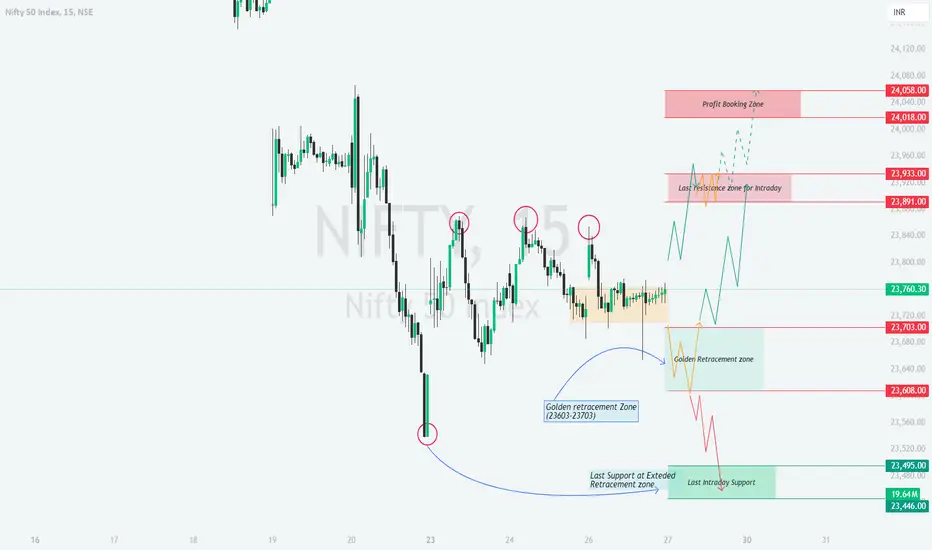
In yesterday’s plan, we highlighted the Golden Retracement Zone (23,603-23,703) and Last Resistance Zone for Intraday (23,891) as key levels to watch. The market opened near the consolidation zone (Yellow Trend), showing initial resistance at 23,760. The breakout towards 23,891 confirmed our bullish outlook (Green Trend), while reversals near the Profit Booking Zone (24,018-24,058) validated the importance of profit-taking zones.
Let’s now craft a detailed plan for 27-Dec-2024, keeping education and execution in focus.
Detailed Trading Plan for 27-Dec-2024
Gap-Up Opening (+100 points or more above 23,850):
A significant gap-up indicates strength, with Nifty likely testing the Last Resistance Zone for Intraday at 23,891. Sustained trading above 23,891 could lead to a rally toward the Profit Booking Zone at 24,018-24,058. This zone should be treated as a target for intraday traders, with potential reversals expected near 24,058.
⚠️ Action Plan: Avoid chasing the gap-up blindly. Instead, wait for a retest of 23,891 for long entries. If the price holds, aim for 24,018 and beyond.
💡 Risk Management Tip: Use trailing stop losses for options trades near resistance zones to lock in profits.
Flat Opening (Near 23,760-23,850):
A flat opening suggests indecision, with Nifty likely oscillating within the Golden Retracement Zone (23,703-23,760) initially. A breakout above 23,760 could push the index towards 23,891, while a breakdown below 23,703 may trigger bearish momentum towards 23,608.
⚠️ Action Plan: Observe the first 30 minutes of price action. For bullish trades, wait for confirmation of a breakout above 23,760. For bearish trades, look for rejection at 23,703, targeting lower levels.
💡 Risk Management Tip: Straddle or strangle strategies in options can be effective in such scenarios to capture directional moves.
Gap-Down Opening (-100 points or more below 23,760):
A gap-down opens the door for bearish moves, with immediate support at 23,608. A breakdown below 23,608 can extend the decline towards the Last Support Zone at Extended Retracement (23,495-23,446). Watch for potential reversals in this demand zone for contrarian trades.
⚠️ Action Plan: Avoid panic selling at the open. Look for a bounce at 23,495 for long entries with tight stop losses. If bearish momentum sustains below 23,495, initiate short trades targeting lower levels.
💡 Risk Management Tip: For bearish trades, consider bear put spreads to manage risk in a trending market.
Summary and Conclusion
For 27-Dec-2024, the key levels to watch are 23,891 on the upside and 23,608 on the downside. Gap-up openings need patience for confirmation, while flat and gap-down scenarios offer better risk-reward opportunities. Manage your trades with proper hedging strategies and always prioritize disciplined exits.
Nifty Intraday Trade Setup & technical analysis |27th Dec 2024Nifty moments for option and future trading 27/Dec/2024
follow us for more updates information.
message us for any stocks related information.

#NIFTY Intraday Support and Resistance Levels - 26/12/2024Gap up opening expected in nifty near the 23800 level. Currently nifty trading in between the consolidation zone of 23700-23850 level. Any major directional rally only expected after breakout of this zone. Strong downside movement expected if nifty starts trading below 23700 level. Upside movement possible if nifty starts trading and sustain above the 23850 level.
