nifty 50 intrady trading ideatoday we got 3 trade and showing you through chart.
how to took?
booked profit on support.
Niftytrend

Nifty is Bearish for next week. But Why ? "Ask me in comments".Nifty is facing resistance at this level for a specific reason. this week it can be bearish and continue to go down side.

#NIFTY Intraday Support and Resistance Levels - 30/06/2025Nifty is expected to open on a flat note near the 25,630 zone. The market has shown strong bullish momentum in recent sessions, and prices are now hovering near the upper resistance band of 25,750. If Nifty manages to break and sustain above the 25,750 level, a fresh upward move can be expected, with targets around 25,850, 25,900, and 25,950+. This could offer good long opportunities, especially above the 25,750–25,770 breakout range.
On the downside, if Nifty faces resistance around 25,750 and starts to reverse from that level, a short opportunity could emerge in the 25,750–25,700 zone. In such a case, reversal targets can be seen at 25,650, 25,600, and 25,550. Support at 25,550 will act as a crucial level to watch.

NIFTY OVERVIEWGet to know something from Manish Bhai that happened in the past. Now, compared to the current market, this is what the market is looking for.

NIFTY 50 INDEX CHART ANALYSIS FOR INTRADAYNIFTY 50 INDEX CHART ANALYSIS FOR INTRADAY.
here we are seeing of nifty 50 index chart, and one is resistance and one box is support that is yellow color and if price will come to support and then we will try to find of buy opportunity. if support zone breaks then we will plan for sell of nifty and if break of resistance, then we will see big rally.

The Nifty Futures Intraday Trend analysis on June 30, 2025According to my analysis and time cycle study, a Gap Down opening is likely on Monday, June 30, 2025. However, the intraday trend appears bullish. Key support levels are at 25,707 and 25,635, while resistance is seen at 25,788 and 25,808. I consider 25,808 to be a strong resistance level—if breached, it may trigger further bullish momentum.
The magnitude of the gap remains uncertain. These levels reflect my personal analysis and are not guaranteed.
Trading in Futures and Options involves significant risk. Traders are strongly advised to conduct their own technical analysis before making trading decisions.

#NIFTY Intraday Support and Resistance Levels - 27/06/2025Nifty is expected to open with a strong gap up near the 25,750 level, indicating bullish sentiment continuation from the previous sessions. If Nifty sustains above this 25,750 mark, it could trigger a breakout setup. In that case, long positions can be considered above 25,750 with targets placed at 25,850, 25,900, and 25,950+. This zone aligns with a potential resistance-turned-breakout level, and a move beyond it could bring in further momentum on the upside.
On the other hand, if Nifty fails to hold above the 25,750 level and shows signs of rejection, then it may consolidate or experience mild profit booking. Key intraday support lies near the 25,550–25,600 range. A break below this can drag the index down to 25,450 or even 25,250.

#FORTIS Today this stock brooked ATH level with strong volume. Through It can be predicted here that this will be a good investment option for the short term and long term.
CMP - 790
Key level:-
1) triangle pattern breakout
2) high volume
3) stock sustaining previous high
4) retest like formation

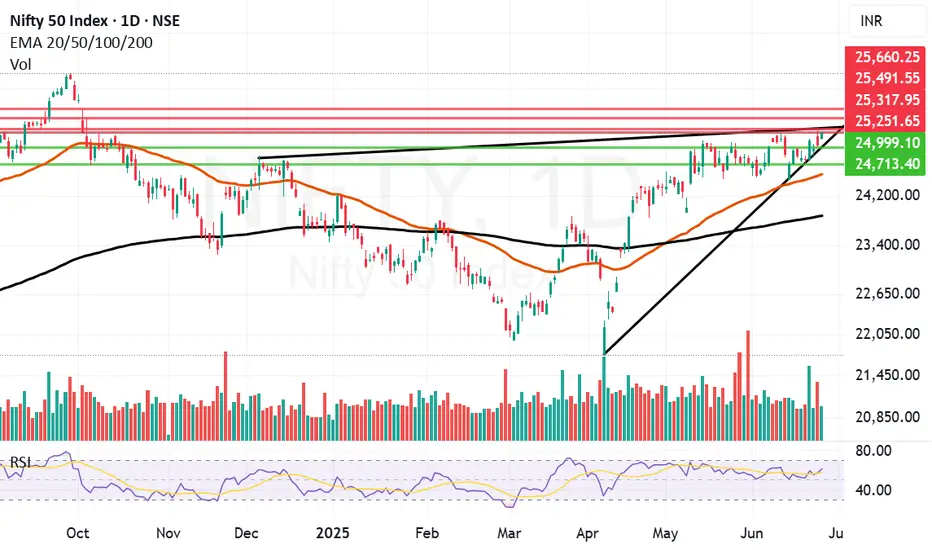
Major Breakout in Nifty now holding the levels key. We saw a major Breakout in Nifty today. Finally Nifty closed above much coveted levels of 25251. Nifty made a high of 25565 and closed at 25549 which was a remarkable comeback. What we are seeing on chart is a cup formation happening in Nifty. For flying further Nifty needs to have a strong closing tomorrow and stronger monthly closing on Monday that is 30th June. These 2 closings will be very important. We need a Nifty closing above 25884. Even if that does not happen a monthly closing above 25251 will also be considered a strong closing. Nifty is strongly on the path of recovery for sure and supports and resistances for Nifty remain as under:
Nifty Supports Remain At: 25251, 24994, 24760 and 24588 (Mother line). If by chance under unlikely circumstances Mother line is broken then Bears will become more empowered and might try to pull Nifty towards 24209 or even 23892 (Father line support).
Nifty Resistances Remain At: 25565, 25740, 25884, 26066 and finally previous All time high resistance of 26277.
Disclaimer: The above information is provided for educational purpose, analysis and paper trading only. Please don't treat this as a buy or sell recommendation for the stock or index. The Techno-Funda analysis is based on data that is more than 3 months old. Supports and Resistances are determined by historic past peaks and Valley in the chart. Many other indicators and patterns like EMA, RSI, MACD, Volumes, Fibonacci, parallel channel etc. use historic data which is 3 months or older cyclical points. There is no guarantee they will work in future as markets are highly volatile and swings in prices are also due to macro and micro factors based on actions taken by the company as well as region and global events. Equity investment is subject to risks. I or my clients or family members might have positions in the stocks that we mention in our educational posts. We will not be responsible for any Profit or loss that may occur due to any financial decision taken based on any data provided in this message. Do consult your investment advisor before taking any financial decisions. Stop losses should be an important part of any investment in equity.

#NIFTY Intraday Support and Resistance Levels - 26/06/2025Nifty is set to open slightly gap up today near the 25,250 mark, signaling a continuation of the ongoing consolidation phase. The market has been hovering around this zone for the past couple of sessions, making it a key inflection point. A sustained move above 25,300 can trigger bullish momentum, leading to targets of 25,350, 25,400, and 25,450+. This level also coincides with previous intraday highs, making it a potential breakout zone for aggressive buyers.
On the flip side, if Nifty faces rejection from this resistance zone and slips below the 25,250–25,200 levels, a downside move could emerge. In that case, short positions can be considered with immediate support levels at 25,150, 25,100, and 25,050. The opening hour will be crucial—traders should monitor for either a breakout above 25,300 or a breakdown below 25,200 to determine intraday direction. Volatility may increase due to expiry, so a wait-and-watch approach with tight stop-losses is advisable.

Final hurdle remains to be crossed before Nifty can fly further.One important final hurdle of 25251 remain just in front of Nifty before it can fly further. I can it a final hurdle because it is an important trendline resistance. Last 2 days Nifty has tried to climb above it but we did not get a closing above it yesterday and today as well. Today Nifty made a high of 24266 but closed at 25244. It could not hold on to the ground above 25251. The level is challenging but positive momentum built from today's display might allow it to close above the same. Only time will tell. Closing of this week will be very important.
Nifty resistances remain at: 25251, Closing above 25251 will empower Bulls to pull Nifty further upwards towards 25317, 25491 and 25660.
Nifty supports remain at: 24999, 24713, 24749 (Mother Line Support), 23875 (Father line support). (Closing below Father line support can bring Bears back into the game).
Disclaimer: The above information is provided for educational purpose, analysis and paper trading only. Please don't treat this as a buy or sell recommendation for the stock or index. The Techno-Funda analysis is based on data that is more than 3 months old. Supports and Resistances are determined by historic past peaks and Valley in the chart. Many other indicators and patterns like EMA, RSI, MACD, Volumes, Fibonacci, parallel channel etc. use historic data which is 3 months or older cyclical points. There is no guarantee they will work in future as markets are highly volatile and swings in prices are also due to macro and micro factors based on actions taken by the company as well as region and global events. Equity investment is subject to risks. I or my clients or family members might have positions in the stocks that we mention in our educational posts. We will not be responsible for any Profit or loss that may occur due to any financial decision taken based on any data provided in this message. Do consult your investment advisor before taking any financial decisions. Stop losses should be an important part of any investment in equity.
#NIFTY Intraday Support and Resistance Levels - 25/06/2025Nifty is expected to open with a gap-up near the 25,250 level, signaling early bullish strength. If the index sustains above the 25,250–25,300 zone after opening, we could see a continuation of the upward momentum toward the next resistance levels at 25,350, 25,400, and possibly 25,450+. However, if it fails to hold above 25,250 and slips back into the 25,100–25,050 zone, there could be selling pressure. A break below 25,050 may drag Nifty further down to 24,950. If 24,950 breaks, then a short trade could trigger, with targets at 24,850, 24,800, and 24,750. The key levels to watch today are 25,250 on the upside and 24,950 on the downside.

Nifty lost gains but it is a positive sign to close above 25KNifty in the Euphoria of ceasefire between Iran and Israel gained a lot of ground early in the day and made a high of 25317 but could not sustain the levels and lost massive 273 points due to profit booking to close the day at 25044. Although the loss was big but the silver lining is Nifty still ended the day 72 points in the green and closed above 25K levels. As there were news and claims related to ceasefire violations from both sides a lot of investors and participants were apprehensive of carrying long positions forward. If the things remain positive over night and if important resistance levels of 25116 and 25251 are crossed we might yet again see positive momentum building.
Nifty Resistances remain at: 25116, 25251, 25317. Closing above 25317 will lead to further upside towards the next resistance levels of 25491 and 25660.
Nifty Supports remain at: 25499 (Trend line support), 24713, 24521 (Mother Line Support) and 24463. closing below 24463 can had over the gains to the Bears who can drag index down towards Father line support of 23861.
Disclaimer: The above information is provided for educational purpose, analysis and paper trading only. Please don't treat this as a buy or sell recommendation for the stock or index. The Techno-Funda analysis is based on data that is more than 3 months old. Supports and Resistances are determined by historic past peaks and Valley in the chart. Many other indicators and patterns like EMA, RSI, MACD, Volumes, Fibonacci, parallel channel etc. use historic data which is 3 months or older cyclical points. There is no guarantee they will work in future as markets are highly volatile and swings in prices are also due to macro and micro factors based on actions taken by the company as well as region and global events. Equity investment is subject to risks. I or my clients or family members might have positions in the stocks that we mention in our educational posts. We will not be responsible for any Profit or loss that may occur due to any financial decision taken based on any data provided in this message. Do consult your investment advisor before taking any financial decisions. Stop losses should be an important part of any investment in equity.

#NIFTY Intraday Support and Resistance Levels - 24/06/2025Today, Nifty is expected to open with a gap-up near the 25,250 level. This level is crucial, as a sustained move above it can trigger a strong upside rally. If Nifty manages to hold above 25,250, we may see targets of 25,350, 25,400, and even 25,450+ in the coming sessions. On the downside, if the index slips below 24,950, it could lead to a corrective move toward 24,850, 24,800, and potentially 24,750 zones.
Traders should closely watch the 25,050–25,100 range for intraday strength, and the 24,950 mark as immediate support. Any breakout or breakdown from these levels will offer direction for the day. Maintain strict stop-loss and consider trailing profits as levels get tested.

#NIFTY Intraday Support and Resistance Levels - 23/06/2025A flat opening is expected in Nifty today. If Nifty sustains above the 25,050–25,100 zone after the open, we can expect an upside rally toward 25,150 → 25,200 → 25,250+ levels. This bullish momentum may continue if Nifty remains strong above 25,100.
However, any downside momentum may begin if Nifty starts trading below 24,950, which is a crucial support zone. In such a scenario, the index could slip toward 24,850 → 24,800 → 24,750- levels.
For intraday trades, focus on breakout or breakdown levels, and manage risk with trailing stop-losses in place.

Nifty Analysis EOD – June 20, 2025 – Friday🟢 Nifty Analysis EOD – June 20, 2025 – Friday 🔴
🚀 Bull Run Out of the Blue 🚀 – A Masterclass in Price Action
Nifty kicked off the session with a +56-point gap-up — surprising many, especially since Gift Nifty hinted flat to negative and yesterday’s close was weak. The real jolt came when, in the very first minute, price broke above the Previous Day High (PDH) and opened directly above the CPR zone — a rare occurrence when geopolitical tensions are peaking.
As I often say:
📌 “Market rarely follows the obvious. It thrives in the unexpected.”
Today was a textbook example of that.
Luckily, we were prepped. In yesterday’s note, I mentioned the bullish trigger above 24,862 — and right from the open, Nifty respected every level, offering "hope-on" and "hope-off" trades. What seemed like a 25K test turned into a blast to 25,136, with 100 points added in the last 30 minutes, leaving even seasoned traders awestruck.
The intraday close at 25,079.75 and the adjusted close at 25,112.40 — both above the 15th May closing levels — give a bullish vibe heading into the weekend. 🤞
💬 Personal Note:
Today was special — I sat with my elder daughter, helping her understand real-time market behavior. And what a day it was! From trend reversals, cup & handle, head & shoulders, wedges, shallow pullbacks, to aggressive one-way rallies — everything aligned perfectly to make this a live-action lesson in intraday trading.
🕯 5 Min Time Frame Chart with Levels
🕯 Daily Time Frame Chart
🕯 Daily Candle Breakdown
Open: 24,787.65
High: 25,136.20
Low: 24,783.65
Close: 25,112.40
Change: +319.15 (+1.29%)
📊 Candle Structure Breakdown
Real Body: 324.75 pts → ✅ Strong Green Candle
Upper Wick: 23.80 pts
Lower Wick: 4.00 pts
🔍 Interpretation
Opened flat and never looked back.
Minimal wicks = clear directional strength.
Buyers in full control from open to close.
🕯 Candle Type
📈 Bullish Marubozu-like — One of the strongest bullish signals. A powerful sign of trend continuation or breakout momentum.
📌 Key Insight
Today’s candle reinforces bullish strength.
Holding above 25,100 is key going forward.
A move above 25,136 could invite fresh upside targets — possibly 25,180+ and beyond.
🛡 5 Min Intraday Chart
⚔️ Gladiator Strategy Update
ATR: 251.32
IB Range: 116.6 → Medium IB
Market Structure: 📈 ImBalanced
Trades Triggered:
🔹 9:41 AM – Long Trade → Target Achieved (Trailing Exit, R:R 1:4.79)
🔹 12:18 PM – Short Contra Trade → Target Achieved (R:R 1:2)
🔹 1:07 PM – Long Trade → Target Achieved (Trailing Exit, R:R 1:2.62)
📌 Support & Resistance Zones
Resistance Levels
25,125 ~ 25,150
25,180 ~ 25,212
25,285
Support Levels
25,080 ~ 25,060
25,000 ~ 24,980
24,965
24,894 ~ 24,882
💭 Final Thoughts
The market surprised today — not just in movement but in clarity.The clean break, follow-through strength, and intraday structure hint at momentum continuation — but weekends can bring surprise news.
📌 Watch 25,100 as line in the sand on Monday.
🧠 “Markets are teachers. Today’s lesson? Expect the unexpected, but prepare like it’s already here.”
✏️ Disclaimer
This is just my personal viewpoint. Always consult your financial advisor before taking any action.

#NIFTY Intraday Support and Resistance Levels - 20/06/2025A flat opening is expected in Nifty today. After the open, all eyes will be on the 24,700 level, which has acted as a key support zone recently.
🔽 If Nifty starts trading below 24,700, downside momentum may pick up, with potential targets at 24,650 → 24,600 → 24,550-. Sustained weakness below 24,700 could attract short positions.
🔼 On the upside, if Nifty reclaims 24,750–24,800 and sustains, a bullish move may trigger toward 24,850 → 24,900 → 24,950+. However, 24,950 remains a strong resistance area from the past sessions.
⚠️ Strategy Note:
Market remains in a range-bound zone; wait for a decisive breakout for positional trades.
Use strict stop-losses and manage risk actively.
Ideal approach: scalp the range with quick profit booking unless a directional move confirms.

Nifty 50 Trapped in a Tight Range – Breakout or Breakdown Ahead?📍 Market Overview:
For over a month now, the Nifty 50 Index has been moving sideways in a tight consolidation range, frustrating both bulls and bears. Since May 12, 2025, the index has fluctuated between 24,350 on the lower side and 25,250 on the upper side, forming a classic rectangular pattern often associated with accumulation or distribution phases.
This zone is now becoming a crucial battlefield that could define the index’s direction for the coming sessions.
🔲 The Consolidation Zone
Support Zone: 24,350 – 24,450
Resistance Zone: 25,150 – 25,250
Consolidation Duration: ~30+ days
Current Price: 24,793.25
This range has seen multiple rejections at the top and bottom, reflecting indecisiveness in broader market sentiment. Traders are waiting for a trigger — either fundamental or technical — that could push the index out of this range with strength.
📈 Bullish Scenario: Breakout Above 25,350
If Nifty 50 breaks and sustains above 25,350, especially with higher volume and a strong daily close, it could signal a bullish continuation pattern. This scenario would be supported by:
A potential breakout from the rectangle consolidation.
Positive sentiment from global markets or domestic catalysts (monsoon, earnings, policy announcements, etc.)
A shift in FII or DII buying behavior.
📌 Breakout Target:
👉 26,000 – 26,100 (Based on measured move projection)
📌 Next Resistance Zone:
👉 26,050 – 26,200
In this case, traders may look for long opportunities with trailing stop-losses under the breakout zone.
📉 Bearish Scenario: Breakdown Below 24,350
On the flip side, a decisive breakdown below the 24,350 mark, especially with increased selling pressure and bearish candles, may lead to a quick decline toward the next major support levels.
📌 Breakdown Target:
👉 23,550 – 23,400
📌 Next Support Zone:
👉 23,500 – 23,300
This could trigger panic selling or profit-booking in frontline stocks. Caution is advised in such scenarios, and shorting opportunities may arise for experienced traders.
🧠 Strategic Insights for Traders
Avoid trading within the range: Unless you're scalping, wait for breakout/breakdown.
Watch global cues and FII flows: They often align with large breakouts.
Stick to risk management: Whichever direction the index moves, always set a stop loss.
🚀 Final Thoughts
The market is clearly in a wait-and-watch phase, but such consolidation periods often precede large moves. Nifty’s current structure suggests a breakout or breakdown is imminent — and being positioned correctly can make a big difference in returns.
Stay alert. Don’t predict — prepare.
⚠️ Disclaimer
This article is for educational and informational purposes only and does not constitute financial advice or a recommendation to buy or sell any securities. Trading and investing in the stock market involve risk, including the risk of losing capital. Always conduct your own research or consult with a qualified financial advisor before making any trading decisions. We are not responsible for any losses incurred from decisions based on this analysis.

#NIFTY Intraday Support and Resistance Levels - 19/06/2025Today, a flat opening is expected in Nifty around the 24,800 level. The index continues to trade within a narrow range, indicating market indecision and potential consolidation.
🔼 On the upside, if Nifty sustains above the 24,750–24,800 zone, it may trigger a bullish move toward 24,850 → 24,900 → 24,950+. Sustained strength above 24,950 can further open room for a breakout.
🔽 On the downside, if the index slips below 24,700, a short opportunity may arise toward 24,650 → 24,600 → 24,550-. Breach of 24,550 could lead to deeper correction.
⚠️ Key Notes:
The market is likely to remain range-bound and volatile.
Reversals from resistance and support levels are possible.
Trade with a strict stop loss and manage positions actively.

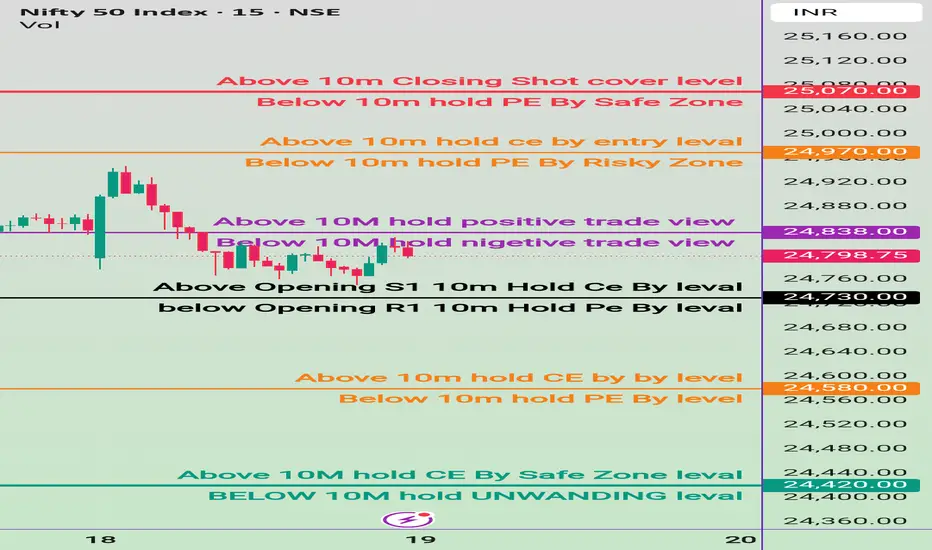
19 june Nifty50 brekout and Breakdown leval
✅ Safe Buy Zone (Support Levels):
24,437.70 → Above 10M: Hold CE by Safe Zone Level
24,420.00 → Below 10M: Hold Unwinding Level
→ Breach below could trigger unwinding / profit booking.
🔴 Resistance & Bearish PE Zones:
25,070.00 – Above 10m closing: Short Cover Level
→ Strong resistance; if crossed and sustained, short covering possible.
24,970.00 – Above 10m: Hold CE by Entry Level
→ Bullish entry confirmation level.
24,838.00 – Above 10M: Hold Positive Trade View
→ Indicates shift to bullish bias if held above.
⚫ Opening Based Levels:
24,730.00
→ Above Opening S1: Hold CE by Level
Below Opening R1 (level not clearly marked with value but appears near 24,730)
→ Hold PE by Level
Nifty Analysis EOD – June 18, 2025 – Wednesday🟢 Nifty Analysis EOD – June 18, 2025 – Wednesday 🔴
⚖️ Dhamakedar Start, But Indecisive Close – Weekly Expiry Caution Ahead
Nifty opened with a 65-point gap-down at 24,788.35, but what followed was a power-packed bullish start — within just 25 minutes, it surged over 150 points, hitting a day high of 24,947.55.
However, the euphoria didn’t last.
As the session progressed, the index gradually gave up all its gains, slipped below the previous day’s low, and finally found support at 24,750, a critical level. By the end of the day, Nifty settled around the opening zone at 24,812.05, just +23 points above open, while net change remained −41.35 points from the previous close.
The day showcased both strength and weakness — a typical "everyone-expected-fall-but-it-didn't-fall-enough" kind of day. The long upper wick reflects failed attempts by bulls, while the lack of breakdown keeps the bears in check.
Tomorrow is weekly expiry — caution is advised.
🕯 5 Min Time Frame Chart with Levels
🕯 Daily Time Frame Chart
🕯 Daily Candle Breakdown
Open: 24,788.35
High: 24,947.55
Low: 24,750.45
Close: 24,812.05
Change: −41.35 (−0.17%)
📊 Candle Structure Breakdown
Real Body: 23.70 pts → ✅ Green Candle (tiny body)
Upper Wick: 135.50 pts
Lower Wick: 37.90 pts
🔍 Interpretation
Strong bullish momentum early on, but buyers failed to hold above 24,900.
Long upper wick signals supply or profit-booking at higher levels.
Price closed near open despite wide range → indecision between bulls and bears.
🕯 Candle Type
🟨 Spinning Top – A textbook indecisive candle, often seen at turning points or during pauses in trend.
📌 Key Insight
Buyers couldn’t reclaim or close above 24,950 — resistance strengthened.
Support held at 24,750 — but barely.
Watch 24,950 on upside and 24,750 on downside — a breakout from either may decide expiry-day trend.
🛡 5 Min Intraday Chart
⚔️ Gladiator Strategy Update
ATR: 252.34
IB Range: 170.65 → Medium IB
Market Structure: ⚖️ Balanced
Trades:🚫 Short Trigger at 12:45 : Trapped - SL Hit
📌 Support & Resistance Zones
Resistance Levels
24,894 ~ 24,882
24,972 ~ 25,000
25,060 ~ 25,080
25,102 ~ 25,125
Support Levels
24,825 ~ 24,847
24,725 ~ 24,735
24,660
24,590
💭 Final Thoughts
When price travels 200 points but closes flat, it tells you something: Smart money is waiting.Weekly expiry ahead could bring unexpected moves.✅ Stay nimble. Stay alert.
🧠 “When in doubt, let the market shout — not whisper. Listen for the breakout.”
✏️ Disclaimer
This is just my personal viewpoint. Always consult your financial advisor before taking any action.

#NIFTY Intraday Support and Resistance Levels - 18/06/2025Today, Nifty is expected to open with a slight gap down near the 24,850 zone, indicating caution among participants at higher levels.
🔼 If Nifty sustains above the 24,750–24,800 zone, a positive move may unfold with upside targets at 24,850 → 24,900 → 24,950+. Sustained strength above 24,950 could lead to a further rally.
🔁 On the other hand, if Nifty approaches the 24,950–24,900 zone and shows signs of rejection, it could lead to a reversal. In that case, the downside targets may be 24,850 → 24,800 → 24,750-.
🔽 A decisive move below the 24,700 level would indicate bearish control, opening further downside towards 24,650 → 24,600 → 24,550-.

Nifty Analysis EOD – June 17, 2025 – Tuesday🟢 Nifty Analysis EOD – June 17, 2025 – Tuesday 🔴
⚠️ Resistance Rejection at 25K – Pause or Warning Sign?
Yesterday’s note rightly anticipated today’s challenge near 25K — and that’s exactly how the session unfolded.
Nifty opened at 24,977.85, right inside the critical resistance zone of 24,972–25,000, and formed a near O=H (Open = High) structure. The index quickly lost ground, dropping 135 points within the first hour to mark a day low of 24,813.70, forming a medium-sized Initial Balance (IB) within a wide CPR — conditions known for range-bound or tricky days.
Throughout the session, Nifty hovered largely inside the CPR and IB, with a false breakdown attempt around 12:50 PM. Such setups (wide CPR + higher value + medium IB) often result in false moves or low-conviction sessions, and today was no exception.
By day’s end, Nifty closed at 24,853.40, logging a modest −93.10 point dip, forming what can be termed as a healthy pullback — but the real test remains.
If bulls want to take charge again, they must breach and close above 25,025. On the flip side, if 24,800–24,820 gives way, it could trigger a slide toward 24,725 and 24,660 in the coming sessions.
🕯 Daily Time Frame Chart
🕯 Daily Candle Breakdown
Open: 24,977.85
High: 24,982.05
Low: 24,813.70
Close: 24,853.40
Change: −93.10 (−0.37%)
📊 Candle Structure Breakdown
Real Body: 124.45 pts → 🔻 Red Candle
Upper Wick: 4.20 pts
Lower Wick: 39.70 pts
🔍 Interpretation
Opened near the day’s high but selling dominated soon after.
Small upper wick shows minimal buyer strength; recovery attempts were mild.
Lower wick indicates some support emerged at day’s low, but overall tone remained bearish.
🕯 Candle Type
🟥 Bearish Candle – strong real body, minor lower wick — reflects steady intraday selling, though not overly aggressive.
📌 Key Insight
Nifty has now rejected the 25K zone two days in a row, turning it into short-term resistance.
If 24,800 breaks, expect pressure to mount — next watch: 24,725 → 24,660.
Bulls need a close above 25,025 to regain command.
🛡 5 Min Intraday Chart
⚔️ Gladiator Strategy Update
ATR: 258.48
IB Range: 131.60 → Medium IB
Market Structure: ⚖️ Balanced
Trades:🚫 No Trade Triggered by System
📌 Support & Resistance Zones
Resistance Levels
24,894 ~ 24,882
24,972 ~ 25,000
25,060 ~ 25,080
25,102 ~ 25,125
Support Levels
24,825 ~ 24,847
24,725 ~ 24,735
24,660
24,590
💭 Final Thoughts
Today’s session didn’t break anything major — but it also didn’t conquer anything new.Stuck between major support and resistance, the index is coiling for a move. Bulls have the burden of proof now.
🧠 “Markets don’t pause forever — compression leads to expansion. Be ready when it chooses its direction.”
✏️ Disclaimer
This is just my personal viewpoint. Always consult your financial advisor before taking any action.
