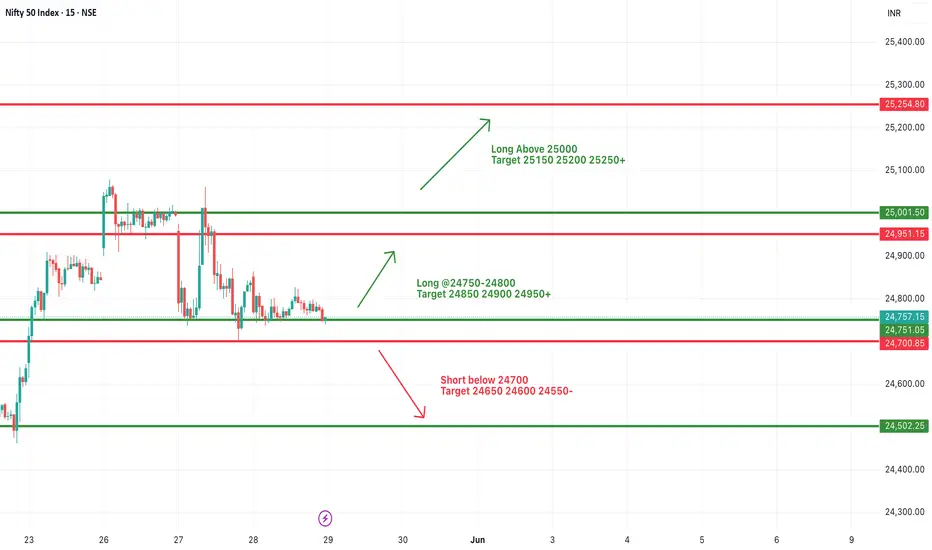
#NIFTY Intraday Support and Resistance Levels - 02/06/2025Nifty is expected to open flat near the 24700–24750 zone. The index has been consolidating in a tight range over the past few sessions, indicating indecision and a potential breakout on either side.
If Nifty sustains above the 24750–24800 zone, a bullish breakout may unfold with upside targets of 24850, 24900, and 24950+. A clear move above 25000 will confirm strong buying momentum with extended targets of 25150, 25200, and 25250+.
On the downside, if Nifty breaks below 24700 and fails to recover, fresh selling pressure could drag the index toward 24650, 24600, and 24550.
Niftytrend

Fibonacci Supports and Resistances Medium to Long term Outlook.Here we have tried to show you Fibonacci supports and resistances for Nifty on Monthly chart with Medium to Long term outlook. Fibonacci retracement suggests the nearby major resistances at 25233.
Crossing this zone and closing above this zone is imperative for proper bull market to return. In such a scenario the next resistances will be at 26277 (Previous All Time high). Closing above 26277 will open the door for the targets of 27K+. The Golden ratio of Fibonacci suggest the cap near 29540 within next 13 to 21 months. Supports for Nifty remain at 24443, 23903, 23375.
Below 23375 Bear market can return and can drag Nifty towards unlikely levels of 22737 or 21743. (This looks unlikely as of now but you can never say never looking at the Tariff wars and not so conducive Geo-Political situation of the subcontinent, Russia-Ukraine, Israel and other factors.)
So one eye of investors should be on macro factors also while looking at rosy micro factors related to Indian markets. While we look forward to making new highs in the next 1 or 2 years. Never forget Stop losses / Trailing stop Losses are best friends of investors. Stop losses protect your capital and trailing stop losses protect your profits.
Disclaimer: The above information is provided for educational purpose, analysis and paper trading only. Please don't treat this as a buy or sell recommendation for the stock or index. The Techno-Funda analysis is based on data that is more than 3 months old. Supports and Resistances are determined by historic past peaks and Valley in the chart. Many other indicators and patterns like EMA, RSI, MACD, Volumes, Fibonacci, parallel channel etc. use historic data which is 3 months or older cyclical points. There is no guarantee they will work in future as markets are highly volatile and swings in prices are also due to macro and micro factors based on actions taken by the company as well as region and global events. Equity investment is subject to risks. I or my clients or family members might have positions in the stocks that we mention in our educational posts. We will not be responsible for any Profit or loss that may occur due to any financial decision taken based on any data provided in this message. Do consult your investment advisor before taking any financial decisions. Stop losses should be an important part of any investment in equity.

Nifty Analysis EOD – May 30, 2025 – Friday🟢 Nifty Analysis EOD – May 30, 2025 – Friday 🔴
Whatever gain on Thursday, wiped out... today! classic trap reset day
📌 Opening Note:After Thursday’s expiry surprise rally, today’s session turned out to be a mean reversion reality check. With a 44-point gap-down, Nifty attempted a recovery but failed to cross the previous day’s high — just 27 points shy, and rolled over into selling pressure.
📊 Nifty Summary:
Today’s price action stayed entirely within yesterday’s range, forming an inside bar pattern — a classic sign of indecision before a breakout. The morning attempt towards the high was quickly sold into, and the index retraced straight to PDL, where the previous day’s swing low came to the rescue at 24,717.40. From there, it bounced back to VWAP and stayed rangebound (~60–70 points) for the rest of the session.
By the close, intraday gains of Thursday were completely erased — ending exactly at the breakout zone of yesterday: 24,736.65.
🛡 5 Min Chart with Levels
🪞 Mirror Candle Alert!Interestingly, today’s candle (May 30) closely mimics the May 28 candle in structure and price levels:
High: 24,864.25 ~ 24,863.95 (🔁 0.30 pt diff)
Close: 24,752.45 ~ 24,750.70 (🔁 1.75 pt diff)
Low: 24,737.05 ~ 24,717.40 (🔁 19.65 pt diff)
This pattern alignment forms a diamond shape across the last 3 days (May 28–30), visible clearly on Daily and 5-min charts. This diamond formation + inside bar combo could be a powerful breakout setup — direction to be confirmed by the next session’s range expansion. Check out 5 min and Daily candle chart for visual insight.
🛡 5 Min Chart with Patterns
🕯 Daily Time Frame Chart
📉 Daily Candle Breakdown:
Candle Type: Inside Bar
Structure:
Real Body: Very small
Wick Sizes: Decent on both ends, implying indecision
Interpretation:
Inside bar at the top of a move with a prior hammer-like candle signals pause or reversal.
A break of 24,717 on downside = bearish confirmation
A break of 24,893 on upside = bullish breakout
🛡 5 Min Intraday Chart
⚔️ Gladiator Strategy Update:
ATR: 276.90
IB Range: 83.95 → Small
Market Structure: Balanced
Total Trades: 3
🔹 10:15 – Short triggered → Trailing SL hit @ 1:1.6
🔹 11:30 – Short triggered → 1:1.5 achieved
🔹 13:40 – Short triggered → SL Hit
📌 Support & Resistance Zones:
Resistance:
24,768 ~ 24,800
24,820
24,882
24,894
24,920
24,972 ~ 25,000
25,062 ~ 25,070 (5th rejection!)
25,116 ~ 25,128
25,180 ~ 25,212
25,285 ~ 25,399
Support:
24,737 ~ 24,727
24,700
24,660
24,640 ~ 24,625
24,590
24,530 ~ 24,480
24,460
📌 What’s Next? / Bias Direction:
Nifty has compressed into a tight 3-day structure — with a diamond and an inside bar pattern.🎯 Watch for breakout beyond 24,894 or breakdown below 24,677 for directional clarity.Bias remains neutral until price decisively exits this range.
💬 Final Thoughts:
“Breakouts don't lie. Ranges prepare. Patience pays.”
Today was a classic trap reset day. Tomorrow, the trigger might fire. Stay sharp.
✏️ Disclaimer:
This is just my personal viewpoint. Always consult your financial advisor before taking any action.

#NIFTY Intraday Support and Resistance Levels - 30/05/2025Nifty is expected to open flat around the 24800–24850 range. The market has shown signs of recovery from lower levels, and if it manages to hold above the 24800–24850 support zone, we can expect a continuation of upward momentum. In that case, possible intraday upside targets are 24900, 24950, and a breakout beyond 25000 could extend the rally toward 25150, 25200, and 25250+ levels.
However, if Nifty fails to sustain above 24800 and faces resistance near 24900–24950, a pullback may occur. A confirmed breakdown below 24700 would signal weakness and could trigger a fresh round of selling. In such a scenario, downside targets would be 24650, 24600, and possibly 24550.
Today’s session may start off sideways with consolidation between key levels. Wait for clear confirmation above 24850 for longs or below 24700 for shorts. Keep trailing your stop-loss and book partial profits near every target zone.

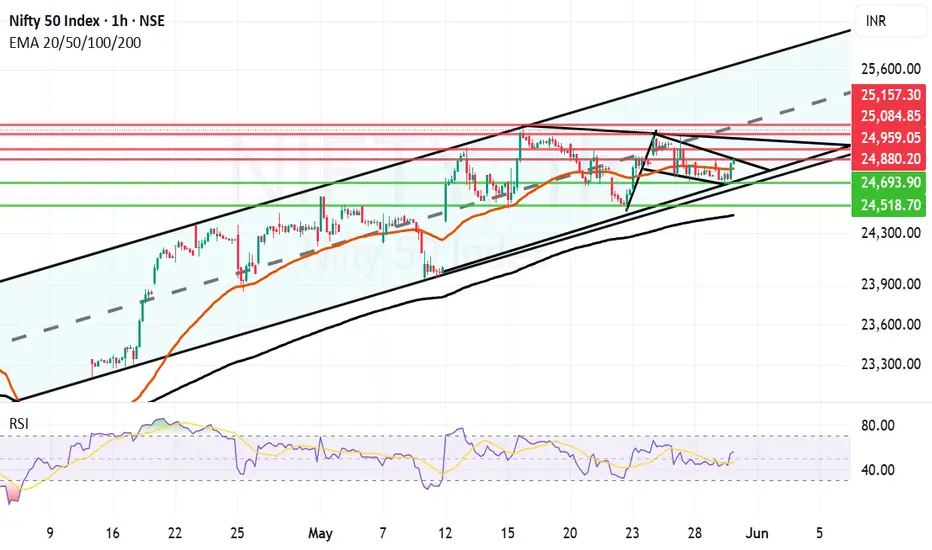
Flag and Pole kind of structure forming in Nifty. There is a very positive looking flag and pole kind of structure forming in Nifty hourly chart. This is within a parallel channel which Nifty has been following since April 15th 2025. This Flag and Pole breakout will come into effect if and only if we get a closing above 24880.
In case of flag and pole breakout happening the future resistances will be near 24959, 25084 and 25157. 25157 again will be a major resistance as it will be the mid of the channel.
The supports for Nifty in case the flag and pole breakout does not take effect are at 24804 (Mother line of hourly chart) 24693, 24518 and finally 24439.
Below 24439 bears can take over the market. Above 25157 Bulls can take over the market. Shadow of the candle is effectively neutral to positive.
Disclaimer: The above information is provided for educational purpose, analysis and paper trading only. Please don't treat this as a buy or sell recommendation for the stock or index. The Techno-Funda analysis is based on data that is more than 3 months old. Supports and Resistances are determined by historic past peaks and Valley in the chart. Many other indicators and patterns like EMA, RSI, MACD, Volumes, Fibonacci, parallel channel etc. use historic data which is 3 months or older cyclical points. There is no guarantee they will work in future as markets are highly volatile and swings in prices are also due to macro and micro factors based on actions taken by the company as well as region and global events. Equity investment is subject to risks. I or my clients or family members might have positions in the stocks that we mention in our educational posts. We will not be responsible for any Profit or loss that may occur due to any financial decision taken based on any data provided in this message. Do consult your investment advisor before taking any financial decisions. Stop losses should be an important part of any investment in equity.
Nifty Analysis EOD – May 29, 2025 – Thursday🟢 Nifty Analysis EOD – May 29, 2025 – Thursday 🔴
Tricky Expiry Day Rollout… Catch or Caught?
🗞 Nifty Summary:
Nifty opened with a gap-up of 88 points at 24,846, making a quick move to 24,889.70—but the bulls couldn’t hold for long. By 10:30, the key support zone at 24,800–24,768 was breached, dragging the index to an intraday low of 24,677.30.
Just when things seemed to be settling into a narrow expiry-day range, a sharp 65-point spike in 3 minutes surprised both sides—creating a mean-reversion V-shape move right back to VWAP and BC levels.
The real twist? A sudden domino-effect breakout at 15:00, marking a fresh high of 24,892.60 and closing at 24,880.85, nearly at the day’s peak.
⏪ Yesterday’s Note Recap:
"Most probable scenario: range-bound day between 24,660 and 24,882... Tricky expiry day."✔️ Spot on. Nifty respected the projected boundaries almost precisely.
🛡 5 Min Chart with Patterns and Levels
📈 Intraday Walk:
09:15 – Gap-up start, optimism in the air.
10:25 – Support at 24,800–24,768 tested and breached.
10:29 – IB Low Break and Day’s low at 24,677.30, bears step in.
12:38 – Surprise spike of 65 points in 3 min
Midday – Consolidation around VWAP and BC levels.
15:00 – Final push leads to breakout above day high → 24,892.60.
Close – Ends at 24,880.85, just below the day high.
🔍 Chart Observations:
✅ Inverse Head & Shoulders pattern formed around 24,768 on the 5-min chart—target achieved.
📦 Box Consolidation Zone repeated from yesterday and respected.
⚠️ Volatility spikes despite being an expiry day—tricky traps for both sides.
🛡 5 Min Chart with Patterns
🕯 Daily Time Frame Chart
🕯 Daily Candle Breakdown:
Open: 24,825.10
High: 24,892.60
Low: 24,677.30
Close: 24,833.60
Change: +81.15 (+0.33%)
Candle Structure:
Real Body: +8.50 pts → Tiny green body
Upper Wick: 59.00 pts
Lower Wick: 147.80 pts
Interpretation:A classic Hammer-like candle, showing strong intraday buying from lower zones. Although bulls couldn’t extend gains, they clearly defended 24,700 levels well.
🔔 Pattern Insight:
Outside Bar pattern on Daily → Often a bullish reversal sign
Bullish confirmation comes above 24,890+
Breakdown below 24,677 would invalidate the bullish signal
🛡 5 Min Intraday Chart
⚔️ Gladiator Strategy Update:
ATR: 291.38
IB Range: 110 → Medium
Market Structure: Balanced
Total Trades: 1
🕐 10:25 AM – 1st trade triggered→ Trailing SL hit at 1:3 risk-reward
🧱 Support & Resistance Levels:
Resistance Zones:
24,882
24,894
24,920
24,972 ~ 25,000
25,062 ~ 25,070 (5th rejection!)
25,116 ~ 25,128
25,180 ~ 25,212
25,285 ~ 25,399
Support Zones:
24,820
24,768 ~ 24,800
24,737 ~ 24,727
24,700
24,660
24,640 ~ 24,625
24,590
24,530 ~ 24,480
24,460
🧭 What’s Next?
Above 24,890 → May trigger short-covering rally toward 25,000, 25,065, and 25,116 levels.
Below 24,677 → Expect downside toward 24,625, 24,590, and possibly 24,530.
With expiry behind, volatility may remain elevated tomorrow as new series begins.
📌 Bias: Mild bullish, but needs confirmation above 24,890.
🧠 Final Thoughts:
“Markets don’t trap you; your bias does.”Stay sharp. Today was a day full of whipsaws—but also full of lessons.
✏️ Disclaimer:This is just my personal viewpoint. Always consult your financial advisor before taking any action.

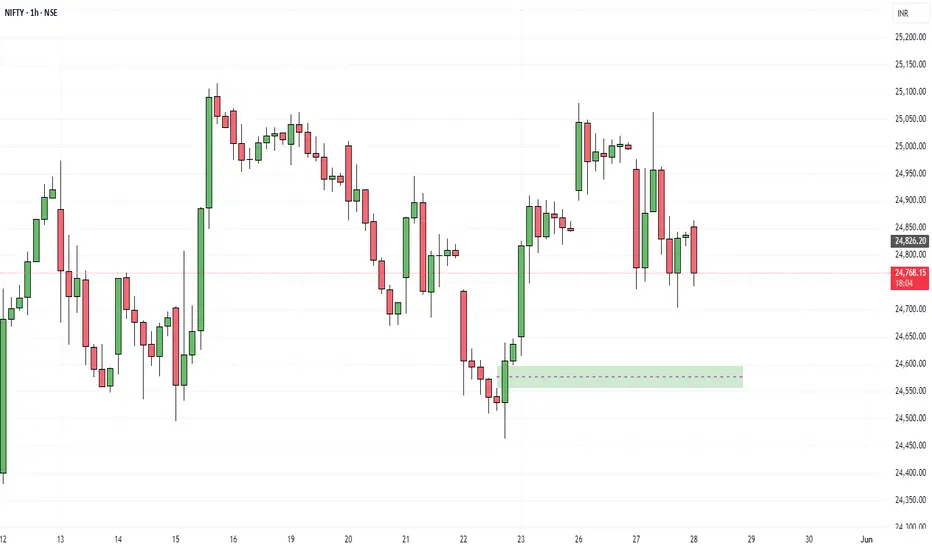
My Recent Trade In Nifty 50 ... On 1 hour time frame nifty is coming to get liquidity on FVG drew here.. after it may go to 25,000. let's see what happens...

#NIFTY Intraday Support and Resistance Levels - 29/05/2025Today, Nifty is expected to open flat near the 24750 level. If it sustains above the 24750–24800 zone, a bullish move is possible with upside targets at 24850, 24900, and 24950+.
Further rally may be seen if Nifty breaks above the 25000 level, aiming for extended targets of 25150, 25200, and 25250+.
On the downside, if Nifty slips below 24700, a bearish trend may unfold with downside targets at 24650, 24600, and 24550.
NIFTY 50
1. Ascending Channel:
Nifty is trending within a clear upward (ascending) channel, indicating a bullish trend as long as the price stays within this channel.
2. Support & Resistance:
There is a strong support zone in the range of 24,000–24,200, highlighted by a red-shaded area on the chart.
The current level (24,752.45) is near the middle of the channel and showing signs of minor correction.
3. Two Possible Scenarios (Arrows):
Scenario 1: From the current level, the market could move towards the upper boundary of the channel (around 25,500–26,000).
Scenario 2: There could be a short-term correction (downward movement) first, followed by a bounce from the support zone and then an upward move.
If you find this helpful and want more FREE forecasts in TradingView, Hit the 'BOOST' button
Drop some feedback in the comments below! (e.g., What did you find most useful?
How can we improve?)
Your support is appreciated!
Now, it's your turn!
Be sure to leave a comment; let us know how you see this opportunity and forecast.
Have a successful week
DISCLAIMER: I am NOT a SEBI registered advisor or a financial adviser. All the views are for educational purpose only

Important Level For Nifty.Here in one hour time frame nifty is coming to get some liquidity as you can see, after getting liquidity nifty may again go higher and make a new high.
#NIFTY Intraday Support and Resistance Levels - 28/05/2025Today, Nifty is expected to open flat near the 24800–24850 zone. If it sustains above 24800–24750, a bullish move is possible toward 24850, 24900, and 24950+.
Further momentum may be seen if Nifty breaks and holds above 25000, targeting 25150, 25200, and 25250+.
On the downside, if Nifty fails to hold above 24950–24900 and starts slipping below this zone, short trades can be considered with targets of 24850, 24800, and 24750.
A breakdown below 24700 may accelerate selling pressure, leading to extended downside targets of 24650, 24600, and 24550.
Expect choppy moves near key levels — trade with a defined stop loss and lock in profits at each stage.

Nifty Analysis EOD – May 27, 2025 – Tuesday🟢 Nifty Analysis EOD – May 27, 2025 – Tuesday 🔴
Another day, another 25K fight. Bulls tried hard, but bears had the final say — what about tomorrow?
📊 Nifty Summary:
The market opened with a slight gap-down of 38 points at 24,958. Within just 10 minutes, Nifty slid 207 points below the previous day’s low, diving into the 24,768–24,800 zone. It briefly halted around 24,737 — marking the first low of the day — and then suddenly reversed sentiment with a rapid 295-point rally within 45 minutes, breaking CPR, PDH, and even touching the previous week’s high. However, this strength didn’t last long. Gradually, Nifty fell back toward VWAP, broke below the current day low, and formed a new low at 24,704. It eventually closed at 24,826 — above the 24,768–24,800 support zone but below the PDL.
The rally between 24,768 and 25,062 was surprising in both speed and size. It didn't feel like short-covering or fresh buying, but it certainly caught many traders off-guard and likely led to position adjustments.
🛡 5 Min Chart with levels
📉 Intraday Walk:
🔻 Sharp fall within first 10 mins: 24,958 → 24,737
🔼 Sudden spike: 24,737 → 25,062 (rally of 295 points in 45 mins)
🔻 Gradual drop back to VWAP and beyond
🧭 Final dip: new low of 24,704 before recovery
✅ Closed at 24,826 — still above a key support zone
🧠 Key Observations:
Today's low (24,704) aligns near the 0.618 Fibonacci retracement from swing low to PDH — suggesting a potential end to the 3-day retracement phase if it holds.
Fair Value Gap (FVG) from May 22–26 is now filled, suggesting fresh buying interest may re-emerge.
But... closing below PDL (24,900) is a concern and hints at continued pressure.
It’s the fifth day of rejection from the 25,062–25,070 supply zone — a major wall to breach.
🕯 Daily Time Frame Chart
📉 Daily Candle Breakdown:
Open: 24,956.65
High: 25,062.90
Low: 24,704.10
Close: 24,826.20
Change: −174.95 (−0.70%)
🔍 Candle Structure
Real Body: Red (130.45 points) — signifies selling pressure
Upper Wick: 106.25 points — resistance near high
Lower Wick: 122.10 points — buyers tried to fight back➡️ Resembles an Inverted High-Wave Candle: signals indecision with bearish bias
Price volatility was intense. Bulls showed strength mid-day, but bears had better endurance. This candle may lead to further weakness unless buyers reclaim 25,063 quickly.
🛡 5 Min Intraday Chart
🥷 Gladiator Strategy Update
ATR: 314.6
IB Range: 178.7 (Medium)
Market Structure: Imbalanced
🎯 Trade Highlights:
🟥 9:20 Short Trigger → No trade (unfavourable R:R, System not Allow)
🟩 11:30 Long Trigger → SL Hit
🟥 14:20 Short Trigger → SL Hit
📉 Total Trades: 2 (Both hit SL)
Tough day for the system — range extremes and sudden reversals ruled the game.
📌 Support & Resistance Levels
📈 Resistance Zones:
• 24,882 ~ 24,895
• 24,920
• 24,980 ~ 25,000
• 25,062 ~ 25,070 (5th rejection!)
• 25,116 ~ 25,128
• 25,180 ~ 25,212
• 25,285 ~ 25,399
📉 Support Zones:
• 24,768 ~ 24,820
• 24,660
• 24,640 ~ 24,625
• 24,590
• 24,530 ~ 24,480
• 24,460
📌 What’s Next?
If 24,704 holds, bulls may attempt a bounce again.
A close above 25,063 would restore bullish sentiment.
But if 24,700 breaks, we may see deeper correction into lower support zones.
💬 Final Thoughts:
"Market will teach you humility every time you think you've figured it out."Today’s sudden rally followed by a deeper fall reminds us how quickly sentiment can shift. Trade with levels, respect zones, and keep adapting — that’s the only constant.
✏️ Disclaimer:
This is just my personal viewpoint. Always consult your financial advisor before taking any action.

Nifty feeling pressure, unable to sustain above 25K levels.Nifty not able to sustain levels above 25K is not a good news. Nifty has to sustain above 25094 level on daily and 25208 on weekly closing for further upward move. Market is not showing confidence due to daily tariff related news coming for global Power house US. So Volatility will remain for a while till everything falls in place.
Right now Nifty is resting near trend line support levels of 24731. If 24731 is broken Bears can drag Nifty towards 24469, 24067 (Mother line Support), 23899 or even 23637 (Father line support). If Nifty can sustain above 25094 then there is a possibility for up move towards 25208 or even 25446 levels. Things are delicately poised right now and proper Bear Vs Bull Tussle is going on.
Shadow of the candle is neutral to negative but any positive news on global front can change the tide in favour of Bulls.
Disclaimer: The above information is provided for educational purpose, analysis and paper trading only. Please don't treat this as a buy or sell recommendation for the stock or index. The Techno-Funda analysis is based on data that is more than 3 months old. Supports and Resistances are determined by historic past peaks and Valley in the chart. Many other indicators and patterns like EMA, RSI, MACD, Volumes, Fibonacci, parallel channel etc. use historic data which is 3 months or older cyclical points. There is no guarantee they will work in future as markets are highly volatile and swings in prices are also due to macro and micro factors based on actions taken by the company as well as region and global events. Equity investment is subject to risks. I or my clients or family members might have positions in the stocks that we mention in our educational posts. We will not be responsible for any Profit or loss that may occur due to any financial decision taken based on any data provided in this message. Do consult your investment advisor before taking any financial decisions. Stop losses should be an important part of any investment in equity.

#NIFTY Intraday Support and Resistance Levels - 27/05/2025Today, Nifty is expected to open flat near the 25000 level. If it sustains above 25000, we may see bullish momentum toward 25150, 25200, and 25250+. This level is a key breakout zone for further upside.
However, if Nifty fails to hold above 25000 and starts trading below the 24950–24900 zone, a short trade setup may trigger with downside targets of 24850, 24800, and 24750.
Further weakness will be confirmed only if Nifty breaks below 24750–24700, possibly extending the downside to 24600 and 24550.

Personal Trade Plan – Nifty50 25100 June Call OptionToday, I entered a long position in the Nifty50 25100 June (Monthly) Call option , securing an average price of ₹469.10 . I plan to accumulate additional lots at lower prices, with a strategy to hold until expiry.
📌 Disclaimer: This is not a trade recommendation. Please conduct independent research and assess risk factors before making any trading decisions.
#nifty50

Nifty Analysis EOD – May 26, 2025 – Monday 🟢 Nifty Analysis EOD – May 26, 2025 – Monday 🔴
Tug of War for 25K between the Bulls and Bears
📈 Nifty Summary:
The week kicked off with a 66-point gap-up, opening at 24,919, and bulls wasted no time pushing toward the much-awaited 25,000 mark, hitting an intraday high of 25,079.20. But the celebration didn’t last long—the move lacked conviction, and what followed was a sharp fall back to the day's low at 24,900.50.
From there, Nifty bounced off 24,910, climbed back to the VWAP zone, and then spent the rest of the session range-bound between 24,950 ~ 25,000, reflecting indecision and consolidation. The index closed the day just above the psychological milestone at 25,001.15, wrapping up a volatile yet directionless session.
🛡 5 Min Chart with levels
🔍 Technical Snapshot:Nifty broke above a trendline but faced resistance near 25,062 ~ 25,070—an important supply zone—and eventually slid back into the previous resistance band of 24,972 ~ 25,000, now acting as a struggle zone.
🕯 Daily Time Frame Chart
🕯 Daily Candle Breakdown
Open: 24,919.35
High: 25,079.20
Low: 24,900.50
Close: 25,001.15
Change: +81.80 (+0.33%)
Candle Structure:
✅ Real Body (Green): 81.80 pts → Mild bullish close
🔼 Upper Wick: 78.05 pts → Buying faded near highs
🔽 Lower Wick: 18.85 pts → Support around 24,900
This candle shows moderate bullish momentum, but the long upper wick tells us the bulls faced strong selling near the top. The structure suggests a "weary bull" candle—a sign of hesitation, not a reversal. Price is trying to move higher, but profit-booking near resistance is slowing the pace.
📌 Key Insight:
The trend remains upward, but momentum is weakening near key resistance.
Above 25,080 = Breakout confirmation
Below 24,900 = Possible consolidation or pause
🛡 5 Min Intraday Chart
🥷 Gladiator Strategy Update
Strategy Parameters
ATR: 314.6
IB Range: 178.7 → Medium IB
Market Structure: Imbalanced
Trade Highlights⚠️
No trades were triggered by the system today
💼 Total Trades: 0
📊 Support & Resistance Levels
🔺 Resistance Zones:•
25,062 ~ 25,070
25,116 ~ 25,128
25,180 ~ 25,212
25,285
25,399
🔻 Support Zones:
24,980 ~ 25,000
24,920
24,882 ~ 24,895
24,768 ~ 24,820
24,660
24,640 ~ 24,625
24,590
24,530 ~ 24,480
24,460
🧠 Final Thoughts:
"Markets don't lie, they whisper truth—if you're quiet enough to listen."The market is clearly respecting resistance zones, and until bulls can decisively close above 25,080, expect more choppy action near highs. Stay patient. Let structure lead your decisions.
✏️ Disclaimer ✏️
This is just my personal viewpoint. Always consult your financial advisor before taking any action.

Nifty Trying to Forge ahead after taking Mother Line Support.Nifty is trying to move upwards after taking Mother line support. However there are strong resistances which Nifty needs to conquer in order to move ahead substantially. These resistances are near 25094 and 25208.
Closing above 25208 will confirm the current trend which can tae Nifty close to 26K with other resistances at 25446, 25649 and 25810. Supports for Nifty currently are near 24820 (Mother line support), 24469, 24356 (Father line support) and 23899.
The direction of arrow is clear for medium term unless the arrow is broken on the down side. Nifty is currently forming a positive higher highs, higher lows pattern which is again a positive sign.
Disclaimer: The above information is provided for educational purpose, analysis and paper trading only. Please don't treat this as a buy or sell recommendation for the stock or index. The Techno-Funda analysis is based on data that is more than 3 months old. Supports and Resistances are determined by historic past peaks and Valley in the chart. Many other indicators and patterns like EMA, RSI, MACD, Volumes, Fibonacci, parallel channel etc. use historic data which is 3 months or older cyclical points. There is no guarantee they will work in future as markets are highly volatile and swings in prices are also due to macro and micro factors based on actions taken by the company as well as region and global events. Equity investment is subject to risks. I or my clients or family members might have positions in the stocks that we mention in our educational posts. We will not be responsible for any Profit or loss that may occur due to any financial decision taken based on any data provided in this message. Do consult your investment advisor before taking any financial decisions. Stop losses should be an important part of any investment in equity.

NIFTYi Observed these Levels based on Price Action and Demand & Supply which is my own Concept "PENDAM CONCEPTS"... Please don't take any trades based on this chart/post... Because this chart is for educational purpose only not for Buy or Sell Recommendation... Thank Q

Next Target for #kalyankjil Is 594-600 KALYAN JEWELLERS Might give us this target till 6th june. as it's showing good volume and price action to fulfill our needs. hope for the best

#NIFTY Intraday Support and Resistance Levels - 26/05/2025Today, Nifty is expected to open with a gap-up near the 24950 level. If it sustains above the 24950–25000 zone, it can lead to bullish momentum with upside targets of 25150, 25200, and 25250+. A breakout above 25000 will act as a strong confirmation for further rally.
However, if Nifty fails to sustain above 24950 and slips below the 24900–24850 zone, a short trade opportunity may emerge with downside targets at 24800 and 24750.
Further weakness will be confirmed only if it breaks below 24700, which may drag the index down to 24600, 24550, and 24500.

Nifty range bound in 24500-25250Nifty range bound in 24500-25250
For confirmed Long entry wait for 25250 to break for targets above 26K.
Any rejection from 25250 must be a short opportunity.
This is our analysis not a BUY or SELL call. Thanks for reading.

NIFTY : Trading levels and plan for 26-May-2025📊 Nifty Trading Plan – 26-May-2025
Timeframe: 15 Min | Reference Spot Price: 24,845
Gap Opening Threshold: 100+ Points
🚀 Gap-Up Opening (Above 24,974) – 100+ Points
If Nifty opens above the Opening Resistance level of 24,974, it enters a critical resistance zone that may trigger two-sided moves. The area between 25,195 – 25,294 is marked as the Profit Booking Zone / Last Intraday Resistance .
🟥 This zone has historically seen supply, and sharp up-moves may get trapped without strength in broader participation.
✅ Plan of Action:
– Avoid initiating long trades immediately post gap-up unless price shows strong bullish candles above 25,195.
– For intraday buying, wait for a clean 15-min candle close above 25,294 with strength in heavyweights.
– Ideal entry would be on a retest of the 25,195–25,294 zone if price holds.
– Reversal patterns (like Shooting Star / Bearish Engulfing) near 25,195 – 25,294 can offer sell-on-rise opportunities toward 24,974, then 24,845.
– Watch for volume confirmation – avoid shorting just because price is high.
🎓 Educational Note: Gap-ups into strong resistance zones require caution. Momentum without volume and market-wide confirmation often leads to failed breakouts. Let structure confirm before jumping in.
📈 Flat Opening (Between 24,790 – 24,974)
This places Nifty inside the No Trade Zone defined between 24,790 – 24,974.
🟧 This range is uncertain – the index may move sideways with choppy price action and lack of conviction from buyers or sellers.
✅ Plan of Action:
– Stay on the sidelines in the first 15–30 mins.
– Only consider long trades if price breaks and sustains above 24,974, then aim for 25,195 – 25,294.
– For short trades, wait for a clean breakdown below 24,790 with a bearish candle close to ride down to 24,684 and then 24,558.
– Risk reward is best outside this zone, not inside. Patience is key.
🎓 Educational Note: Flat openings in mid-range zones often cause emotional trades. Use this time to assess volume trends, sectoral strength, and structure. Most clean entries happen post-10:15 AM.
📉 Gap-Down Opening (Below 24,684) – 100+ Points
A gap-down below 24,684 pushes Nifty near its immediate supports at 24,558 (Last Intraday Support) and 24,250 – 24,190 (Buyer’s Zone).
🟩 This is a sensitive area where smart money may attempt reversals, especially near 24,250 – 24,190.
✅ Plan of Action:
– Watch for reversal signs (Hammer, Bullish Engulfing) around 24,558 and especially in the Buyer’s Support Zone: 24,250 – 24,190.
– If price finds footing and sustains above 24,558, reversal trades can be initiated with a target back to 24,684 – 24,790.
– A strong breakdown below 24,190 would confirm bearishness – in that case, avoid catching falling knives.
– Only go short below 24,190 on breakdown candle with next target open toward swing lows.
🎓 Educational Note: Gap-downs into major demand areas offer some of the best R:R setups—but only if there's evidence of absorption and reversal structure. Never go long just because price is “low”.
🛡️ Options Trading – Risk Management Tips
✅ Use slightly In-the-Money (ITM) options for better delta movement and less time decay.
✅ Avoid trading in No Trade Zones; theta will eat up your premiums.
✅ Follow the 1–2% capital risk rule – don’t over-leverage in anticipation of a breakout.
✅ Always define your stop loss using the underlying spot level, not just option premium.
✅ Book partial profits once price moves in favor and trail SL for the rest.
✅ If you hit 2 stop-losses in a row, take a break and re-assess the trend.
✅ Monitor OI data and sectoral strength—don’t blindly follow index candles.
📌 Summary & Conclusion
🔹 No Trade Zone: 24,790 – 24,974
🔹 Profit Booking / Resistance Zone: 25,195 – 25,294
🔹 Opening Supports: 24,684 & 24,558
🔹 Strong Buyer’s Support: 24,250 – 24,190
📈 For Gap-Ups, avoid early longs into resistance zones unless breakout is confirmed.
📉 For Gap-Downs, prepare for potential reversal from Buyer’s Support Zone.
🕒 In Flat Openings, wait 15–30 mins to avoid whipsaws inside No Trade Zone.
⚖️ Best trades occur outside the No Trade Zone with price + structure + volume alignment.
⚠️ Disclaimer:
I am not a SEBI-registered analyst. This trading plan is purely for educational purposes. Please conduct your own analysis or consult a SEBI-registered advisor before taking trades.

Weekly Market Wrap: Nifty & S&P 500 Outlook The Nifty closed the week at 24,853, down 166 points from the previous week's close. It traded within a range of 25,062 (high) and 24,462 (low) — perfectly aligning with our forecasted zone of 24,450 – 25,600. On the weekly chart, the index formed an inside candle pattern, signaling consolidation.
Positives: Despite the dip, Nifty continues to hold above the critical support level of 23,800, keeping the medium-term bullish structure intact.
Key Levels to Watch for Next Week:
High/Low to mark: 25,116 – 24,378
Breakout above 25,116 can lead to tests of 25,329 and 25,500 (resistance zones).
Breakdown below 24,378 could retest 23,800 and 23,600.
A weekly close below 23,800 could spell trouble for bulls, opening doors for deeper correction towards 22,800 and 22,100.
Trend Analysis:
Monthly Timeframe: Bearish
Daily Timeframe: Turned Bearish
Weekly Timeframe: Still Bullish
Conclusion: Stay cautious below 24,378 — volatility may rise if this level is breached.
S&P 500 Weekly Snapshot:
The S&P 500 ended the week at 5,802, down 156 points. Once again, it faced stiff resistance around the 5,980 mark — a historically significant level where the index began its downward move in March 2025.
Geopolitical Impact: Markets remain jittery amid escalating global trade tensions and Trump’s tariff war, likely keeping volatility high over the next 2–3 weeks.
Key Support Zones:
Immediate support at 5,700
Close below 5,700 may trigger declines to 5,551, 5,458 (key Fibonacci support), and 5,392
Bullish Breakout Scenario:
Sustained close above 6,000 is required to resume bullish momentum
Upside targets: 6,013, 6,082, 6,147 (All-Time High), and potentially 6,225
Final Takeaway:
Both Nifty and S&P 500 are at critical junctures. With technical patterns pointing to mixed signals and geopolitical events adding fuel to volatility, traders should stay alert and focus on key breakout and breakdown levels.
