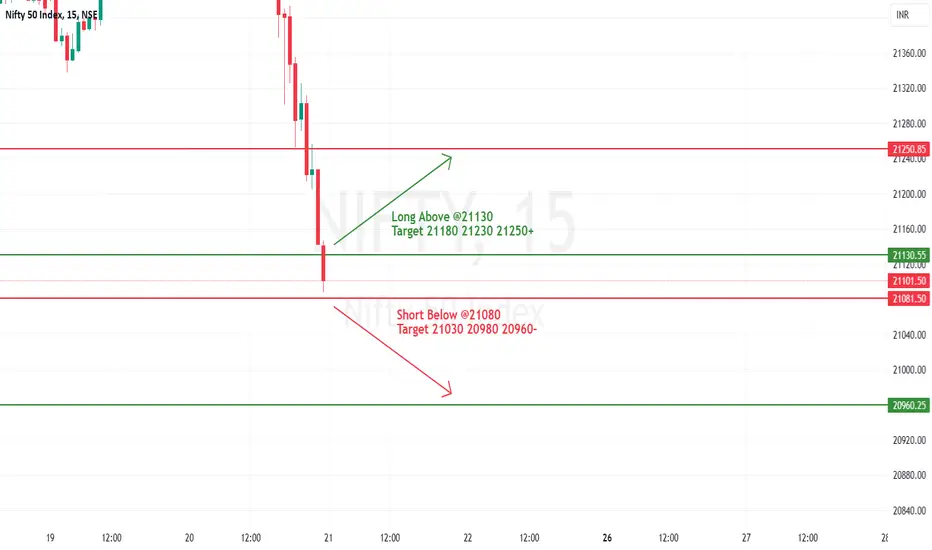
#NIFTY Intraday Support and Resistance Levels -21/12/2023Nifty will be gap up opening in today's session. After opening nifty sustain above 21130 level and then possible upside rally up to 21250 level in today's session. in case nifty trades below 21080 level then the downside target can go up to the 20960 level.
Niftytrendanalysis
#NIFTY Intraday Support and Resistance Levels -20/12/2023Nifty will be gap up opening in today's session. After opening nifty sustain above 21470 level and then possible upside rally up to 21590 level in today's session. in case nifty trades below 21430 level then the downside target can go up to the 21310 level.

#NIFTY Intraday Support and Resistance Levels -19/12/2023Nifty will be FLAT opening in today's session. After opening nifty start trading Below 21400 level and then possible downside rally up to 21280 in today's session. in case nifty trades Above 21430 level then the upside target can go up to the 21550 level.

35% fall incoming for Nifty?This is just my speculation on how Nifty 50 will perform for the next few months.
As per my technical analysis, if Nifty hits ATH (~19000) in the very near time, then there is a chance for our market to go down from there. Either its 20%(~15000) fall or 35% (~12500).
Why?
1. RSI indicates a divergence.
2. Price will be testing the main resistance for the third time after the covid recession.
3. I just need one more confirmation (red triangle) from the nadaraya indicator as shown in the graph at the top level (ATH maybe), to close my holdings.
As of now, I'm in the side of 20% fall. 35% fall may or may not happen.
And one more to add up, the recent fall in US made it to reach the pre-covid level. Whereas our market haven't gone through a healthy correction yet (to the pre-covid level), which is still a worrying factor.
I expect Reliance and Banking stocks will drag the market down to pre-covid levels. Reliance weekly chart is too week for me, keep watching 2600 level.
P.S : Its not based on Fundamentals!

#NIFTY Intraday Support and Resistance Levels -04/12/2023Nifty will be gap up opening in today's session. After opening nifty sustain above 20280 level and then possible upside rally up to 20380 & This rally can extend another 100-120 points if market gives breakout of 20400 level in today's session. in case nifty trades below 20240 level then the downside target can go up to the 20120 level.

Nifty 50 Upside View / Bulish Trangle FormationDate of Analysis 24/11/2023
Market is inside the Traingle forming Bullish Traingle Pattern.
Note :- Recheck The Analysis Have Your Levels Out And Tarde After Brakeout Sustain.

#NIFTY Intraday Support and Resistance Levels - 30/11/2023Nifty will be gap up opening in today's session. After opening nifty sustain above 20120 level and then possible upside rally up to 20240 in today's session. in case nifty trades below 20080 level then the downside target can go up to the 19960 level.

Nifty in Narrow Range
Nifty has been trading in a Narrow 200 points range this whole week.
Holding itself near the resistance is a good sign.
Only 3 trading days to November month expiry!
NSE:NIFTY

#NIFTY Intraday Support and Resistance Levels - 22/11/2023Nifty will be gap up opening in today's session. After opening nifty sustain above 19800 level and then possible upside rally up to 19920 in today's session. in case nifty trades below 19760 level then the downside target can go up to the 19640 level.

#NIFTY Intraday Support and Resistance Levels - 21/11/2023Nifty will be gap up opening in today's session. After opening nifty sustain above 19710 level and then possible upside rally up to 19830 in today's session. in case nifty trades below 19670 level then the downside target can go up to the 19550 level.

Nifty 50 Analysis from COVID-19 LowsNifty 50 Analysis from COVID-19 Lows:
Primary Wave (1): Think of this like a big upward movement on a rollercoaster that started on March 23, 2020, when the Nifty 50 index was at 7511.10. It reached a high point on April 27, 2020, at 9889.05.
Wave (2): After the first exciting ride, there was a dip. This dip ended on May 18, 2020, with the index at 8806.75, which was about halfway down from the highest point of Wave (1).
Wave (3): Then came another exciting ride, but this time it had a lot of ups and downs. Wave (3) ended on October 18, 2021, at a high point of 18604.45.
Wave (4): After the thrill of Wave (3), there was a pause. Wave (4) acted like a rest stop and finished on June 13, 2022.
Wave (5): Now, it's moving up again, but not smoothly. It seems like it's going in a pattern of three steps up and three steps down, like climbing stairs. Currently, it's in the fourth step.
Big Event: The chart suggests that something significant might happen when the index reaches around 20600-20900-21000. It's like saying, "Hey, there might be a big turn or surprise on the rollercoaster around this point." So, it could be a good idea to think about taking your gains or profits when it's near 20.5k.
Just remember, investing in the stock market can be unpredictable, and it's wise to speak with a financial expert or do thorough research before making any investment choices.

#NIFTY Intraday Support and Resistance Levels - 13/11/2023Nifty will be gap up opening in today's session. After opening nifty sustain above 19550 level and then possible upside rally up to 19670 in today's session. in case nifty trades below 19510 level then the downside target can go up to the 19390 level.

#NIFTY Intraday Support and Resistance Levels - 08/11/2023Nifty will be gap up opening in today's session. After opening nifty sustain above 19430 level and then possible upside rally up to 19550 in today's session. in case nifty trades below 19400 level then the downside target can go up to the 19280 level.

NIFTY--Head & Shoulders Pattern ??I am sharing the important levels of Support and Resistance. These levels play a crucial role in trading decisions, as they act as reliable markers of price movements.
------>>Support levels are price points where an asset tends to find buying interest, preventing it from falling further.
---->Resistance levels, on the other hand, are points where selling pressure typically prevents the asset from rising higher.
They serve as key reference points for technical analysis.
Nifty is at important zone of resistance...If price fail to take the support at 19360 levels again and falls below this level, we have a chance of H & S pattern, keep safe before long.

#NIFTY Intraday Support and Resistance Levels - 06/11/2023Nifty will be gap up opening in today's session. After opening nifty sustain above 19250 level and then possible upside rally up to 19350 & This rally can extend another 100-120 points if market gives breakout of 19370 level in today's session. in case nifty trades below 19210 level then the downside target can go up to the 19090 level.

Nifty forming a good channel on hourly chart. Nifty is forming a good channel on hourly chart and things are looking positive for now. Once the Nifty crosses and closes above small resistance of 19145 and 19177 and hold that support. (It is very much possible that Nifty opens gap up above 19177 which will be very good technically, the next targets for spot nifty will be 19230, 19353 and 19425. Support on the lower side are at 19070, 19007 and 18935. Expecting a good closure to the week as things right now look positive. Some big negative news from Middle East can still spoil the party so be cautious.

#NIFTY Intraday Support and Resistance Levels - 27/10/2023Nifty will be gap up opening in today's session. After opening nifty sustain above 18870 level and then possible upside rally up to 19000 in today's session. in case nifty trades below 18840 level then the downside target can go up to the 18720 level.

Nifty analysis and trade plan for Thursday, 25th OctoberNifty analysis and trade plan for tomorrow, Thursday, 25th October | #niftytomorrow #niftyanalysis

#NIFTY Intraday Support and Resistance Levels -25/10/2023Nifty will be gap down opening in today's session. After opening nifty start trading below 19250 level and then possible downside rally up to 19130 in today's session. in case nifty trades above 19300 level then the upside target can go up to the 19420 level.

Nifty Short, Medium and Long Term review-23-Oct-23 to 27-Oct-23Nifty Short, Medium and Long Term review-23-Oct-23 to 27-Oct-23
Nifty closed at 19751 (19655) and touched low & high of 19483 and 19871.
RSI levels and stochastics was near to oversold zone last week end, considering global situation, crude price, Q2 results ( till date) it will test the support level in short term, Q2 results of the balance companies can guide the market.
Banks gave good results except HDFC bank due to merger. Capital Goods and other companies posted average to below average results. As mentioned before ( past 1 month) book 30% profit in the high valued stocks and be ready with cash.
Nifty was holding the inclined trend support provided at 19400 levels last week, same support level was shared for the last three weeks.
Nifty- Short Term (Neutral- Sideways movement with below mentioned support & resistance zone), retaining same as last three weeks.
Strong Support at Fib resistance at 19320/19445
Also there is a support at 19224 (Previous Low)
Resistance at 19840/19990 ( Fibonnoci resistance )
Nifty Medium Term & long Term -
As market in overbought zone there will be a correction.
Resistance at 20221 ( Prev High ) / 20500
Further to review the Q2 results. To review once Nifty reaches target.
Strong Resistance at 18800.

#NIFTY Intraday Support and Resistance Levels - 18/10/2023Nifty will be gap down opening in today's session. After opening nifty start trading below 19790 level and then possible downside rally up to 19670 in today's session. in case nifty trades above 19830 level then the upside target can go up to the 19950 level.

#NIFTY Intraday Support and Resistance Levels - 11/10/2023Nifty will be gap up opening in today's session. After opening nifty sustain above 19720 level and then possible upside rally up to 19840 in today's session. in case nifty trades below 19670 level then the downside target can go up to the 19550 level.

#NIFTY Intraday Support and Resistance Levels - 04/10/2023Nifty will be gap down opening in today's session. After opening nifty start trading below 19500 level and then possible downside rally up to 19380 in today's session. in case nifty trades above 19550 level then the upside target can go up to the 19670 level.
