Nifty Trying to Forge ahead after taking Mother Line Support.Nifty is trying to move upwards after taking Mother line support. However there are strong resistances which Nifty needs to conquer in order to move ahead substantially. These resistances are near 25094 and 25208.
Closing above 25208 will confirm the current trend which can tae Nifty close to 26K with other resistances at 25446, 25649 and 25810. Supports for Nifty currently are near 24820 (Mother line support), 24469, 24356 (Father line support) and 23899.
The direction of arrow is clear for medium term unless the arrow is broken on the down side. Nifty is currently forming a positive higher highs, higher lows pattern which is again a positive sign.
Disclaimer: The above information is provided for educational purpose, analysis and paper trading only. Please don't treat this as a buy or sell recommendation for the stock or index. The Techno-Funda analysis is based on data that is more than 3 months old. Supports and Resistances are determined by historic past peaks and Valley in the chart. Many other indicators and patterns like EMA, RSI, MACD, Volumes, Fibonacci, parallel channel etc. use historic data which is 3 months or older cyclical points. There is no guarantee they will work in future as markets are highly volatile and swings in prices are also due to macro and micro factors based on actions taken by the company as well as region and global events. Equity investment is subject to risks. I or my clients or family members might have positions in the stocks that we mention in our educational posts. We will not be responsible for any Profit or loss that may occur due to any financial decision taken based on any data provided in this message. Do consult your investment advisor before taking any financial decisions. Stop losses should be an important part of any investment in equity.
Niftytrendanalysis

NIFTY : Trading levels and plan for 26-May-2025📊 Nifty Trading Plan – 26-May-2025
Timeframe: 15 Min | Reference Spot Price: 24,845
Gap Opening Threshold: 100+ Points
🚀 Gap-Up Opening (Above 24,974) – 100+ Points
If Nifty opens above the Opening Resistance level of 24,974, it enters a critical resistance zone that may trigger two-sided moves. The area between 25,195 – 25,294 is marked as the Profit Booking Zone / Last Intraday Resistance .
🟥 This zone has historically seen supply, and sharp up-moves may get trapped without strength in broader participation.
✅ Plan of Action:
– Avoid initiating long trades immediately post gap-up unless price shows strong bullish candles above 25,195.
– For intraday buying, wait for a clean 15-min candle close above 25,294 with strength in heavyweights.
– Ideal entry would be on a retest of the 25,195–25,294 zone if price holds.
– Reversal patterns (like Shooting Star / Bearish Engulfing) near 25,195 – 25,294 can offer sell-on-rise opportunities toward 24,974, then 24,845.
– Watch for volume confirmation – avoid shorting just because price is high.
🎓 Educational Note: Gap-ups into strong resistance zones require caution. Momentum without volume and market-wide confirmation often leads to failed breakouts. Let structure confirm before jumping in.
📈 Flat Opening (Between 24,790 – 24,974)
This places Nifty inside the No Trade Zone defined between 24,790 – 24,974.
🟧 This range is uncertain – the index may move sideways with choppy price action and lack of conviction from buyers or sellers.
✅ Plan of Action:
– Stay on the sidelines in the first 15–30 mins.
– Only consider long trades if price breaks and sustains above 24,974, then aim for 25,195 – 25,294.
– For short trades, wait for a clean breakdown below 24,790 with a bearish candle close to ride down to 24,684 and then 24,558.
– Risk reward is best outside this zone, not inside. Patience is key.
🎓 Educational Note: Flat openings in mid-range zones often cause emotional trades. Use this time to assess volume trends, sectoral strength, and structure. Most clean entries happen post-10:15 AM.
📉 Gap-Down Opening (Below 24,684) – 100+ Points
A gap-down below 24,684 pushes Nifty near its immediate supports at 24,558 (Last Intraday Support) and 24,250 – 24,190 (Buyer’s Zone).
🟩 This is a sensitive area where smart money may attempt reversals, especially near 24,250 – 24,190.
✅ Plan of Action:
– Watch for reversal signs (Hammer, Bullish Engulfing) around 24,558 and especially in the Buyer’s Support Zone: 24,250 – 24,190.
– If price finds footing and sustains above 24,558, reversal trades can be initiated with a target back to 24,684 – 24,790.
– A strong breakdown below 24,190 would confirm bearishness – in that case, avoid catching falling knives.
– Only go short below 24,190 on breakdown candle with next target open toward swing lows.
🎓 Educational Note: Gap-downs into major demand areas offer some of the best R:R setups—but only if there's evidence of absorption and reversal structure. Never go long just because price is “low”.
🛡️ Options Trading – Risk Management Tips
✅ Use slightly In-the-Money (ITM) options for better delta movement and less time decay.
✅ Avoid trading in No Trade Zones; theta will eat up your premiums.
✅ Follow the 1–2% capital risk rule – don’t over-leverage in anticipation of a breakout.
✅ Always define your stop loss using the underlying spot level, not just option premium.
✅ Book partial profits once price moves in favor and trail SL for the rest.
✅ If you hit 2 stop-losses in a row, take a break and re-assess the trend.
✅ Monitor OI data and sectoral strength—don’t blindly follow index candles.
📌 Summary & Conclusion
🔹 No Trade Zone: 24,790 – 24,974
🔹 Profit Booking / Resistance Zone: 25,195 – 25,294
🔹 Opening Supports: 24,684 & 24,558
🔹 Strong Buyer’s Support: 24,250 – 24,190
📈 For Gap-Ups, avoid early longs into resistance zones unless breakout is confirmed.
📉 For Gap-Downs, prepare for potential reversal from Buyer’s Support Zone.
🕒 In Flat Openings, wait 15–30 mins to avoid whipsaws inside No Trade Zone.
⚖️ Best trades occur outside the No Trade Zone with price + structure + volume alignment.
⚠️ Disclaimer:
I am not a SEBI-registered analyst. This trading plan is purely for educational purposes. Please conduct your own analysis or consult a SEBI-registered advisor before taking trades.

Weekly Market Wrap: Nifty & S&P 500 Outlook The Nifty closed the week at 24,853, down 166 points from the previous week's close. It traded within a range of 25,062 (high) and 24,462 (low) — perfectly aligning with our forecasted zone of 24,450 – 25,600. On the weekly chart, the index formed an inside candle pattern, signaling consolidation.
Positives: Despite the dip, Nifty continues to hold above the critical support level of 23,800, keeping the medium-term bullish structure intact.
Key Levels to Watch for Next Week:
High/Low to mark: 25,116 – 24,378
Breakout above 25,116 can lead to tests of 25,329 and 25,500 (resistance zones).
Breakdown below 24,378 could retest 23,800 and 23,600.
A weekly close below 23,800 could spell trouble for bulls, opening doors for deeper correction towards 22,800 and 22,100.
Trend Analysis:
Monthly Timeframe: Bearish
Daily Timeframe: Turned Bearish
Weekly Timeframe: Still Bullish
Conclusion: Stay cautious below 24,378 — volatility may rise if this level is breached.
S&P 500 Weekly Snapshot:
The S&P 500 ended the week at 5,802, down 156 points. Once again, it faced stiff resistance around the 5,980 mark — a historically significant level where the index began its downward move in March 2025.
Geopolitical Impact: Markets remain jittery amid escalating global trade tensions and Trump’s tariff war, likely keeping volatility high over the next 2–3 weeks.
Key Support Zones:
Immediate support at 5,700
Close below 5,700 may trigger declines to 5,551, 5,458 (key Fibonacci support), and 5,392
Bullish Breakout Scenario:
Sustained close above 6,000 is required to resume bullish momentum
Upside targets: 6,013, 6,082, 6,147 (All-Time High), and potentially 6,225
Final Takeaway:
Both Nifty and S&P 500 are at critical junctures. With technical patterns pointing to mixed signals and geopolitical events adding fuel to volatility, traders should stay alert and focus on key breakout and breakdown levels.

Nifty May Touch 25,500 and the FALL......NIfty may go to collect pending stoploss and orders resting above 25000 and after trapping bulls and bears together it may fall to level 24700 within a month.

Nifty Analysis EOD – May 22, 2025 – Thursday🟢 Nifty Analysis EOD – May 22, 2025 – Thursday 🔴
Nifty weekly expiry, shocking climax...!
📉 Nifty Summary:
A 66-point gap-down set the stage, followed by a quick 196-point slide within the first 20 minutes, bottoming out at 24,541.60. From here, the index attempted a bounce but faced stiff resistance at the 24,625 ~ 24,640 zone—not once, but twice. This zone flipped polarity and began acting as resistance instead of support.
The third breakdown at 12:45 PM finally breached the day’s low, taking Nifty to a new bottom of 24,509.10, and then further to 24,462.40 by 2:35 PM. But just when it looked like the bulls were done for, the market made a shocking expiry bounce, recovering sharply to close at 24,637, back inside the crucial 24,625 ~ 24,640 zone.
🛡 5 Min Chart with levels
🔄 The day’s character was mostly range-bound post the initial fall, with a 90-point band until the IB Low was broken. The fall lacked strong conviction—signs of both bulls and bears trying to dominate but failing to sustain.
The final hour’s rebound was the real drama—profit booking, fresh buying, and expiry short covering all collided to cause a spike that caught many off-guard. A classic expiry move—some traders hurt, some became heroes.
📌 Yesterday’s Note Reference:
"Below 24640–24625, weakness may extend down towards: → 24500 → 24460."
✅ Market played by the script, touched 24500, and 24460 got hit too.
📉 Is the retracement run finished?
Technically, YES.
A bold call, but unless global headwinds reappear, today’s low must sustain.
If it doesn’t, watch for the 24,330 ~ 24,365 zone as the last guard. Breach that? Gap-fillers may run wild down to 24,160 ~ 24,008.
Not a trade plan—just technical facts. Let's see what the tape reveals next.
🛡 5 Min Intraday Chart
🥷 Gladiator Strategy Update
Strategy Parameters
ATR: 327.22
IB Range: 195.90 → Medium IB
Market Structure: Imbalanced
Trade Highlights
✅ 1st Long Trigger: 12:45 PM – Target Achieved (R:R = 1:1)
💼 Total Trades: 1
🕯 Daily Time Frame Chart
📊 Support & Resistance Levels
🔺 Resistance Zones:
• 24,768 ~ 24,820
• 24,660
• 24,640 ~ 24,625
• 24,882
• 24,920
• 24,980 ~ 25,000
• 25,062 ~ 25,070
🔻 Support Zones:
• 24,590
• 24,530 ~ 24,480
• 24,460
🧠 Final Thoughts
"Markets don’t trap you; your lack of preparation does."
Today was a pure example of expiry surprise—respect the zones, follow the structure, and keep adapting.
✏️ Disclaimer ✏️
This is just my personal viewpoint. Always consult your financial advisor before taking any action.

Nifty Analysis EOD - May 15, 2025 - Thursday🟢 Nifty Analysis EOD - May 15, 2025 - Thursday 🔴
Heart-Throbbing Wild Weekly Expiry by Nifty
📈 Nifty Summary
What a day! In yesterday’s report, we highlighted the potential for breakout on both sides—and Nifty said, “Why choose one? Have both!”
Opening with a modest gap-up of 28 points at 24,694, the index wasted no time and took a sharp dive, breaching the Previous Day Low (PDL) and hitting 24,494. This test of the 24,483–24,528 support zone sparked an immediate V-shaped recovery.
By 10:30 AM, Nifty had reclaimed its mean level, and breaching 24,600 triggered short-covering that pushed it sharply toward PDH, which was taken out in just 10 minutes. A rumored update from Trump on a USA–India tariff deal (unverified but possible catalyst) might have played a role—though, as always, price is the final news.
However, within the next 30 minutes, Nifty wiped out all the gains, only to enter a consolidation phase until 1 PM. Then came the real action—another breakout above PDH with strong short-covering and fresh buying. The rally took Nifty to a fresh weekly high of 25,116, closing near the highs at 25,035.
This wasn’t a regular expiry. This was a thriller.
📊 Intraday Walk
📉 Breach of PDL to form 24,494 low
🧲 V-shaped recovery from 24,500 zone
🚀 24,600 breakout triggers short-covering to PDH
⚡ Spike to PDH wiped out → range-bound for 2 hours
🟢 1 PM breakout → new weekly high 25,116
🔚 Closed at 25,035, a solid 341-point day
🕯 Daily Candle Breakdown
Candle Type: Bullish Marubozu-like Engulfing
Range: ~622 points
Key Observation: Engulfed previous two candles and broke 12th May’s high & close
What it Implies: Strong bullish momentum, signs of sustained short-covering
🎯 Gladiator Strategy Update
Strategy Parameters
ATR: 376.94
IB Range: 212.3 → 📏 Medium IB
Market Structure: ⚖️ Balanced
Trade Highlights
✅ 1st Long Trigger: 13:05
🎯 Target Achieved: 1:4 Risk-Reward
💼 Total Trades: 1
📍 Support & Resistance Levels
🟩 Resistance Zones:
25,116 ~ 25,128
25,180 ~ 25,212
25,285
25,399
25,485 ~ 25,511
🟥 Support Zones:
25,000 ~ 24,980
24,882
24,800 ~ 24,768
24,730
24,660
24,590
24,530 ~ 24,480
🧠 Final Thoughts
The Nested Inside Bar setup we spoke of yesterday? It delivered. Clean breakdown of PDL without triggering trade saved us from a trap, while the PDH breakout delivered a 1:4 reward—textbook price action setup. With a strong bullish engulfing on the daily, expect continued strength with dips being bought.
“When the market offers clarity, act. When it offers confusion, observe.” — Stay nimble.
✏️ Disclaimer
This is just my personal viewpoint. Always consult your financial advisor before taking any action.

Nifty Futures Intraday Analysis for May 13, 2025According to our Market Timing indicator, it looks bearish trend for the day. The Support levels are at 24788 and 24395 while Resistance is at 25096.
I am waiting for Sell Signal confirmation from MastersCycle indicator with a proper stop-loss to take my short position.
This is only my view. Traders are suggested to follow own technical analysis and trade with proper risk management.

Weekly Market Wrap: Nifty Dips 340 Points Amid Global TensionsThis week, the Nifty 50 ended on a cautious note, closing at 24,008, down 340 points from the previous week's close. The index traded within a tight range, hitting a high of 24,526 and a low of 23,935—well within my anticipated levels of 24,900 to 23,800.
Silver Lining: Despite ongoing geopolitical tensions and negative news flow—including war-related developments—bulls managed to defend the critical psychological support of 24,000. That’s a sign of resilience in an otherwise shaky environment.
What’s Ahead?
For the upcoming week, expect high volatility. I see Nifty moving between 24,600 and 23,200. A weekly close below 23,800 could spell trouble for bulls, potentially opening the door for a drop toward major support zones at 23,200 and 23,000.
Technical Outlook:
Monthly & Daily Timeframes: Weak
Weekly Timeframe: Still bullish
So, while long-term charts show vulnerability, the weekly trend gives hope. I'm staying cautiously bullish—but will only turn aggressive once the monthly chart flips positive. Until then, it’s time to stay vigilant, not impulsive.
Global Cues: S&P 500 Holding Up Amid Uncertainty
The S&P 500 closed at 5,659, just 30 points down from the previous week, forming a doji candle—a clear sign of indecision. As long as the index holds above 5,532, there's no major cause for concern.
Bearish Trigger: Below 5,532, expect downside pressure toward 5,458 and 5,392, which could spill over into already fragile emerging markets like India.
Bullish Breakout: Above 5,770, bulls gain momentum, with potential upside targets of 5,821, 5,850, and 5,900. A rally here could bring relief to global equities, including Indian markets.

NIFTY Wait for a breakout: When the price crosses above the trendline, it could be a bullish signal.
Monitor for a breakdown: If the price breaks below the trendline, it could be a bearish signal.
If you find this helpful and want more FREE forecasts in TradingView, Hit the 'BOOST' button
Drop some feedback in the comments below! (e.g., What did you find most useful?
How can we improve?)
Your support is appreciated!
Now, it's your turn!
Be sure to leave a comment; let us know how you see this opportunity and forecast.
Have a successful week
DISCLAIMER: I am NOT a SEBI registered advisor or a financial adviser. All the views are for educational purpose only

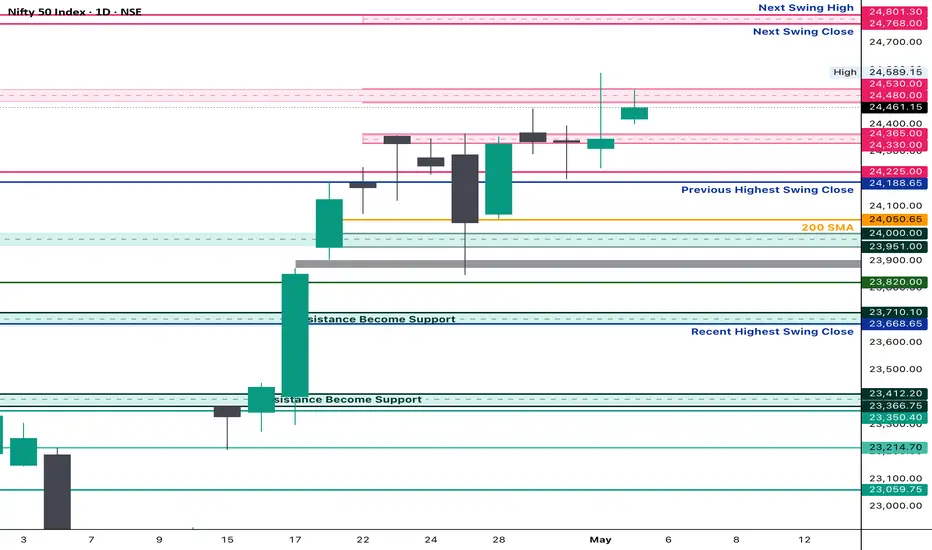
Nifty EOD Analysis – May 3, 2025 Monday🟢 Nifty EOD Analysis – May 3, 2025 Monday🔴
A positive open... but no follow-through. Still stuck in consolidation.
📊 Nifty Summary
Nifty opened with a gap up of 72 points at 24,420, marking the first open above 24,365 in the last 7 sessions — a positive sign. However, the enthusiasm lacked momentum. Price struggled to cross the resistance at 24,526, and the index drifted back toward the mean, trading the entire day between the initial balance (IB) range and hovering around VWAP.
🔹 Intraday Movement: Just 125 points, the smallest in the last 12 sessions — a clear sign of contraction.
🔹 Closing: 24461 closing is the first closing above 24365 in the last 7 sessions.
🔹 Structure: Daily candle formed an Inside Bar, signaling potential energy buildup.
📌 Strategy Forward: Stay alert for an expansion move from this coil — contraction often precedes sharp action.
📌 5 Min Time FrameChart
📌 Daily Time FrameChart
🕯️ Daily Time Frame Chart & Candle Breakdown
🔍 Today’s Candle Type: Spinning Top with a long upper wick
Candle Definition:
A Spinning Top reflects market indecision — both bulls and bears attempted moves, but neither gained dominance. A long upper wick with a narrow body often signals failed bullish momentum or fading enthusiasm.
📌 Today’s OHLC:
Open: 24,419.50
High: 24,526.40
Low: 24,400.65
Close: 24,461.15
Change: +114.45 (+0.47%)
🧱 Candle Structure:
🔹 Real Body:
🟢 Green candle with a modest body →
24,461.15 – 24,419.50 = 41.65 pts
🔹 Upper Wick:
24,526.40 – 24,461.15 = 65.25 pts
🔹 Lower Wick:
24,419.50 – 24,400.65 = 18.85 pts
📖 Candle’s Interpretation:
Despite a strong open and attempt to push higher, the resistance at 24,526 capped the move. The long upper wick shows that buyers lacked follow-through strength, and the close back near the middle of the range indicates a market still stuck in balance.
📉 The Inside Bar + Narrow Range combo is a potential signal for volatility ahead — traders should watch closely for a breakout from this range.
⚔️ Gladiator Strategy Update
📊 Strategy Parameters:
ATR: 303.46
IB Range: 110.65 pts
IB Category: Medium IB
Market Structure: Balanced
📌 Trade Highlights:
Trade Count: 0
❌ No Trigger generated by the system — a no-trade day.
🧠 Note: In contraction phases, it’s common to get fewer setups. Patience is key.
🔮 What’s Next?
Markets are coiling tightly, and an expansion move is likely around the corner. As long as price holds above the 24,330–24,360 band, bulls have hope — but conviction is needed above 24,540.
🧱 Support & Resistance Levels
🔺 Resistance Zones:
24,480 ~ 24,540 (Includes psychological level: 24,500)
24,590 (PDH – Immediate hurdle)
24,800
🔻 Support Zones:
24,400 (CDL)
24,330 ~ 24,360
24,190 ~ 24,225 (Immediate Support)
24,120
24,050
24,000 ~ 23,950
23,820
23,710 ~ 23,660
23,500
23,410 ~ 23,370
23,215
✏️ Disclaimer
This is just my personal viewpoint. Always consult your financial advisor before taking any action.
CreditAccess Grameen (CREDITACC) – Bullish Breakout SetupStock Name: CreditAccess Grameen (CREDITACC)
Trend : Bullish
Timeframe : Daily
Trade Setup
Entry Point: ₹1,163
Stop Loss: ₹1,089 (Risk: ~6.4% from entry)
Targets:
Target 1: ₹1,205.70
Target 2: ₹1,248.75
Target 3: ₹1,294.15
Target 4: ₹1,337.15
Final Target: ₹1,385
Technical Rationale for Breakout
Bullish Flag Pattern Breakout: Price has broken out of a Bullish Flag pattern, signaling a continuation of the prior uptrend.
200 DEMA Support: The stock crossed above and retested the 200-day Exponential Moving Average (DEMA), now acting as strong support.
RSI Strength:
Daily RSI: Above 60 (indicating bullish momentum).
Weekly RSI: Also above 60 (confirms broader bullish bias).
Volume Confirmation:
Breakout day volume: 4.0M (extremely high vs. previous day’s 406.05K), validating the breakout’s strength.
Key Observations
The combination of a Bullish Flag breakout, volume surge, and RSI strength suggests a high-probability trade.
The 200 DEMA support adds confluence to the bullish structure.
Risk Management Tips
Strictly adhere to the stop loss.
Trail stops as price progresses toward targets.
Consider partial profit booking at each target level.
Disclaimer
This analysis is for educational and informational purposes only and should not be construed as financial or investment advice. Trading in equities carries inherent risks, including the potential loss of capital. Always conduct your own due diligence and consult a certified financial advisor before making any investment decisions. Past performance is not indicative of future results. The author assumes no responsibility for financial losses or gains based on this post. Volume, price, and indicator data are subject to market volatility and may change rapidly.
Let me know your thoughts in the comments! Are you watching this setup? 📈🔍


Nifty EOD Analysis – May 2, 2025 - Friday🟢 Nifty EOD Analysis – May 2, 2025 (Friday)🔴
Another day... tug-of-war between buyers and sellers
📊 Nifty Summary
Another one-day tug-of-war between buyers and sellers. As usual, morning momentum — driven by buyers and short-covering — pushed the index into a bullish zone. However, profit booking and seller dominance dragged it back down, ultimately parking Nifty again in the 24,330 ~ 24,365 zone — now the 4th straight session closing within this narrow range.
Nifty opened on a bullish note at 24,311 and launched into a swift rally, breaching multiple resistance zones and clocking a new high at 24,589 within the first hour. However, the enthusiasm faded quickly. Sellers stepped in aggressively, and all the major support levels crumbled one by one. What started as a breakout turned into a breakdown.
The index drifted lower and spent the rest of the session stuck in a narrow zone of 24,330–24,365 — now for the fourth session in a row! The close at 24,346 reflects indecision and caution ahead of next week’s events.
📌 5 Min Time FrameChart
🕔 Intraday 5-Min Chart (Price Walkthrough)
🔹 Opened at 24,311 and rallied sharply to 24,589 — breaching multiple resistance zones.
🔹 Sellers took control and dragged the index back below 24,400.
🔹 Breakdown through all major support levels including PDH, CPR, and CDL.
🔹 Post-lunch session remained directionless between 24,330–24,365.
🔹 Fourth consecutive close inside this compression zone.
📌 75 Min Time FrameChart
⏱️ Intraday 75-Min Time Frame Chart
📐 First two candles formed a bullish setup, but the third candle completely reversed the gains, forming an Inside Bar breakdown trap. The remaining candles failed to break out of the previous range, with momentum fading.
⚠️ A breakout (or breakdown) from this compression is now imminent — keep your eyes on the next session for direction.
📌 Daily Time FrameChart
🕯️ Daily Time Frame Chart & Candle Breakdown
📈 Today’s Candle Type: Spinning Top with long upper wick
🟢 Open: 24,311.90
🔺 High: 24,589.15
🔻 Low: 24,238.50
🔚 Close: 24,346.70
📊 Change: +12.50 (+0.05%)
🧠 Know Your Candle:
A Spinning Top reflects market indecision — the long wicks show strong attempts by both bulls and bears, but neither managed to dominate.
Upper Shadow: 242.45 pts → Strong selling from highs
Lower Shadow: 73.40 pts → Mild buying near lows
Real Body: 34.80 pts → Modest positive close
🔍 Interpretation:
Despite an early morning breakout, the close back in the congestion zone signals a lack of directional strength. The long upper wick reflects failure to hold higher ground — bias slightly tilting bearish unless this zone is broken with conviction.
⚔️ Gladiator Strategy Update
📌 Strategy Parameters:
ATR: 317.21
IB Range: 270.30
IB Category: Medium IB
Market Structure: Balanced
📊 Trade Summary:
✅ 1st Trade (Long): Triggered at 9:25 – Target Achieved (1:2 RR)
❌ 2nd Trade (Short): Triggered at 12:25 – SL Hit
🔮 What’s Next?
The bias remains neutral to slightly bearish. Despite a strong upside in the first hour, the repeated failure to sustain above 24,400 and four closes within 24,330–24,365 suggest exhaustion.
A breakout from this tight coil should give a clear move — wait for confirmation.
📌 Support & Resistance Levels
🔺 Resistance:
24,330 ~ 24,360 (Immediate hurdle)
24,400 (PDH)
24,457
24,480 ~ 24,540
24,589 (CDH)
24760 ~ 24,800
🔻 Support:
24,190 ~ 24,225
24,120
24,050
24,000 ~ 23,950
23,820
23,710 ~ 23,660
23,500
23,410 ~ 23,370
23,215
💬 Final Thoughts
“Range traps continue to fool both sides — momentum without conviction is just noise.”
Watch the compression zone — a genuine breakout or closing above 24,365 or breakdown below 24,225 could bring clarity. Until then, trade light and watch levels.
✏️ Disclaimer
This is just my personal viewpoint. Always consult your financial advisor before taking any action.

NIFTY Index View - May 02, 2025The index has been moving sideways since last few days this week but has moved upwards with fine volume as we had analyzed on Tuesday (April 29th).
The index still looks strong enough to continue the trend further upwards.

#Nifty 30th April levels checkout is levels #Nifty 30th April levels checkout special my levels
100 percent working levels and giving weekly levels also
check and tell everyone
NIFTY: Impulse formationNifty is rising in an impulsive manner of which 4th wave is already concluded at 23847 zone and currently trading under wave-5. This shall take the index towards 24875 zone where wave-5 becomes equal to wave-1.

Nifty Analysis EOD - 28th April 2025🟢 Nifty Analysis EOD - 28th April 2025 🔴
Nifty almost retraced 25th April’s fall — Back to Square One... What Next?
📈 Market Summary
Nifty almost retraced 25th April’s fall — Back to Square One... What Next?
As highlighted in previous sessions, the 24,330 ~ 24,360 zone once again proved to be a crucial resistance. Today, along with the past three sessions, we observed Nifty struggling to breach this wall — a fact clearly visible on the 75-minute time frame chart.
Now the big question:
➡️ Tomorrow, can Nifty decisively breach 24,365 and sprint towards 24,500?
Well, time will answer, but we must stay prepared for moves on either side.
Intraday Walk:
Nifty opened with a gap-up above the psychological 24,000 level at 24,070.
With a slow yet steady bullish pace, it hit a high of 24,355.
After touching this critical resistance, it spent almost 2 hours consolidating in the same zone.
Finally, it closed at 24,312, defending most of its intraday gains — a strong show of resilience by the bulls.
🕯 Daily Candle Structure
Today's Candle:
🟢 Strong Bullish Candle (Almost a Marubozu)
Open: 24,070.25
High: 24,355.10
Low: 24,054.05
Close: 24,328.50
Change: +289.15 points (+1.20%)
Key Observations:
The session opened slightly above yesterday’s close and dipped just marginally.
Buyers took charge from the very beginning, consistently pushing the index higher.
Close near the day's high signals robust bullish momentum.
The candle has a tiny lower shadow and minimal upper shadow, indicating persistent buying throughout the day.
What It Implies:
Clear bull dominance.
Willingness among buyers to step up even at higher levels.
If external cues remain supportive, momentum could continue into the next session.
🛡 Gladiator Strategy Update
ATR: 344.11
IB Range: 182.1 (Medium IB)
Market Structure: Balanced
Trade Highlights:
1st Trade: Long Entry triggered at 10:05 AM — SL Hit
2nd Trade: Long Entry triggered at 11:25 AM — 1:2 Target Achieved
Additional Trade (Discretionary Contra): Short Entry at 14:15 PM — 1:1.4 Target Achieved
🧾 Index Performance Snapshot
Nifty 50: +289 Points (+1.20%)
Bank Nifty: +768 Points (+1.41%)
Nifty 500: +254 Points (+1.16%)
Midcap: +870 Points (+1.62%)
Smallcap: +130 Points (+0.78%)
📍 Key Levels to Watch
Resistance Zones:
🔹 24,330 ~ 24,360 (Immediate hurdle)
🔹 24,480 ~ 24,540 (24,500 psychological level inside this zone)
🔹 24,800
Support Zones:
🔹 24,190 ~ 24,225 (Immediate support)
🔹 24,120
🔹 24,050
🔹 24,000 ~ 23,950
🔹 23,820
🔹 23,710 ~ 23,660
🔹 23,500
🔹 23,410 ~ 23,370
🔹 23,215
🎯 Final Thoughts
"Structure is key. When levels work, respect them. When they break, adapt."
The current structure indicates bulls have made a strong comeback, but remember — 24,330 ~ 24,360 remains the battleground. Only a decisive breakout above can ignite a rally towards 24,500+. Otherwise, we stay watchful for possible reversals.
Stay sharp, stay prepared!
✏️ Disclaimer ✏️
This is just my personal viewpoint. Always consult your financial advisor before taking any action.

SUN PHARMA | Inverted Head & Shoulders BreakoutSun Pharma has completed an Inverted Head and Shoulders pattern on the daily chart, signaling a potential bullish reversal.
📈 Entry: Buy above ₹1800 (breakout confirmation)
📉 Stop Loss: ₹1722 (below right shoulder support)
🎯 Targets (based on Fibonacci extensions & previous resistance zones):
• ₹1837.30
• ₹1875.35
• ₹1914.20
• ₹1953.90
• ₹1994.35
• ₹2034.55
The neckline breakout has occurred with decent volume, reinforcing the validity of the setup. As always, risk management is key — trailing stop loss recommended as price moves in favor.
💡 Disclaimer: This is for educational purposes only. Do your own research before making any trading decisions.

Nifty Spot Daily Trend Analysis from April 25, 2025Technical Outlook:
Nifty Spot is approaching a potential resistance near the Gann 720° level at 24,539. A minor correction appears likely, and we are currently awaiting short signal confirmation from one of our proprietary indicators. Should a decline occur, the index may find support around the Sine Wave level of 23,398. A break below this level could suggest a continuation of the bearish momentum.
At present, most indicators are still trending upwards. However, the bar formations on the chart hint at a possible reversal. Once the MastersSignal confirms a short setup, we will reassess confluence around the Gann 720° value to strengthen conviction.
Disclaimer: This is my personal technical view. Traders should conduct their own analysis and implement strict risk management before initiating any trades.

Nifty--Demand Zone and Liquidity @23400 Nifty index is broken the strong resistance at 23800 levels and taken the liquidity at 24220 levels...
now price action is sideways or trading in a range bound market.
expecting some pullback for further continuation....
wait for buyers exhaustion before short...
we have a clear demand zone at 23400 levels...
when price confirms the bullishness here, after the liquidity grab below the demand will observe a strong up move again...
there are bullish gaps @22800 levels...price has to give pullback for further upside move...
the above one is a clear buying plan for the targets of 24800 and 25200 liquidity.
--->>still we have no sign of bearishness is seen in Nifty.

Decoding NIFTYDear Traders,
I hope this message finds you well in your trading endeavours and personal pursuits. I am excited to share a compelling opportunity with you through a new NIFTY analysis that sheds light on the continuation of the market shift.
Preliminary Analysis Overview:
The downtrend from all-time highs has reached approximately 65% of its progression.
The recent upward surge is somewhat concerning due to concerns about a new trend or a correction within a correction in a larger degree (downtrend).
Let us discuss the key points to distinguish between these two scenarios:
The second leg of the downtrend is experiencing a correction, having completed approximately 89/90 days (which reinforces the interim trend’s completion).
The current correction is progressing rapidly, exhibiting limited sub-waves, which is typically not a characteristic of a motive wave (especially at the beginning of a trend).
The accompanying chart illustrates this point.
Let us elucidate the reasons behind this assertion:
Reason I:
As a staunch believer and ardent follower of Master WDG , the significance of time cannot be disregarded.
The primary downtrend commenced on September 27, 2024, and is poised to encounter a pivotal juncture, namely 180 days from its commencement on March 25, 2025 (Tuesday). This date also coincides with a cross-over with the Fibonacci value of 21 from March 4, 2025, where the interim correction commenced (21,964.60).
The 180D is a component of both the tetragram and the hexagram, and it also represents the midway point of a complete circle (360).
There is also another weird correlation, 4th MAR’25 & 25th MAR’25 both falls on Tuesday marking initiation & termination, the same day.
Reason II:
The geometric patterns of preceding and ongoing movements further support this analysis.
Analyzed both on a daily and weekly basis. The correction responded favorably to both Fibonacci retracements and trendlines. Upcoming resistance levels include:
RI: 23,590~23,600
RII:23,653 (23.6% of the downtrend)
RIII: 23,807
The previous support level is acting as a crucial resistance.
I also observe that there will not be a positive close in 3M charts.
Reference:
Important Dates to Remember:
As suggested, March 25, 2025, marks a significant juncture in the overall trend.
This is pure technical based analysis & does not involve any economic data releases other factors.
** Final Verdict: **
The market is anticipated to conclude its final leg of the downtrend, commencing from this Tuesday. However, the duration of this leg can range from 1 to 2 months.
I have identified several crucial dates for monitoring the upcoming trend. Stay informed!
**Strategy:**
Given the prevailing market conditions, adopting a bearish stance appears prudent.
Any sell positions executed after 23,550 will yield positive returns.
While it may seem counterintuitive to deviate from the prevailing trend, I am merely adhering to the established rules (without expressing any personal sentiment). However, it is inherently risky. Therefore, it is imperative to implement robust risk management strategies during such high-risk trades that are significantly influencing the market.
Additionally, please exercise caution regarding option buying. The low volatility environment is concerning, but it is anticipated to normalize as the downtrend progresses.
Fellow Traders,
The creation of this valuable analytical resource has required countless hours of dedication and effort. If you find it useful, I humbly request your support by boosting the idea and following me (updates will be provided via this post, new posts, and through minds). Your comments and thoughts on this idea are highly valued, and I am committed to engaging with each one personally.
Thank you for investing your time in reading this article.
Wishing you profitable and fulfilling trading endeavors!
Disclaimer:
Before concluding, I must emphasize that the insights shared are based on my analysis. It is crucial for you to conduct your own research and, if necessary, consult with a financial advisor before making any trading decisions. The dynamic nature of financial markets necessitates that your strategies align with your financial objectives and risk tolerance.

Nifty Closes 1000 Points Higher – Will It Catch Up with BNFIn a strong move, Nifty 50 surged by 1000 points to close at 23,851, compared to last week’s close. The index made a weekly high of 23,872 and a low of 23,207. As highlighted in last week's analysis, a breakout above 23,400 could push Nifty toward 23,900 — a target it missed by just 23 points.
However, an intriguing divergence has emerged between Nifty and Bank Nifty. While Bank Nifty has scaled a new all-time high, Nifty still trades significantly below its previous all-time high of 26,277. This sets the stage for an interesting dynamic: Will Nifty rally to close the gap, or will Bank Nifty face a correction?
What to Expect Next Week?
For the upcoming week, Nifty is expected to trade in a range between 23,200 and 24,414. Despite the bullish signals on the daily and weekly timeframes, the monthly chart remains weak, indicating that volatility is likely to persist until a broader trend confirmation.
S&P 500 Outlook: Bounce or Breakdown?
The S&P 500 index saw a mild pullback, closing around 80 points lower from the previous week’s close of 5,363. Our “sell on rise” strategy mentioned last week worked well, as the index dipped post-rally.
Now, things get technically interesting. On the weekly chart, the S&P 500 is forming a potential bullish W pattern and an inside bar. A breakout above the previous week's high of 5,481 could trigger upward targets of 5,551, 5,637, and 5,679.
However, on the downside, a break below 5,115 would reintroduce bearish pressure, which could have negative ripple effects across global markets.
Key Market Takeaways:
Nifty 50: Strong rally, but still below ATH. Watch 23,200–24,414 range next week.
Bank Nifty: At ATH, diverging from Nifty – crucial to monitor.
S&P 500: At a technical crossroads – potential for breakout or breakdown

Nifty Futures intraday analysis for April 17, 2025As explained yesterday, I foresee a bearish trend and the support1 zone at 23358 and Support 2 is at 23313. A breakout below 23313 will bring the Nifty Futures down to 23237. Our Market Timing indicator is in line to our analysis.
This is just my view for the day. Traders must use their own technical study before entering into trades. Stop-Loss is a must for every trade.
