NIFTY - Trading Levels and Plan for 06-Feb-2025📌 NIFTY TRADING PLAN – 06-Feb-2025
🔹 Previous Close: 23,685.10
🔹 Important Zones Identified:
🟥 Sharp Profit Booking Zone: 24,065 - 24,154🟥 Opening Resistance: 23,848🟧 Opening Support / Resistance: 23,683 - 23,658🟩 Last Intraday Support: 23,567🟢 Buyer's Support: 23,374 - 23,345
📈 Scenario 1: Gap-Up Opening (Above 100+ Points)
If NIFTY opens with a strong gap-up above 23,785, it will move toward the Opening Resistance (23,848) and may attempt to test the Profit Booking Zone (24,065 - 24,154).
🔹 Bullish Strategy:
If NIFTY sustains above 23,848, expect a continuation towards 24,065 - 24,154.
An ideal entry can be on a pullback towards 23,848, with a stop-loss below 23,750.
🔻 Bearish Reversal Plan:
If NIFTY shows rejection around 24,065 - 24,154, a short trade can be initiated.
Target for shorts: 23,848 - 23,685.
Stop-loss for short trades: Above 24,200.
📝 Pro Tip: If NIFTY opens directly in the Profit Booking Zone, avoid aggressive long positions. Wait for a breakout or a reversal setup.
📊 Scenario 2: Flat Opening (Between 23,683 - 23,658)
A flat opening means NIFTY is near the Opening Support / Resistance Zone (23,683 - 23,658). Patience is required to confirm the direction.
🔹 Bullish Plan:
If NIFTY breaks above 23,685 with strong volume, a long trade can be considered.
Targets: 23,743 - 23,848.
Stop-loss: Below 23,650.
🔻 Bearish Breakdown:
If NIFTY breaks below 23,658, expect a decline towards 23,567.
Short trades can be initiated with a stop-loss above 23,700.
📝 Pro Tip: Flat openings often result in choppy movement for the first 15-30 minutes. Let the market establish direction before entering trades.
📉 Scenario 3: Gap-Down Opening (Below 23,567)
If NIFTY opens below 23,567, it enters the Last Intraday Support Zone and may attempt to test the Buyer's Support (23,374 - 23,345).
🔹 Buying Opportunity:
A strong bullish reversal from 23,374 - 23,345 can provide a long opportunity.
Target: 23,567 - 23,685.
Stop-loss: Below 23,300.
🔻 Further Breakdown Plan:
If 23,345 is broken, expect further downside towards 23,200.
Short trades can be initiated with SL above 23,400.
📝 Pro Tip: If NIFTY gaps down but quickly recovers above 23,567, it could be a bear trap—watch for bullish confirmations.
⚠️ Risk Management & Options Trading Tips
✔ For Option Buyers: Select ATM (At-the-Money) strikes to avoid time decay. Enter only when price action confirms the trade.
✔ For Option Sellers: If IV (Implied Volatility) is high, consider selling OTM (Out-of-the-Money) options near key resistance/support levels.
✔ Always use SL: Protect capital! A good Risk-to-Reward (R:R) ratio is essential for long-term success.
✔ Avoid Overtrading: Stick to planned setups—don’t force trades.
📌 Summary & Conclusion
🚀 Bullish above: 23,685 (Target 23,848+)📉 Bearish below: 23,658 (Target 23,567 - 23,345)⚠️ Watch Key Zones: No Trade Zone & Profit Booking Area📊 Expect Volatility: Let the first 15-30 minutes settle before aggressive trades.
⚠️ Disclaimer: I am not a SEBI-registered analyst. This analysis is for educational purposes only. Always do your own research before taking any trades. 📢📊
Niftytrendanalysis

NIFTY - Trading levels and Plan for 05-Feb-2025🔹 NIFTY TRADING PLAN – 05-FEB-2025 🔹
📍 Previous Close: 23,707.70
📍 Key Levels to Watch:
🔸 Resistance Zone: 23,743 - 23,845
🔹 Opening Support Zone: 23,591 - 23,644
🟢 Last Intraday Support: 23,491
🟩 Buyers’ Strong Support: 23,345 - 23,388
🎯 Profit Booking Zone: 24,067 - 24,155
🔵 POSSIBLE OPENING SCENARIOS & TRADING STRATEGY 🔵
📈 Gap Up Opening (100+ Points Above 23,807) – Bullish to Cautious Approach
📌 If Nifty opens with a gap-up above 23,807+ , traders should wait for initial price action.
📌 A sustained move above 23,845 can trigger bullish momentum towards 24,067 - 24,155 (Profit Booking Zone).
📌 If Nifty struggles near 23,845 , expect sideways movement or a potential reversal to test 23,743 - 23,707 .
📌 Trade Setup:
✅ Buy on retracement if 23,743 acts as support after a pullback.
🚨 Avoid aggressive buying near resistance without confirmation.
↔️↔️↔️
📊 Flat Opening (Between 23,683 - 23,743) – Key Zone for Decision Making
📌 A flat opening within 23,683 - 23,743 keeps the market in a neutral-to-bullish zone.
📌 If Nifty holds above 23,707 , we can see a push towards 23,845 .
📌 Failure to hold 23,707 might bring weakness towards 23,644 - 23,591 (Opening Support) .
📌 Trade Setup:
✅ If Nifty stays above 23,707 for 15-30 minutes, a breakout trade towards 23,845 is possible.
🚨 If it breaks below 23,644, avoid longs and wait for a deeper support test.
↔️↔️↔️
📉 Gap Down Opening (100+ Points Below 23,607) – Caution Required
📌 A gap-down below 23,607 will bring pressure on support levels.
📌 23,591 - 23,491 is a key demand zone; a strong bounce from here can offer buying opportunities.
📌 If selling continues and Nifty breaks below 23,491 , the next major support is 23,345 - 23,388 .
📌 Trade Setup:
✅ Look for reversal signs near 23,491 - 23,345 before entering long trades.
🚨 If Nifty breaks and sustains below 23,345, expect further downside.
⚠️ RISK MANAGEMENT & OPTIONS TRADING TIPS ⚠️
🔹 Use strict stop-losses based on an hourly close.
🔹 Avoid chasing trades at extreme levels; wait for pullbacks.
🔹 For options trading, consider ATM/ITM contracts for better liquidity.
🔹 Time decay will impact weekly options—exit early if momentum slows.
🔹 Hedge positions if volatility spikes unexpectedly.
📌 SUMMARY & CONCLUSION 📌
✅ Bullish Bias above 23,743 targeting 23,845 - 24,067.
❌ Bearish Break below 23,591 may push towards 23,491 - 23,345.
📊 Key Zone: 23,707 - 23,743—market reaction here will decide the trend.
📌 Wait for confirmation at crucial levels before entering trades!
⚠️ DISCLAIMER ⚠️
🔹 I am not a SEBI-registered analyst. This trading plan is for educational purposes only.
🔹 Please do your own research or consult with a financial advisor before making trading decisions.

NIFTY : Trading levels and Plan for 04-Feb-2025📌 NIFTY Trading Plan for 04-Feb-2025
📍 Key Levels:
Resistance for Profit Booking: 23,672
Resistance Zone: 23,544
No Trade Zone (Opening Support/Resistance Zone): 23,345 - 23,422
Opening Support: 23,256
Last Intraday Support: 23,178 - 23,202
Buyer's Support Zone: 22,950 - 22,990
🚀 If NIFTY Opens with a Gap-Up (100+ Points)
A gap-up opening near 23,500+ means price will be closer to the resistance zone. In this case:
If NIFTY faces rejection near 23,544, look for a shorting opportunity with a target of 23,345-23,422.
A strong breakout above 23,544 with good momentum and volume can push NIFTY towards 23,672 (profit booking zone).
If NIFTY consolidates around 23,500 and holds, look for buying opportunities after a retest with a stop-loss below 23,422.
📌 Pro Tip: If you are trading options, watch for IV (Implied Volatility) spikes. Avoid buying options at the open when IV is high. Wait for a pullback or confirmation before entering.
📊 If NIFTY Opens Flat (± 30 Points)
A flat opening means price will likely be inside the No Trade Zone (23,345-23,422). This zone can act as both support and resistance.
Avoid aggressive trades in this zone and wait for a clear direction.
A breakout above 23,422 can push NIFTY towards 23,544.
A breakdown below 23,345 can lead to 23,256 first and then towards 23,178-23,202.
📌 Pro Tip: When trading inside a range, avoid taking large positions. Instead, use Iron Condors or Credit Spreads in options for range-bound profits.
📉 If NIFTY Opens with a Gap-Down (100+ Points)
A gap-down near 23,178 - 23,202 can bring initial buying support. However, if this level breaks, we can see a quick move towards 22,950-22,990.
If NIFTY finds support around 23,178 and reverses, we can go long with a target of 23,256-23,345.
If it struggles near 23,256, this can be a sell-on-rise opportunity for a downward move.
📌 Pro Tip: For put buyers, ensure there is confirmation of weakness before entering. If the market shows strength after the gap-down, avoid holding puts for too long.
📌 Risk Management & Option Trading Tips 🛡️
✅ Keep Stop Loss Tight – Markets can be volatile, and a fixed SL helps in capital protection.
✅ Avoid Trading Inside the No Trade Zone – Let the price break out clearly.
✅ Hedge Your Positions – Use spreads instead of naked options to minimize risk.
✅ Don't Chase the Market – If you miss an entry, wait for the next setup.
📌 Summary & Conclusion 📢
🔹 Bullish Above: 23,422, targeting 23,544 → 23,672.
🔹 Bearish Below: 23,345, targeting 23,256 → 23,178.
🔹 No Trade Zone: 23,345-23,422 (Wait for confirmation before trading).
🎯 Always stick to the plan, manage your risk, and follow the levels carefully.
⚠️ Disclaimer: I am NOT a SEBI registered analyst. This is for educational purposes only. Trade at your own risk.
This plan ensures structured decision-making across all scenarios. Let me know if you need modifications! 🚀📊

NIFTY : Trading levels and Plan for 03-Feb-2025NIFTY Trading Plan for 03-Feb-2025
Key Levels to Watch: Resistance Zones: 🔴 Intraday Resistance Zone: 23,622 - 23,672🔴 Profit Booking / Sideways Zone: 23,822
Support Zones: 🟠 Opening Support / Resistance Zone: 23,475 - 23,565🟢 Opening Support at Retracement: 23,367🟢 Last Intraday Support (Must Try Zone): 23,229 - 23,259🟢 GAP-UP Opening (100+ Points) (Typically above 23,600 region)
➡️ If NIFTY opens above 23,565 and sustains, we need to observe price action at 23,622 - 23,672 (intraday resistance zone).
Bullish Scenario: If price consolidates above 23,672 and breaks out with volume, expect a rally towards 23,822 (profit booking zone). 📈📌 Entry: Above 23,672🎯 Target: 23,750 - 23,822❌ Stop Loss: Below 23,600
Bearish Rejection: If price rejects from 23,672 and fails to sustain, expect a pullback towards 23,500 - 23,475 .📌 Entry: Below 23,620 after confirmation🎯 Target: 23,500 - 23,475❌ Stop Loss: Above 23,680
📝 Educational Tip: In strong gap-up scenarios, avoid chasing the market immediately. Let the price consolidate near key resistance levels before taking a trade.
↔️ Sideways Possibility: If NIFTY stays between 23,565 - 23,672 , it may remain range-bound. Wait for a breakout.
⚖️ FLAT Opening (Near 23,470 - 23,500) ➡️ A flat opening would indicate market indecision and a need for further confirmation.
Bullish Bias: If price takes support at 23,475 - 23,500 and starts moving up, it can retest 23,622 , then 23,672 .📌 Entry: Above 23,500 after bullish confirmation🎯 Target: 23,622 - 23,672❌ Stop Loss: Below 23,450
Bearish Breakdown: If NIFTY breaks below 23,475 , expect a move towards 23,367 or even 23,259 (last intraday support).📌 Entry: Below 23,475🎯 Target: 23,367 - 23,259❌ Stop Loss: Above 23,525
📝 Educational Tip: Flat openings require patience. Let the market establish a clear direction before entering. Avoid overtrading in a choppy market.
🔴 GAP-DOWN Opening (100+ Points) (Typically below 23,375)
➡️ If NIFTY opens below 23,367 , it indicates weakness and possible downside towards 23,259 - 23,229 .
Bearish Continuation: If price sustains below 23,367 , expect selling pressure towards 23,259 and 23,229 .📌 Entry: Below 23,367🎯 Target: 23,259 - 23,229❌ Stop Loss: Above 23,400
Bounce Back Scenario: If NIFTY takes support at 23,259 and shows strong reversal, we may see a move back towards 23,367 or even 23,475 .📌 Entry: Above 23,275 after confirmation🎯 Target: 23,367 - 23,475❌ Stop Loss: Below 23,220
📝 Educational Tip: In gap-down scenarios, watch for institutional buying or aggressive selling. Avoid counter-trend trades without confirmation.
📌 Risk Management Tips for Options Traders ✅ Trade with Defined Risk: Always set a stop loss before entering a trade.✅ Avoid Overleveraging: Keep position sizes within your risk tolerance.✅ Watch for Volatility: Sudden spikes in IV (Implied Volatility) can impact options pricing.✅ Exit at Key Levels: If a trade reaches resistance/support, book partial profits.✅ Use Spreads for Safety: Instead of naked options, consider spreads to minimize risk.
📊 Summary & Conclusion Gap-Up: Watch for resistance at 23,672 ; breakout targets 23,822 . Flat Opening: Key support at 23,475 ; break above 23,500 can lead to bullish movement. Gap-Down: Below 23,367 , expect 23,259 - 23,229 ; bounce possible from support.
🛑 Disclaimer: I am not a SEBI-registered analyst. This analysis is for educational purposes only. Trade at your own risk.
🚀 Happy Trading & Stay Disciplined! 💰

NIFTY : Trading levels and Plan for 31-Jan-2025📌 Nifty Trading Plan – 31st January 2025 📈🔥
A structured trading plan is essential for navigating market movements with confidence. Let's analyze Nifty for 31st January 2025, incorporating key levels and different opening scenarios to optimize trade entries and exits.
📍 Key Levels:
Opening Resistance / Sideways / Profit Booking Zone: 23,415 - 23,500
Last Intraday Resistance: 23,677
Opening Support / Resistance: 23,227 - 23,214
Opening Support Zone: 23,047 - 23,108
Last Intraday Support: 22,897
🚀 Scenario 1: Gap-Up Opening (100+ points above 23,400)
If Nifty opens above 23,400 , it will enter the profit booking zone of 23,415 - 23,500 , where resistance may come into play. A cautious approach is required to avoid getting trapped in a false breakout.
If Nifty sustains above 23,500 , a move towards 23,677 (last intraday resistance) is possible.
If price faces rejection at 23,500 , expect a pullback to 23,415 . Failure to hold this level may lead to further decline toward 23,297 .
Avoid chasing long positions immediately; wait for a retest of support zones for better risk-reward trades.
👉 Pro Tip: If 23,500 is decisively broken with strong volume, it may trigger a fresh rally, offering buying opportunities on dips.
📊 Scenario 2: Flat Opening (23,250 - 23,400)
A neutral start within this range suggests the market is waiting for direction. Here’s how to approach it:
If Nifty holds 23,227 - 23,214 , it could attempt a gradual rise towards 23,400+ .
A breakout above 23,400 will open doors for an upside move toward 23,500 .
A failure to hold 23,214 may push the index down to test the 23,108 - 23,047 support zone.
Traders should watch for price action near 23,227 , as it could act as an intraday pivot for directional moves.
👉 Pro Tip: In a sideways market , consider using options scalping strategies rather than directional trades.
📉 Scenario 3: Gap-Down Opening (100+ points below 23,200)
A weak opening below 23,200 could indicate short-term bearishness. It’s important to assess whether Nifty finds support at lower levels or continues declining.
If Nifty holds 23,108 - 23,047 , expect a pullback rally toward 23,214 - 23,227 .
A breakdown below 23,047 can accelerate selling pressure toward 22,897 (last intraday support).
Look for bullish reversal signs near 23,047 - 23,000 before considering long positions.
If the market forms a lower high after a gap-down, follow the trend rather than trying to catch a falling knife.
👉 Pro Tip: If Nifty struggles to reclaim 23,214 after a gap-down, selling on rise could be a better approach.
🛑 Risk Management & Options Trading Tips: 🎯
Always define a stop-loss before entering a trade to protect your capital.
Avoid overleveraging in uncertain market conditions—risk management is key! 💰
In case of high volatility , wait for confirmation instead of chasing trades impulsively.
Consider hedging strategies (like spreads) to limit losses in options trading.
Check Open Interest (OI) data before trading options to gauge market sentiment.
📌 Summary & Conclusion:
✅ Nifty is at a critical juncture, with 23,227 - 23,214 acting as an opening pivot zone.
✅ Bullish Bias above 23,500 , targeting 23,677 .
✅ Bearish Outlook below 23,047 , targeting 22,897 .
✅ Discipline & patience are crucial—wait for confirmation before taking positions! 🚀
⚠️ Disclaimer: I am not a SEBI-registered analyst. This plan is for educational purposes only . Trade at your own risk and manage capital wisely! 📊🔥

NIFTY : Trading levels and plan for 30-Jan-2025📊 Nifty Trading Plan for 30-Jan-2025
This trading plan covers all possible opening scenarios (Gap-Up, Flat, and Gap-Down) along with crucial resistance and support levels. Follow these levels carefully to maximize your trades.
📈 Scenario 1: Gap-Up Opening (100+ points above 23,176)
If Nifty opens with a gap-up, it will likely test the resistance levels. Key focus points:
🔹 Opening Resistance Zone: 23,253 – 23,287 – If price sustains above this level, it can move towards 23,416. Consider call option trades if momentum remains strong with stop-loss at 23,200.
🔹 Major Resistance Zone: 23,416 – This is a crucial level where sellers might become active. Avoid chasing longs here and book profits.
🔹 If Nifty rejects from 23,253, watch for a retracement towards 23,176 before taking fresh trades.
💡 Pro Tip: Always wait for a retest and confirmation before entering a trade in a gap-up market.
📉 Scenario 2: Flat Opening (Near 23,176)
A flat opening means price action will revolve around the Opening Support / Resistance Zone: 23,176 – 23,200. Key levels to monitor:
🔹 If price sustains above 23,200, expect bullish movement towards 23,253, followed by 23,287. Enter call options only after a breakout confirmation.
🔹 If price rejects from 23,176, it may slip towards 23,142, and if this breaks, expect a drop to 23,059. Put options can be considered here.
🔹 Avoid trading in the Opening Support / Resistance Zone unless a clear breakout/breakdown happens.
💡 Pro Tip: Flat openings often create a trap in the first 15 minutes. Let the market settle before taking a position.
⬇️ Scenario 3: Gap-Down Opening (100+ points below 23,176)
A bearish gap-down could test support levels. Here’s how to trade it:
🔹 Opening Support Zone: 23,059 – If this zone holds, expect a pullback to 23,176. A strong reversal from this level can provide a good call option opportunity.
🔹 If 23,059 breaks, expect further downside towards 22,983, followed by 22,871 (Golden Retracement Zone). Look for put options with SL at 23,059.
🔹 If price sustains below 22,871, expect high volatility. Avoid aggressive long positions.
💡 Pro Tip: In gap-down markets, avoid catching falling knives. Look for proper support confirmation before entering long trades.
🛡️ Risk Management Tips for Options Trading
🔹 Keep a fixed risk per trade (1-2% of capital) to avoid big losses.
🔹 Use ATM (At-the-Money) or slightly OTM (Out-of-the-Money) options for better liquidity.
🔹 Don't overtrade. If your first 2 trades fail, step back and analyze the market.
🔹 Follow proper stop-loss levels to protect capital.
📊 Summary and Conclusion
Resistance Zones: 23,200, 23,253-23,287, 23,416
Support Zones: 23,176, 23,142, 23,059, 22,983, 22,871
Opening Support / Resistance Zone: 23,176 – 23,200 (Wait for breakout/breakdown)
📌 Stick to the plan and manage risk wisely. Market structure matters more than emotions!
⚠️ Disclaimer: I am not a SEBI-registered analyst. This trading plan is for educational purposes only. Trade at your own risk. 😊

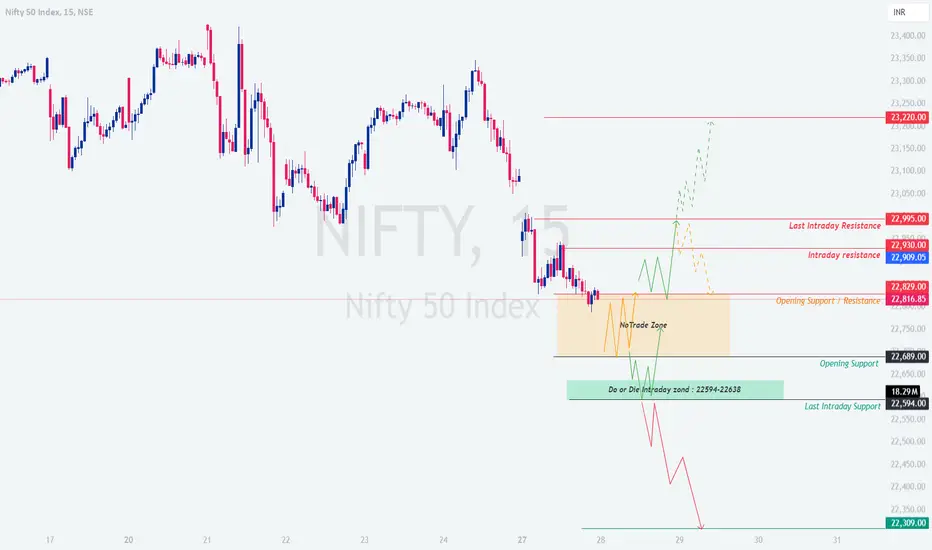
NIFTY : Trading levels and Plan for 28-Jan-2025📊 NIFTY Trading Plan for 28-Jan-2025 📊
📈 Key Levels to Watch:
Opening Support/Resistance Zone: 22,816-22,829
Intraday Resistance Zone: 22,909-22,930
Last Intraday Resistance Zone: 22,995
No Trade Zone: 22,816-22,829
Do or Die Intraday Zone: 22,594-22,638
Final Support Zone: 22,309
🌟 Scenario 1: Gap-Up Opening (100+ points above 22,909) 🌟
If NIFTY opens significantly above 22,909:
✅ Wait for Retest: Do not jump into trades immediately. Allow the index to retest the 22,909-22,930 zone for confirmation of strength.
📈 Action Plan: If the price holds above 22,930, initiate long trades targeting 22,995 (last resistance) and further extending to 23,220. Keep a stop-loss below 22,900.
🚫 Caution Zone: If resistance is observed near 22,995, consider profit booking or tightening stop-loss. Avoid fresh longs unless a breakout above 22,995 is confirmed.
💡 Pro Tip: Use bull call spreads to manage risk while capturing potential upside gains.
📉 Counter Strategy: If a bearish rejection candle forms near 22,995, short trades targeting 22,909 can be considered with a tight stop-loss.
🔄 Scenario 2: Flat Opening (Near 22,816) 🔄
If NIFTY opens flat or within the No Trade Zone: 22,816-22,829:
⚪ Avoid Immediate Trades: This range is indecisive. Wait for a breakout above 22,829 or a breakdown below 22,816.
🔼 Breakout Strategy: If the price breaks and sustains above 22,829, go long targeting 22,909-22,930. Use a stop-loss below 22,800.
🔽 Breakdown Strategy: If the price breaks below 22,816, initiate short trades targeting 22,689. Maintain a stop-loss above 22,850.
💡 Pro Tip: In a flat market, time decay in options can work against you. Use directional trades or hedged strategies.
🚦 Options Strategy: Consider a straddle or strangle strategy around the no-trade zone to capitalize on a potential breakout or breakdown.
🌧️ Scenario 3: Gap-Down Opening (100+ points below 22,816) 🌧️
If NIFTY opens below 22,816:
📉 Key Zone to Watch: The Do or Die Zone: 22,594-22,638 is critical. Look for bullish price action (e.g., hammer or bullish engulfing candles) for a potential reversal.
✅ Action Plan: If the price holds above 22,594, initiate long trades targeting 22,816. Use a stop-loss below 22,580.
🔥 Aggressive Selling Levels: If the price sustains below 22,594, further downside towards 22,309 is possible. Short trades can be initiated with strict risk management.
💡 Pro Tip: During gap-down scenarios, volatility spikes. Use hedging strategies (e.g., protective puts) to limit losses.
🚫 Avoid Overtrading: Gap-downs can lead to whipsaws. Wait for confirmation before entering trades.
🛡️ Risk Management Tips 💡:
🎯 Always follow your stop-loss and avoid emotional decisions.
🔥 Never risk more than 2% of your trading capital on a single trade.
🧘 Stay patient and disciplined. Avoid trading in the No Trade Zone .
📊 Utilize options strategies to hedge risk and protect your capital.
📝 Summary & Conclusion:
Key Zones to Monitor:
Resistance: 22,909-22,930 , 22,995 , and 23,220 .
Support: 22,816 , 22,689 , and 22,594-22,309 .
Gap-ups favor long trades above 22,909 , while gap-downs focus on supports like 22,594 .
Stick to your plan and avoid trades in the No Trade Zone unless a breakout or breakdown occurs.
⚠️ Disclaimer:
I am not a SEBI-registered analyst . All information shared is for educational purposes only. Please consult with a financial advisor before making any trading decisions.
NIFTY 50 in Rangebound Movement, Poised to Break Resistance..!The NIFTY 50 index is currently navigating a rangebound market, attempting to break through a short-term resistance level at 23360 rs. So far, it has tested a significant support level of 23100 rs on two separate occasions, indicating a critical point for potential market stability or decline. Investors should exercise caution, as disappointing quarterly results could weigh heavily on market sentiment and increase volatility. Keeping a close eye on these developments is essential for making informed decisions.

NIFTY : Trading Levels and Plan for 20-Jan-2025🔖 Nifty Trading Plan for 20-Jan-2025
📊 Key Levels:
Resistance Zones: 23,318–23,334, Profit Booking Zone: 23,405–23,435
Support Zones: 23,113–23,201, 23,007, 22,962
1️⃣ Gap-Up Opening (100+ points)
If Nifty opens above 23,334:
Look for consolidation or rejection near Profit Booking Zone (23,405–23,435). If rejected, consider a short entry with a target towards 23,334 or 23,269.
Sustained breakout above 23,435 may lead to a rally. Use trailing stop-loss to ride the momentum.
📌 Educational Insight: Gap-ups often signal bullish momentum, but profit booking zones can act as reversal points. Observe price action carefully.
2️⃣ Flat Opening (Within 23,201–23,203)
Monitor opening price reaction within the Golden Retracement Zone (23,113–23,201).
If Nifty holds 23,201, it’s a signal to go long with a target towards 23,318–23,334.
Break below 23,113 could indicate bearish momentum. Short below this level with a target towards 23,007.
📌 Educational Insight: Flat openings are ideal for price action-based trades. Let the first 30 minutes settle before taking positions for the best risk-reward setup.
3️⃣ Gap-Down Opening (100+ points)
If Nifty opens near 22,962–23,007:
Look for bullish reversals within the Trending Shift Zone (22,962–23,007). Go long if strong buying is observed, targeting 23,113.
A breakdown below 22,962 could lead to further weakness. Short positions below this level with a target of 22,880.
📌 Educational Insight: Gap-downs often create opportunities for sharp reversals or continuation trends. Wait for confirmation before entering trades.
📌 Risk Management Tips for Options Trading:
Use hourly candle close as confirmation before entering trades.
For directional trades, avoid over-leveraging and use defined stop-loss.
Hedge positions using spreads to limit risk in volatile markets.
Monitor IV (Implied Volatility) while trading options; high IV can inflate premiums.
🔍 Summary & Conclusion:
For 20-Jan-2025, focus on the key zones:
Watch Golden Retracement Zone (23,113–23,201) for flat openings.
Look for rejection or breakout near 23,405–23,435 in case of gap-ups.
Keep an eye on 22,962–23,007 for possible reversals in gap-down scenarios.
⚠️ Disclaimer: I am not a SEBI-registered analyst. This plan is for educational purposes only. Traders are advised to conduct their own analysis or consult with financial advisors before making any trading decisions.

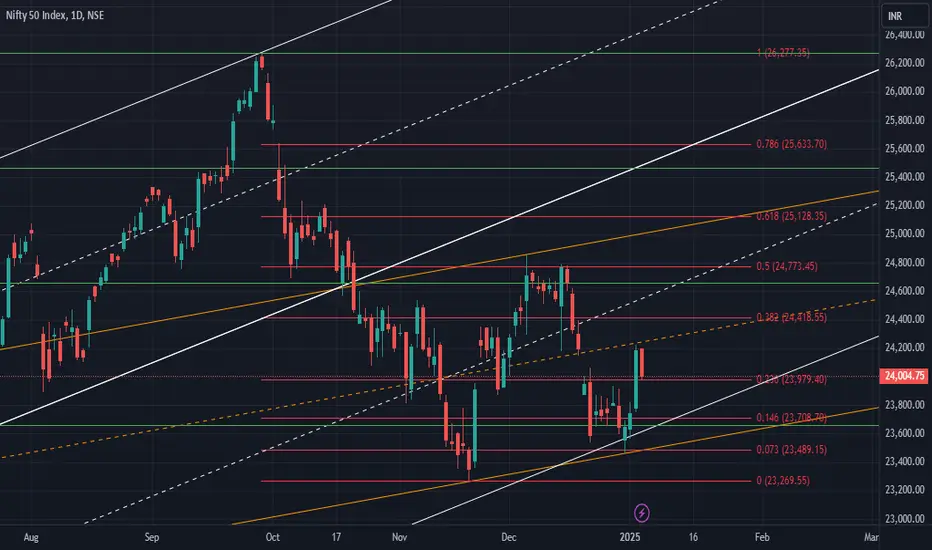
The Wave is Shifting: Anticipate NIFTY’s Next Move!Dear Traders,
I hope this message finds you well in your trading endeavors and personal pursuits. I am excited to share a compelling opportunity with you through a new NIFTY analysis that sheds light on the continuation of the market shift.
Preliminary Analysis Overview:
The correction initiated on September 27, 2024, is a correction for the move from June 17, 2022, to September 27, 2024 (15,183.40 to 26,277.35). This move has spanned over 120 weeks (834 days) in time and 11,093.95 points in price. This necessitates a long-term and deeper correction, which is currently underway. This can be visually represented by the trend lines:
The downward trend from the all-time high continues, which is currently experiencing a corrective phase within a larger correction.
There are two potential phases for the ongoing trend:
Phase I:
The initial phase of correction primarily tested the .236 R of the aforementioned motive wave (refer to the figure below):
Following the correction, there is a correction within the correction in a larger degree (although the primary downtrend remains intact).
This internal correction is anticipated to rise further to test 0.146 R and 0.073 R of the long-term bull market (serving as potential resistances).
RI – 24,254.10
RII – 24,600 ~24,657
RIII – 25,100 ~25,120
*These values are not actual but merely levels.
Time resistances are anticipated on January 9th and February 17th (of considerable strength).
Reference:
Phase II:
Following the completion of the internal correction, the market is anticipated to resume its current downward trend in a more significant manner to test the 38.2 R (21,500 levels) + static support junction, which will be further discussed as the market evolves.
---
**Important Dates to Remember: **
Please note the following significant economic indicators and their release dates:
**January 8, 9, and 10: ** Federal Open Market Committee (FOMC) meeting and employment data release (NFP).
**January 13 and 14: ** Inflation data release.
**January 13-16: ** Sales and inflation data release.
---
**Final Verdict: **
The current uptrend is considered interim. The primary trend remains downward and is anticipated to persist further and deeper. This trend is expected to test the 38.2% resistance level coinciding with the 21,360-support level.
---
**Strategy: **
Given the prevailing market conditions, adopting a bullish stance appears prudent. Key levels to monitor include 24,657 and 25,120, which are expected to be tested. It is imperative to remain vigilant and informed about potential opportunities that may arise.
------
Fellow Traders,
The creation of this valuable analytical resource has required countless hours of dedication and effort. If you find it useful, I humbly request your support by boosting the idea and following me (updates will be provided via this post, new posts, and through minds). Your comments and thoughts on this idea are highly valued, and I am committed to engaging with each one personally.
Thank you for investing your time in reading this article.
Wishing you profitable and fulfilling trading endeavors!
Disclaimer:
Before concluding, I must emphasize that the insights shared are based on my analysis. It is crucial for you to conduct your own research and, if necessary, consult with a financial advisor before making any trading decisions. The dynamic nature of financial markets necessitates that your strategies align with your financial objectives and risk tolerance.
NIFTY : Bearish Trend, but a Bounce Might Be Coming
NSE:NIFTY has been trending lower, with sellers clearly in control. However, it looks like the market is taking a breather, and there’s a chance for a short-term bounce before the downtrend continues.
What’s Happening?
1. Resistance Zones:
- 23,770: This is the first hurdle for the price to cross. Sellers have been strong here.
- 23,833 and 23,935: If 23,770 breaks, these are the next levels where selling pressure might kick in.
2. Support Levels:
- 23,439: The first key level where buyers could step in.
- 23,303: A stronger support zone if the decline deepens.
3. Trendline Resistance:
There’s a clear downward trendline acting as a ceiling, making it hard for the price to move higher.
4. Current Setup:
The price is hovering around 23,629 after a sharp drop. It feels like the market is pausing to decide its next move. A bounce toward 23,770 looks possible, but the bigger picture still leans bearish.
How to Trade This:
- If you’re bullish:
Watch for a breakout above 23,770 with good buying momentum. If it happens, there’s room for the price to climb to 23,833 or even 23,935.
- If you’re bearish:
Look for the price to struggle near 23,770 or start falling again. That could be your signal to go short, with targets at 23,439 and 23,303.
Bottom Line:
The market still looks weak, but there’s a chance for a small bounce before sellers take control again. Keep an eye on how the price behaves around 23,770—it’ll tell us whether buyers are gaining strength or if the downtrend is here to stay.
What do you think? Are you leaning bullish or bearish? Share your thoughts in the comments!
Only for educational purposes.
This content is not a recommendation to buy and sell.
Not SEBI REGISTRAR.

Nifty ready to take 25kShort selling move has pushed nifty up. Let it consolidate a bit and then its ready for one more push up to take 25000.

INDIAN MARKET PILLER NIFTY 50 ANALYSIS Here we analyzed Nifty50 in hourly and 15/30 minutes time frame.
23968-23900 IS A LAST SUPPORT ZONE IF NIFTY BREAKS THAT THIS TRADE WILL BE TERMINATED
PRO ABOUT THIS TRADE :-
We analyzed Nifty50 Sector on that base we traded Nifty50
Britannia, Axis Bank, Bpcl and few others on favor
CONS:-
Nifty50 Got rejection from weekly supply zone Today.

NIFTY - Hajaari TradeHajaari Trade in Nifty seems active , provided it remains above 24K Level for next 3-4 Days!
NIFTY Staying above our Hajaari (Thousan Level) Trade since 31 Dec 2024.
Perfect Set up for our Hajaari Trade. Let's Ride the trend for 800 to 1k points from last Monthly Expiry.
Eyeing for 25500 Level with Bearish Expiry view this month End.
Let's see how market responds!
This Chart is for educational purpose & not a buy/sell recommendation.
Nifty may remain Bullish this month till 15 Jan, we may see a reversal basis Budget Movements. This is a Big yearly event which result in throwing Technical out of the window.
Technical Analysis may not work on Event Days like Budget, Election, Monitory Policy Review, RBI/ FED Interest Rat Decisions, etc. It is advised to check out Economic Calendar before planning a Trade!
Thank You

Nifty Review & Analysis - DailyPrice Action :
Nifty opened at previous day's close and tested pivot level finding buying around 23565 levels and rallied almost 200 points till 23775 levels and saw small profit booking. Post noon saw buying around 23700 levels and tested above 23800 and saw small profit booking towards end of the day loosing momentum. If sustained below 23800 can again test 23700-23730 levels and above 23820 if sustained can test 23950 levels.
Trend:
Nifty formed Higher High and Higher Low suggesting Long Trend
Options Data:
23700-800 Puts added Open Interest showing support. 23700 and 23900 CE shedded OI, don't have much resistance till 24050-100 levels.
Futures Data:
Nifty Futures closed positively with Increase in Open Interest suggesting Bullish
Outlook for Next Session:
Nifty looks Bullish above 23800 for tgt 24000-24050. (for next wkly expiry)
Positons:
Wait for 30min candle close above 23800 to go long for tgt 24000.

BAJAJ AUTO Shortterm VIEW BEARISHAfter a good run from Rs.4,000 (in APRIL 2023) Stock has doubled and more to Rs.10,000.
Along the journey We have seen small consolidations at Rs.8,500-9,300 and stock reached Rs.10k After that we have seen a small dip towards 8,800.
Now its forming a HNS Pattern in Weekly TF.
I expect a Downside correction to 7,000-7,300 Zone.
I also believe Automobile Sector will go through some consolidation.

#NIFTY50 TRADE SETUP - 30TH DECEMBER !!Nifty 50 Chart Analysis - 1 day Chart VieW
NSE:NIFTY
Nifty 50 Chart Analysis - Detailed Breakdown
Key Observations:
1. Current Price Zone: The Nifty index is trading at 23,832, with the price consolidating near recent lows.
2. Key Resistance Zones:
- 24,197.50: A significant resistance level, aligning with prior price rejections and a potential reversal area.
- 24,069.95: Intermediate resistance that needs to be cleared for bullish continuation.
3. Key Support Zones:
- 23,586.25: A strong support zone where buyers might step in, preventing further downside.
- 23,262.15: A deeper support level, marking the lower boundary of the recent bearish structure.
4. Market Sentiment: The price action indicates uncertainty, with equal probabilities of breakout above the resistance or breakdown below support.
Price Movement Summary:
- Upside Potential: A breakout above 24,197.50 could push the index towards 24,300+ levels. Thiszone has been highlighted in the chart as a bullish target area (marked in red box).
- Downside Risk: If the index breaks below 23,586.25, it could test 23,262.15 or lower, as depictedin the bearish target zone.
Trading Plan:
1. Bullish Plan:
- Entry: Above 24,069.95.
- Target 1: 24,197.50.
- Target 2: 24,300+.
- Stop-Loss: Below 23,961.55 (current pivot zone).
2. Bearish Plan:
- Entry: Below 23,586.25.
- Target 1: 23,536.60.
- Target 2: 23,262.15.
- Stop-Loss: Above 23,832.45.
Summary:
- Nifty is at a critical juncture, with immediate resistance at 24,069.95 and support at 23,586.25.
- Traders should wait for confirmation (breakout or breakdown) before initiating positions.
- Risk management is crucial as the index approaches year-end volatility.
Disclaimer:
This content is for educational purposes only. It is not a recommendation to buy or sell any financial instrument.The creator is not a SE-BI-registered advisor. Please consult with a certified professional before making investment decisions.


NIFTY : Trading Plan and level for 26-Dec-2024Trading Plan for 26-Dec-2024 – Nifty
Introduction:
The trading plan for 25-Dec-2024 focused on critical zones identified on the uploaded chart. The Golden Retracement Zone (23,603–23,703) acted as a pivot for potential reversals, while the Last Resistance Zone for Intraday (23,891–23,933) served as a crucial barrier. The day saw the index testing the retracement zone, respecting support at 23,608 , and moving toward the resistance zone. The Yellow, Green, and Red trends indicated sideways, bullish, and bearish phases, respectively, providing actionable setups. Today’s plan builds on these zones with further analysis.
Scenario 1: Gap-Up Opening (200+ Points)
If Nifty opens above 23,933 :
The index enters the Profit Booking Zone (24,043–24,078) , where strong resistance can lead to rejection ( Red Trend ). A sustained move above 24,078 could trigger bullish momentum ( Green Trend ).
Action Plan:
Look for shorting opportunities near 24,043 with a stop-loss above 24,100 , targeting 23,891 .
If prices sustain above 24,078 , initiate long positions with a target of 24,200+ .
If Nifty retraces back into the Last Resistance Zone (23,891–23,933) , watch for consolidation ( Yellow Trend ).
Scenario 2: Flat Opening (Within 50 Points)
If Nifty opens near 23,730–23,760 :
Monitor price action at the Retracement Zone (23,608–23,703) .
Action Plan:
A breakdown below 23,608 can trigger bearish momentum toward 23,495 . Initiate shorts with a stop-loss above 23,640 .
If prices sustain above 23,703 , look for long positions targeting 23,891 .
Wait for the first 15-30 minutes for market sentiment before initiating trades.
Scenario 3: Gap-Down Opening (200+ Points)
If Nifty opens near 23,495–23,446 :
The Last Intraday Support Zone is critical. Watch for bounce signals ( Green Trend ).
Action Plan:
Go long above 23,495 with a target of 23,608 . Use a stop-loss below 23,430 .
If prices break 23,446 decisively, expect bearish momentum toward lower levels ( Red Trend ). Avoid aggressive trades until a clear direction is established.
Risk Management Tips for Options Trading:
Always trade with defined targets and stop-losses .
Avoid over-leveraging, especially near resistance and support zones.
Allow the market to settle for at least 15-30 minutes before initiating trades.
Use trailing stop-losses to protect profits in trending moves.
Trade with appropriate position sizing to limit losses.
Summary and Conclusion:
Nifty is trading near critical levels, and today’s trading plan highlights actionable zones for all opening scenarios. Focus on Golden Retracement and Resistance Zones for probable reversals and momentum plays. Patience and disciplined execution with proper risk management are key to capitalizing on market opportunities.
Disclaimer:
I am not a SEBI-registered analyst. This trading plan is shared purely for educational purposes. Traders are advised to conduct their research or consult a financial advisor before taking any positions.

NIFTY : Trading Levels and Plan for 24-Dec-2024Plan vs. Actual Performance (23-Dec-2024) - Nifty:
In today’s session, Nifty closely followed the levels and zones highlighted in the trading plan:
The index opened within the Opening Resistance/Support Zone (No Trade Zone) , as indicated in the plan. Price action remained muted here, showing indecision, aligning with the expectation of limited opportunities in this area.
The attempted move towards the Last Intraday Resistance Zone (23,953-24,058) failed, with prices reversing near resistance, confirming the bearish projection (red trend).
Later in the session, the index approached the Buyer’s Support Zone (23,194-23,281) . Prices showed signs of stabilization, reflecting the plan's green trend projection for potential reversal or support testing.
Key Takeaway: The plan accurately captured the market's reaction to critical levels, reinforcing the importance of patience in the No Trade Zone and the effectiveness of the support/resistance zones for planning entries.
This reflects the value of adhering to a well-defined trading framework.
This analysis will help us prepare for the trading day on 24-Dec-2024, considering different opening scenarios.
Trading Plan for 24-Dec-2024
Gap Up Opening (100+ points above 23,747.20)
If the market opens above 23,847.20, it indicates a strong bullish sentiment. The first resistance level to watch is 23,863.00 (Opening Resistance). If the price sustains above this level, the next target is 23,976.00 (Last Intraday Resistance for retracement).
In case the price breaks above 23,976.00, the next target is 24,009.00. A sustained move above this level can lead to the Profit Booking zone at 24,128.00.
If the price fails to sustain above 23,863.00, look for a potential retracement to 23,739.30. This could indicate a sideways trend (yellow line) or a bearish reversal (red line).
Flat Opening (around 23,747.20)
A flat opening suggests indecision in the market. The immediate level to watch is 23,739.30. If the price holds above this level, it could indicate a bullish trend (green line) towards 23,863.00.
If the price breaks below 23,739.30, the next support level is 23,611.00 (Opening Support Zone at Buyer’s retracement zone). A break below this level could lead to a bearish trend (red line) towards 23,547.00.
Monitor the price action around 23,863.00 for potential resistance. A break above this level could lead to targets of 23,976.00 and 24,009.00.
Gap Down Opening (100+ points below 23,747.20)
A gap down opening below 23,647.20 indicates bearish sentiment. The first support level to watch is 23,611.00. If the price holds above this level, it could indicate a potential retracement (yellow line) towards 23,739.30.
If the price breaks below 23,611.00, the next target is 23,547.00. A sustained move below this level could lead to further downside towards 23,447.00.
In case of a retracement, monitor the price action around 23,739.30 for potential resistance. A break above this level could lead to targets of 23,863.00 and 23,976.00.
Risk Management Tips for Options Trading
Always use stop-loss orders to limit potential losses.
Avoid over-leveraging your positions; trade within your risk tolerance.
Diversify your trades to spread risk across different assets or strategies.
Keep an eye on implied volatility, as it can significantly impact options pricing.
Regularly review and adjust your trading plan based on market conditions.
Summary and Conclusion
In summary, the trading plan for 24-Dec-2024 involves monitoring key support and resistance levels based on the opening scenario. By understanding the potential price movements and trends (yellow for sideways, green for bullish, and red for bearish), traders can make informed decisions. Always practice good risk management to protect your capital.
Disclaimer : I am not a SEBI registered analyst. This analysis is for educational purposes only and should not be considered as financial advice. Always do your own research before making any trading decisions.

#NIFTY50 - 24TH DECEMBER !!NSE:NIFTY
NIFTY CHART ANALYSIS (24TH DEC)
Important Levels:
1. Resistance Levels:
- 24,259.50: Key resistance zone where selling pressure might build.
- 23,926.95: Immediate resistance near the current price.
2. Support Levels:
- 23,398.85: Major support level below the current price where buyers could step in.
3. Trendline:
- A downward trendline acts as dynamic resistance, connecting lower highs and reinforcing the bearish momentum.
Analysis:
- The price is in a bearish trend, consistently making lower highs and lower lows.
- Current Scenario: The price is near the trendline and could face rejection, continuing the downward move toward 23,398.85.
- Alternative Scenario: A breakout above the trendline might invalidate the bearish setup, potentially leading to a test of 23,926.95 or higher.
Only for educational purposes.
This content is not a recommendation to buy and sell.
Not SEBI REGISTRAR.

#Nifty50 outlook for upcoming week 23-27th Dec 2024The Nifty experienced a tumultuous week, plummeting roughly 1200 points to close at 23587 after reaching a high of 24781 and a low of 23537. This sharp decline was largely attributed to a hawkish stance from the US Federal Reserve, triggering a sell-off in the US market and prompting significant Foreign Institutional Investor (FII) selling in India. The 5% correction from its peak has brought the Nifty dangerously close to the crucial WEMA50 support level at 23426. However, there are signs of a potential bullish reversal forming a 'W' pattern. Sustaining above 23426 will be critical for a market turnaround.
Next week, I expect a volatile trading range between 24100 and 23000 . A breach of these levels could lead to significant market moves. The monthly Nifty chart also indicates weakness, suggesting further downside potential towards the 22250 support level, representing a 5.7% decline from current levels.
This presents a valuable opportunity for investors to prepare a watchlist of their preferred stocks and strategically accumulate positions during any further market correction

NIFTY - Trading Levels and Plan for 20-Dec-2024Intro: Review of the Previous Day’s Plan
After a gap down opening, prices saw first phase of recovery but could not find follow on support and traded in a narrow range. Let’s analyze potential scenarios for today.
Plan for Different Opening Scenarios
Gap-Up Opening (100+ points above 24,014):
A gap-up above 24,014 places Nifty near the resistance zone or even at 24,103. The focus should be on observing price action for either a breakout or a rejection.
Plan of Action:
If Nifty approaches 24,227, monitor for bearish rejection signals (e.g., shooting stars or bearish engulfing patterns) to initiate short positions targeting 24,103 and 24,014. Stop loss can be placed above 24,250.
For a breakout above 24,227, wait for an hourly close and consider long trades targeting 24,300 or higher. Stop loss below 24,200.
Key Tips: For options, consider OTM calls if a breakout occurs. Hedge positions using vertical spreads to cap potential losses.
Flat Opening (Within 23,900-24,000 range):
A flat opening keeps Nifty in the sideways zone (yellow trend). Early market movement will determine directionality.
Plan of Action:
If Nifty sustains above 24,014, initiate longs targeting 24,103 and 24,227. Use a stop loss below 23,950.
If the index slips below 23,900, initiate shorts targeting 23,877 and 23,748 with a stop loss above 24,000.
Key Tips: A flat opening is ideal for option straddle/strangle setups. Close positions if volatility contracts or movement remains indecisive.
Gap-Down Opening (100+ points below 23,877):
A gap-down below 23,877 places Nifty near support or bearish breakdown zones. Focus on price action around 23,748 or 23,604.
Plan of Action:
If Nifty holds above 23,748, initiate long positions with targets at 23,877 and 23,961, keeping a stop loss below 23,700.
A breakdown below 23,748 opens further downside to 23,604. Initiate shorts below this level with targets at 23,500 or lower. Stop loss above 23,800.
Key Tips: In gap-down scenarios, avoid panic trades. For options, consider OTM puts or debit spreads for bearish strategies.
Risk Management Tips for Options Trading:
Never risk more than 2% of your capital on a single trade.
Use a mix of ATM and OTM options for balanced risk/reward setups.
Exit trades promptly if Nifty deviates from the expected plan.
Monitor implied volatility; avoid overpaying for options in low-volatility environments.
Summary and Conclusion:
Today’s plan revolves around key levels: 24,014, 23,877, and 23,748. The yellow trend indicates likely consolidation, the green trend highlights bullish potential, and the red trend shows bearish zones. Patience and disciplined execution are crucial for trading success. Let price action confirm your trades before entering positions.
Disclaimer:
I am not a SEBI-registered analyst. This analysis is for educational purposes only. Please consult your financial advisor before making any trading decisions.
