#NIFTY Intraday Support and Resistance Levels -22/03/2024Nifty will be gap up opening in today's session. After opening nifty sustain above 22030 level and then possible upside rally up to 22150 level in today's session. in case nifty trades below 21990 level then the downside target can go up to the 21870 level.
Niftytrendanalysis

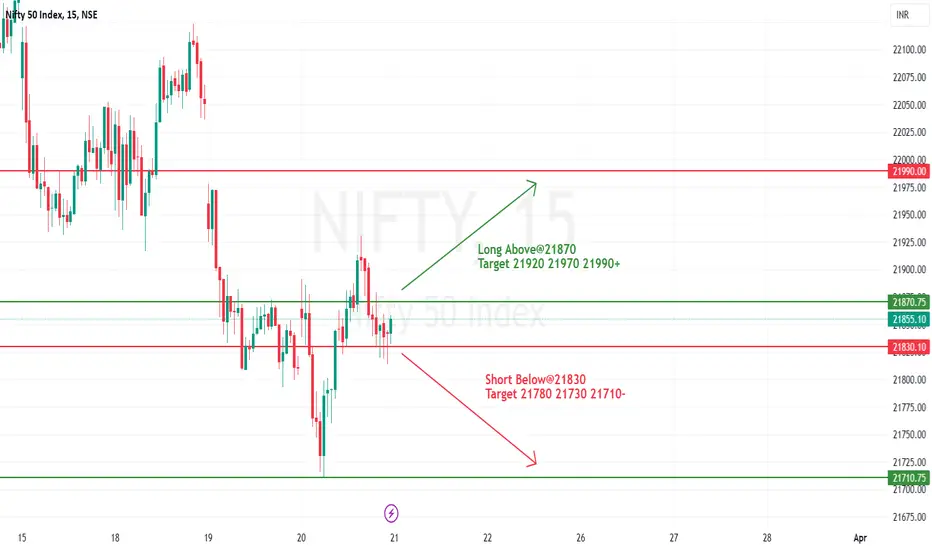
#NIFTY Intraday Support and Resistance Levels -21/03/2024Nifty will be gap up opening in today's session. After opening nifty sustain above 21870 level and then possible upside rally up to 21990 level in today's session. in case nifty trades below 21830 level then the downside target can go up to the 21710 level.
#NIFTY Intraday Support and Resistance Levels -15/03/2024Nifty will be gap up opening in today's session. After opening nifty sustain above 22170 level and then possible upside rally up to 22290 level in today's session. in case nifty trades below 22130 level then the downside target can go up to the 22010 level.

NIFTY--Head & Shoulders??The nifty index is now at Neckline...
price is clearly forms a Head and Shoulders pattern...
wait for the price to breaks the neckline and retest to go for short side continuation.

Reversal Broadening Wedge pattern in Nifty 50 indexNIFTY 50 INDEX
Key highlights: 💡⚡
📈 On 1 Hour Time Frame Nifty Index Showing Reversal of Broadening Wedge Pattern.
📈 It can give movement upto the Reversal Final target of Above 22600+.
📈 There have chances of breakout of Resistance level too.
📈 After breakout of Resistance level this nifty index can gives strong upside rally upto Above 23150+.
📈 Can Go Long in this nifty index by placing a stop loss Below 21650-.

#NIFTY Intraday Support and Resistance Levels -14/03/2024Nifty will be gap down opening in today's session. After opening nifty start trading below 21930 level and then possible downside rally up to 21810 in today's session. in case nifty trades above 22000 level then the upside target can go up to the 22120 level.

NIFTY--Liquidity lies @Double Bottom??Nifty index is showing straight forward bullishness from the keylevel @from BASE high.
Price observed a rally base rally from 21500 levels to 22500 levels.
Trendline is also acts as support,to push the price.
Now A Lot of liquidity is lies below the trendline and as well as below the double bottom levels at 21800 levels,and also we have a strong demand zone lies at 21700 levels.Price has to test these levels again for further move in Nifty INDEX.
Will update all the information accordingly to reach for these levels.

#NIFTY Intraday Support and Resistance Levels -12/03/2024Nifty will be gap up opening in today's session. After opening nifty sustain above 22340 level and then possible upside rally up to 22460 level in today's session. in case nifty trades below 22300 level then the downside target can go up to the 22180 level.

#NIFTY Intraday Support and Resistance Levels -11/03/2024Nifty will be gap down opening in today's session. After opening nifty start trading below 22450 level and then possible downside rally up to 22330 in today's session. in case nifty trades above 22520 level then the upside target can go up to the 22640 level.

#NIFTY Intraday Support and Resistance Levels -06/03/2024Nifty will be gap down opening in today's session. After opening nifty start trading below 22340 level and then possible downside rally up to 22220 in today's session. in case nifty trades above 22400 level then the upside target can go up to the 22540 level.

#NIFTY Intraday Support and Resistance Levels -05/03/2024Nifty will be gap up opening in today's session. After opening nifty sustain above 22420 level and then possible upside rally up to 22540 level in today's session. in case nifty trades below 22370 level then the downside target can go up to the 22250 level.

#NIFTY Intraday Support and Resistance Levels -04/03/2024Nifty will be gap up opening in today's session. After opening nifty sustain above 22420 level and then possible upside rally up to 22540 level in today's session. in case nifty trades below 22370 level then the downside target can go up to the 22250 level.

NiftyNifty Daily Chart today candle is Positive but nifty50 some share's will be go negative.. This POST is for aware to anyone for your Stock's... Something will go negative it's my view 🙇♀️🙇♀️

NIFTY 22 FEB 2024 viewIf we look at derivative data
0.80% % DECREASE, with a 3.6% addition in open interest.
if we look at volume, there is a 23% rise compared to yesterdays volume
iv down by 4 points , pcr is at low point of week and IVP AT 89 percentile .
support now at 21930-21960 while after todays cool offnow 22250 -22280 likely to act as a resistance zone

NiftyNifty weekly chart forming flag and Pole breakout but waiting for price sustain.. Buy on dip nifty Stock's..

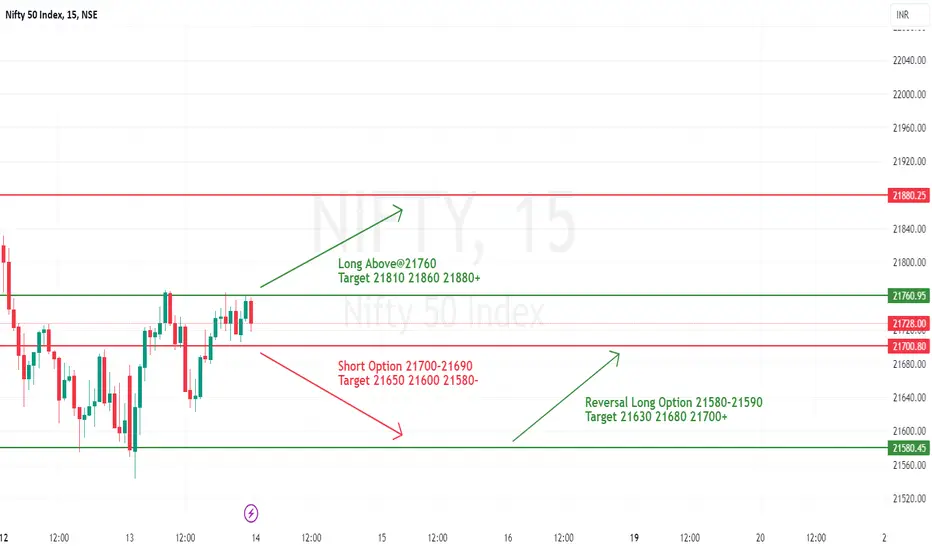
#NIFTY Intraday Support and Resistance Levels -14/02/2024Nifty will be gap down opening in today's session. After opening nifty start trading below 21700 level and then possible downside rally up to 21580 in today's session. in case nifty trades above 21760 level then the upside target can go up to the 21880 level.also possible reversal upside 21580 level.
Nifty50 Trend Analysis Corrected ChartEverything is same except the sub waves of Wave 3, which is corrected for its degree from minor to intermediate.
It is currently undergoing Wave 4 correction.
Support is around 20860 level which is also at 38.6% Fib level and key support level as highlighted in green dashed line.
Minimum target for Wave 5 can be around 23000 level, can go higher only if upside break out happens.
Maximum target can be 25400 level. Wave 5 is more likely to be extended as Wave 1 & Wave 3 are of equal length.
Use this correction as buying opportunity in specific stocks or sectors where bullish chart patterns are visible. Avoid stocks which have rallied too much.
Do your own due diligence before taking any action.
Peace!!

Nifty50 Trend Analysis as per Wave TheoryIt is currently undergoing Wave 4 correction.
Support is around 20860 level which is also at 38.6% Fib level and key support level as highlighted in green dashed line.
Minimum target for Wave 5 can be around 23000 level, can go higher only if upside break out happens.
Maximum target can be 25400 level. Wave 5 is more likely to be extended as Wave 1 & Wave 3 are of equal length.
Use this correction as buying opportunity in specific stocks or sectors where bullish chart patterns are visible. Avoid stocks which have rallied too much.
Do your own due diligence before taking any action.
Peace!!

NiftyNifty Daily Chart with Fib Retracement my view is Bullish because of Retracement might be will go 20870 point one it will bullish again so buy on dip only stocks for swing not nifty or banknifty..

NIFTY 50NIFTY is currently moving in descending triangle.
Market could move either side trade wisely.

Nifty Daily Chart Nifty also form hh and hl first resistance 21755 & second resistance 21834. It's very important nifty will be sustain on 21755 1hr chart or gap up on 21755 with strong candle then breakout it's will be make new high again..

Regression Channel - Nifty - Day & 1hr timeframe1. Change in the regression trend at day timeframe, 1st Dec 23
It occurred with Gap formation, which will act as good support
2. Another Regression channel can be observed at 1hr time frame
3. Spinning Top Formation at the weekly timeframe, implicates bearish sentiment in the last week's price movement
Another "change in the trend" is expected

Nifty Levels for tomorrowMarked are the levels which are important support and resistance for tomorrow 27th December 2023
