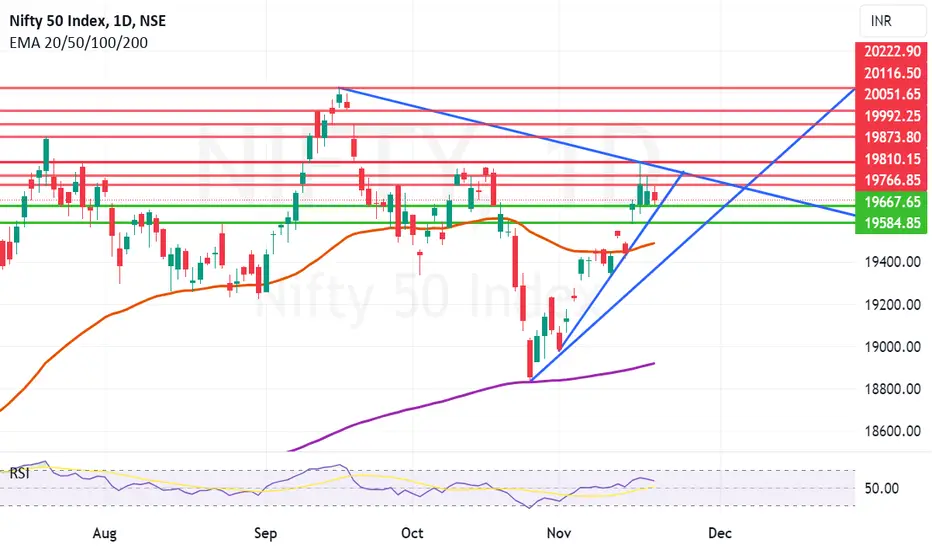
Nifty Facing Trend line Resistance but looking strong Nifty is facing trendline resistance zone between 19830 and 19875. Nifty today made a high of 19829 and closed blow 19800 at 19783. Looks like tomorrow again Nifty will try to close above the 19875. If it does we can see further rally till 19992 and 20100+ levels. However crossing this hurdle is little tough. It can become easy if Nifty opens gap up above the trendline resistance. If Nifty fails to cross the resistance the supports at lower level will be at 19751, 19667, 19584 and finally 19498. But overall scenario still remains positive despite the resistance.
Niftyview

Nifty in the support zone.Nifty right now is in a zone where it has multiple supports taking any of which it can start climbing again. The major support zone from the current level is 19667 to 19584. Below 19584 the major support for Nifty will be 50 days EMA (Mother Line) near 19487. Resistances on the upper side for spot nifty are near 19766, 19810, 19873 and 19992. Above 19992 Nifty can rise to 20051, 20116 and finally previous peak of 20222. So it might be a range bound few days till election results are announced.
Nifty to Yo-Yo between supports and resistance this week.Nifty is trying to look for proper support to launch from and over come some important critical resistances. There are multiple supports for Nifty in the range of 19582 to 19667 Nifty can take support from any of these places and lunge forward. While going forward the resistances that Nifty might face are 19785, 19819 and 19873.

#NIFTY Intraday Support and Resistance Levels - 17/11/2023Nifty will be gap down opening in today's session. After opening nifty start trading below 19720 level and then possible downside rally up to 19600 in today's session. in case nifty trades above 19770 level then the upside target can go up to the 19890 level.

Review and plan for 17th November 2023- GAP STRATEGY- EnglishNifty future and banknifty future analysis and intraday plan.
This video is for information/education purpose only. you are 100% responsible for any actions you take by reading/viewing this post.
please consult your financial advisor before taking any action.
----Vinaykumar hiremath, CMT

NIFTY--Inverse Head and shoulders Pattern??I am sharing the important levels of Support and Resistance. These levels play a crucial role in trading decisions, as they act as reliable markers of price movements.
------>>Support levels are price points where an asset tends to find buying interest, preventing it from falling further.
---->Resistance levels, on the other hand, are points where selling pressure typically prevents the asset from rising higher.
They serve as key reference points for technical analysis.
Nifty 50 Analysis from COVID-19 LowsNifty 50 Analysis from COVID-19 Lows:
Primary Wave (1): Think of this like a big upward movement on a rollercoaster that started on March 23, 2020, when the Nifty 50 index was at 7511.10. It reached a high point on April 27, 2020, at 9889.05.
Wave (2): After the first exciting ride, there was a dip. This dip ended on May 18, 2020, with the index at 8806.75, which was about halfway down from the highest point of Wave (1).
Wave (3): Then came another exciting ride, but this time it had a lot of ups and downs. Wave (3) ended on October 18, 2021, at a high point of 18604.45.
Wave (4): After the thrill of Wave (3), there was a pause. Wave (4) acted like a rest stop and finished on June 13, 2022.
Wave (5): Now, it's moving up again, but not smoothly. It seems like it's going in a pattern of three steps up and three steps down, like climbing stairs. Currently, it's in the fourth step.
Big Event: The chart suggests that something significant might happen when the index reaches around 20600-20900-21000. It's like saying, "Hey, there might be a big turn or surprise on the rollercoaster around this point." So, it could be a good idea to think about taking your gains or profits when it's near 20.5k.
Just remember, investing in the stock market can be unpredictable, and it's wise to speak with a financial expert or do thorough research before making any investment choices.

#NIFTY Intraday Support and Resistance Levels - 16/11/2023Nifty will be gap down opening in today's session. After opening nifty start trading below 19660 level and then possible downside rally up to 19540 in today's session. in case nifty trades above 19690 level then the upside target can go up to the 19810 level.

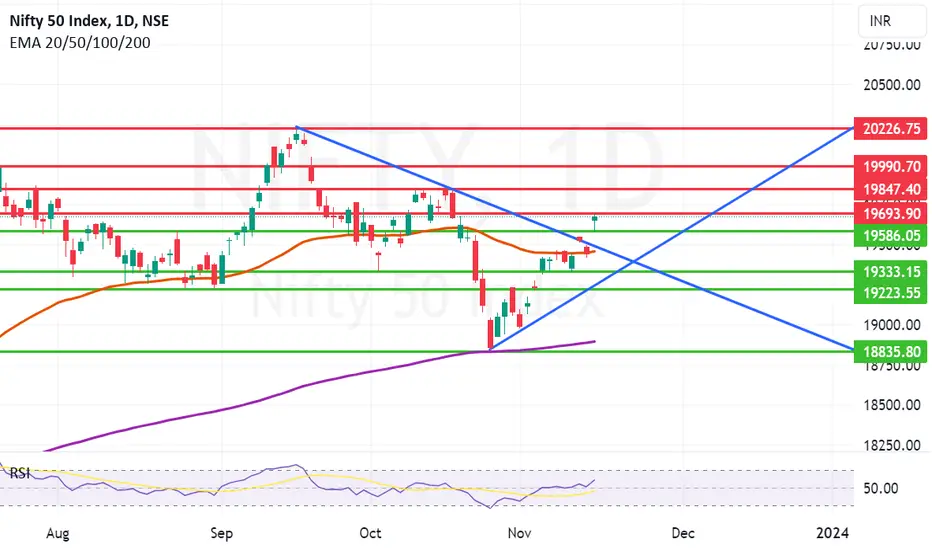
Perfect Breakout with one major hurdle to cross.It is a perfect breakout as we had predicted yesterday. As we had said you will find Nifty between 19600 and 19700. Nifty today made a high of 19693 and finished strongly at 19675. The next major resistances are at 19693, 19847 and finally 19990 until we are back above 20K levels. The investors should be cautious of 2 things.
1) Rate hike by US Fed in December FOMC.
2) Further major escalation in Israel - Palestine crisis which could make it a Multi-polar fight.
In case of above developments the supports for Nifty will be near 19586, 19456, 19333, 19223 and finally the support zone between 18893 and 18835.
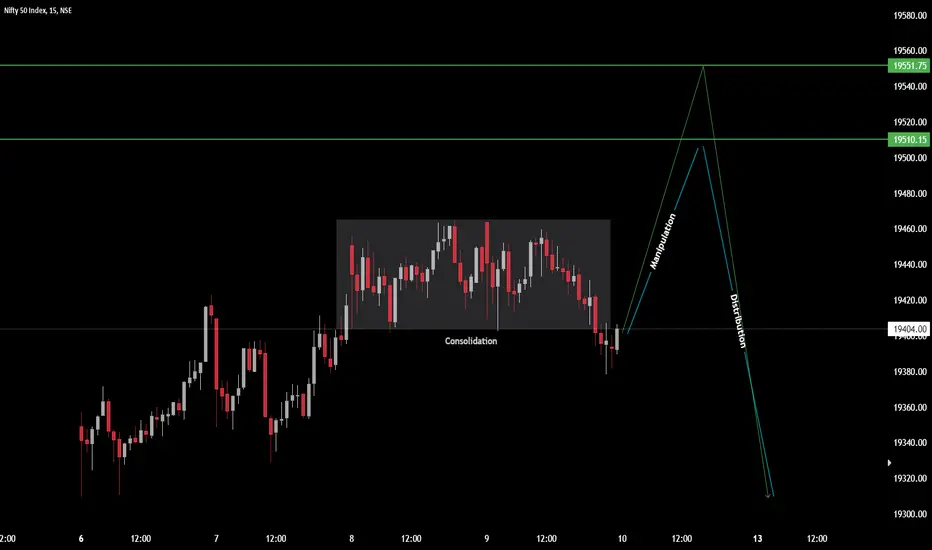
NIFTY--@Manipulation??I am sharing the important levels of Support and Resistance. These levels play a crucial role in trading decisions, as they act as reliable markers of price movements.
------>>Support levels are price points where an asset tends to find buying interest, preventing it from falling further.
---->Resistance levels, on the other hand, are points where selling pressure typically prevents the asset from rising higher.
They serve as key reference points for technical analysis.
Still it has some more bullishness before going to fall...Early shorts (sellers) will be out with this move...Keep safe on bottom demand lies at 360 zone as marked yesterday...if tomorrow comes looks for buy only... .
NIfty50 Levels for 12-11-2023 MuhuratNSE:NIFTY Intraday Levels for 12-Nov-2023
Wizard Levels/Zones
>Hey buddy, Wait for the price to close above or below-mentioned zones. Once the price closes above or below, SUPPORT becomes RESISTANCE and RESISTANCE becomes SUPPORT.
> If you're following these zones then kindly follow the rules too. Risk management, and Position sizing.
> This is my perception of the market so, kindly do your analysis to get more clarity on the market.
> These levels might help you guys. As per my view, I'm sharing it with you guys.
> This is not a blueprint to happen, so kindly do your own analysis and my view. Thank you for your SUPPORT

NIFTY -- CONTINUATION OR REVERSAL?Nifty has given a good rally after retesting 18800, and is now approaching overhead resistances. With 50 EMA, 0.618 Level and around 19500, nifty seems to be at a congestion zone where it should consolidate for a couple of days.
FED chairman Powell is expected to speak twice this week and should provide with enough triggers for the market to decide the direction of movements.
Overall, this consolidation should be healthy to help in the next round of rally after the events this week.

NIFTY--19500 Is Resistance?? price broken the trendline and retested...then gap down or gap up.
we have a strong demand zone at 19360level...price may again rise from this level..
previously 19500 is a strong resistance,
if price again acts as resistance in this zone will observe a fall up to 19300 and 19200 levels.
otherwise price breaks the resistance and have chances of testing the 19600 and 19700 levels.
keep safe before short....wait until it touches the resistance resistance level @19500.

NIFTY Prediction for 9th NovAs we discussed, a neutral view of NIFTY moved sideways the whole day by gaining +36 points.
Right now, NIfty is at a really crucial point where it might go from the 19550 to the upside, where it might face the 4H-TH trendline as resistance. Tomorrow's nifty has expiry, which means it might be sideways with high probability. Expiry is likely to end in 19350-19450.
Reason:
Expiry day for Nifty (Mostly Sideways)
50 EMA day TF resistance to upside. (Resistance)
Price > EMAs (Bullish)
RSI is 40-60 mostly Sideways.
Price action resistance to upside at 19460.
PCR = 0.88 (Neutral) (Put:Call Ratio)
Verdict:
Sideways
Plan of action:
don't go for option Buyiing. let it make the range and then make iron condor.

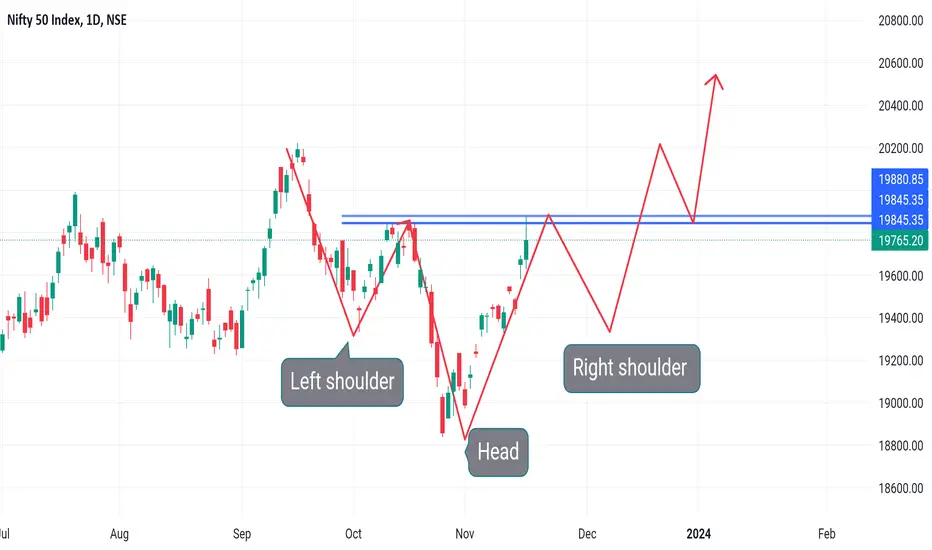
Nifty Head and shoulder patternNifty formed a Head and shoulder pattern and now in retesting area, new sellers can enter with conservative mind. Target mentioned in chart kindly check it.

Nifty prediction, Will Continue the Bullish trend?As Nifty has been continuously increasing for the past four days, it has been purely seller day. The market is consolidating in a range of 70-80 Points. We have performed Top a top-to-bottom approach where we see a trendline that is marked over the chart. Nifty seems to touch the 19550 levels by this week's expiry.
Reason:
Price > EMA(13,50,200) (Bullish)
Golden crossover (Bullish)
PCR = 1 (Bullish)
RSI > 60 (Bullish)
200 EMA support downside.
Verdict:
Bullish
Plan of Action:
Sell PE on lower Points. Don't go for option Buying based on the last four days moment.

NIFTY--Head & Shoulders Pattern ??I am sharing the important levels of Support and Resistance. These levels play a crucial role in trading decisions, as they act as reliable markers of price movements.
------>>Support levels are price points where an asset tends to find buying interest, preventing it from falling further.
---->Resistance levels, on the other hand, are points where selling pressure typically prevents the asset from rising higher.
They serve as key reference points for technical analysis.
Nifty is at important zone of resistance...If price fail to take the support at 19360 levels again and falls below this level, we have a chance of H & S pattern, keep safe before long.

Good jump but more distance to go post consolidation or gap up. As Depicted yesterday we crossed level 1 resistance and ended just below resistance level 2. Level 2 resistance was 19413 and we closed to 19411. Once we get a closing above 19413 the next level will be 19562. Supports for Nifty now are at 19353 and 19276. Things still looking positive either we jump above the resistances we can progress very fast towards 19681 and 20K levels.
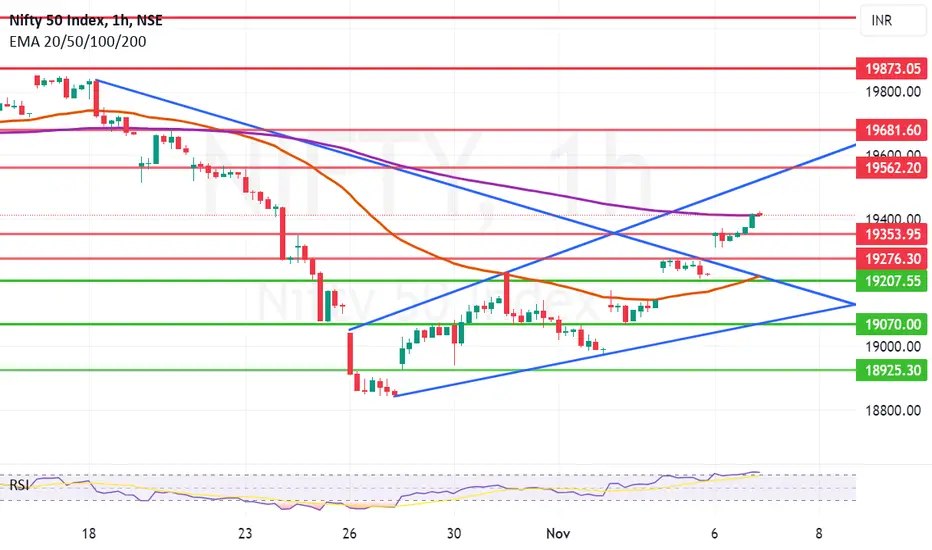
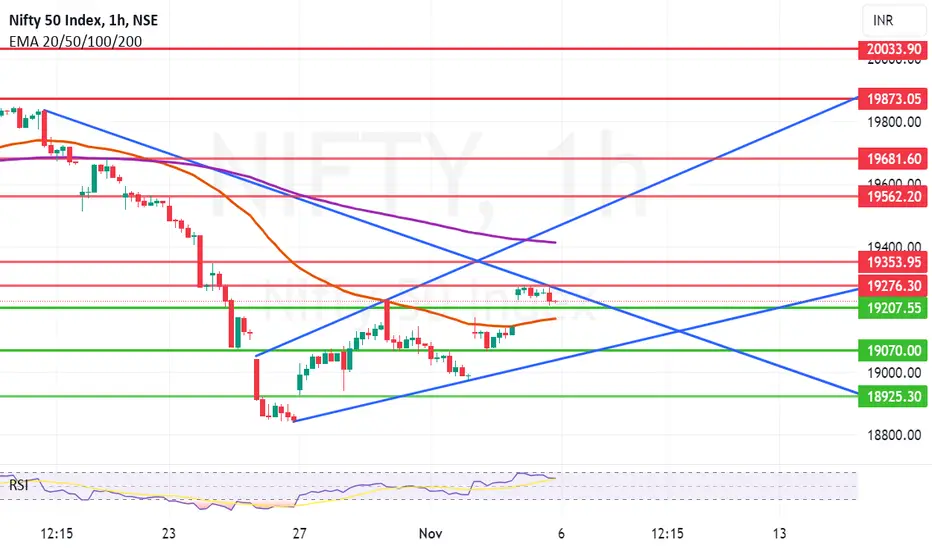
Nifty positioned nicely in a positive open mouth channel.Nifty is positioned nicely in a positive open mouth channel. Crossing and closing above 19726 can start a positive wave in Nifty which will have resistance at 19353, 19413, 19562 and 19681. Supports for Nifty at the lower level are 19207, 19170 and 19070. Things are looking good for a positive Diwali and Muhurat buying. Let us hop that all the positive levels are crossed and we get a closing close to 20K during the Muhurat session or post Muhurat session.
NIFTY INDEX OUTLOOKNSE:NIFTY
Nifty 50, in the hourly chart, is in the final leg of correction, forming a zigzag corrective pattern of 5-3-5. It has completed wave 3 of wave C at 18837.85. A triangle pattern is in formation in wave 4 of wave-C, which can go up to 19315 - 19360 region. For major correction to complete, Nifty 50 is likely to form a new low of wave 5 of wave C between 18740 - 18640, where it also has gap support.
CRUCIAL LEVELS
INTRADAY: 19244, 19235
DAILY:19195, 19125

NIFTY--19000 or 19300I am sharing the important levels of Support and Resistance. These levels play a crucial role in trading decisions, as they act as reliable markers of price movements.
------>>Support levels are price points where an asset tends to find buying interest, preventing it from falling further.
---->Resistance levels, on the other hand, are points where selling pressure typically prevents the asset from rising higher.
They serve as key reference points for technical analysis

#NIFTY Intraday Support and Resistance Levels - 03/11/2023Nifty will be gap up opening in today's session. After opening nifty sustain above 19170 level and then possible upside rally up to 19270 & This rally can extend another 100-120 points if market gives breakout of 19290 level in today's session. in case nifty trades below 19130 level then the downside target can go up to the 19010 level.

Nifty forming a good channel on hourly chart. Nifty is forming a good channel on hourly chart and things are looking positive for now. Once the Nifty crosses and closes above small resistance of 19145 and 19177 and hold that support. (It is very much possible that Nifty opens gap up above 19177 which will be very good technically, the next targets for spot nifty will be 19230, 19353 and 19425. Support on the lower side are at 19070, 19007 and 18935. Expecting a good closure to the week as things right now look positive. Some big negative news from Middle East can still spoil the party so be cautious.
