NIFTY--Breakout or Fakeout??I am sharing the important levels of Support and Resistance. These levels play a crucial role in trading decisions, as they act as reliable markers of price movements.
------>>Support levels are price points where an asset tends to find buying interest, preventing it from falling further.
---->Resistance levels, on the other hand, are points where selling pressure typically prevents the asset from rising higher.
Take a look at these levels and trade accordingly. Recognizing and respecting these support and resistance levels can help traders make informed decisions and manage risk effectively. They serve as key reference points for technical analysis and are vital tools in successful trading strategies.
Trade safe...Thank you guys for your support.
Niftyview

NIFTY--Retracement or Reversal??The NIFTY index again showing bearishness, with gap down opening.
Now price is exactly at the golden zone of Fibonacci retracement.
If price takes u turn from this level to the upside...index is once again breaks the ATH to reach 20500 levels soon.
While going to upside price is showing some sort of consolidation in the levels 20000 and 19700 levels.
So take care this is the crucial zone,
if this zone failed to take the price upside,
wait for the price to break this zone below and wait for the retracement to enter short for continue with the trend.
Keep in watch mode for couple of days.
On top side, price breaks the trendline, it may retest and fall or rise.
ATH is not strong, weak ATH is observed on topside.
All these points are showing bullishness in NIFTY.
Note:: Until price breaks this zone, consider it as a retracement.

Once Again Nifty At Critical Support zone.Nifty Support zone is in between 19655 and 19544. A bounce back can be expected from any point within this zone. If the support at 19544 is broken then the bears will take further control of the market and drag it further down to 19224 or below. On the upper side the resistance levels for Nifty are near 19851, 19991.

Shakeout at the ATH - NiftyWeekly Timeframe:
1. Engulfing candle: Depicts bearish sentiment, trend reversal indication.
Daily Timeframe:
1. Climax Top: 11 consecutive highs followed by selling. This is one of the characteristics of trend reversal; it is often accompanied by exhaustion, a sudden spurt in volume, and then selling like falling knives.
2. Heavy selling: distribution Signs are reflected through the volume.
Reasons,
1. Rise in Crude Oil Price
2. Inflation Fear
3. FII-Sell off 121367 Cr
Way forward,
Support Levels,
S1: 19200
S2: 18600
Trade Opportunity,
1. Niftybees: Hold
2. Futures & Options: Monthly Straddle

Nifty - Wave CountNifty 50 - Elliott wave count
It appears that the Nifty50 market is nearing the end of Wave A, and once it is completed, there is expected to be an upward movement towards Wave B targets between 19900 and 20000.
After that, Wave C is anticipated to begin with a target of 19300 or lower.
NSE:NIFTY NSE:NIFTY1! NSEIX:NIFTY1! VANTAGE:INDIA50

Nifty - Ready for another dropNSE:NIFTY
NSE:NIFTY1!
NSEIX:NIFTY1!
Nifty - Seems like its ready for final correction wave.
for educational purposes only

Will NIFTY hold this level?As we have have been discussing nifty fall. Now nifty has come to the 0.5 Fib Level 1H-TF.
yesterday it has also proven as support point whole day. we are assuming that it might take support from this point.
Reasons :
RSI is very low that indicate the weak strength of the trend. and at the same time Oversold the Market.
Nifty is taking support at 0.5 Fib level of 1H-tf.
200 EMA is also coinsiding with 0.5 Fib level that makes it more strong point to take support.
Its nearby VWAP so we can say price is avraged out. now Buyers might come in the market.
PCR is 0.89 - Neutral
RSI bullish divergence.
Verdict :
Observe initial 15 min trend.
Plan of action:
Based on observence of inital market moment. Place a Neutral trade.

Nifty took support at a very important level today. Nifty took support at a very important support zone. The level being at 19709 to 19694. 19709 was today's law. If the support zone is broken the next support levels are at 19538 and 19224. If 19224 is broken we may see bears take a total control. Major support after 19224 will be near 19050 and 18900 and finally 18638. (Very unlikely that we reach there). The resistances on the upper side are at 19848, 19991 and finally 20203.

NIFTY--Bearish Gap or Bullish Gap??I am sharing the important levels of Support and Resistance. These levels play a crucial role in trading decisions, as they act as reliable markers of price movements.
------>>Support levels are price points where an asset tends to find buying interest, preventing it from falling further.
---->Resistance levels, on the other hand, are points where selling pressure typically prevents the asset from rising higher.
Take a look at these levels and trade accordingly. Recognizing and respecting these support and resistance levels can help traders make informed decisions and manage risk effectively. They serve as key reference points for technical analysis and are vital tools in successful trading strategies.
Trade safe...Thank you guys for your support.

NIFTY--Trendline Break?? The price has recently breached the trendline, signaling a potential shift in momentum. If the price provides a retest opportunity tomorrow, we may consider entering a short position. In the absence of a retest, we will wait for a pullback before considering a short entry.
On the downside, we have identified support levels at 20050 and 19950. We will remain in a long position until the price convincingly breaks these levels and undergoes a retest, confirming a more bearish outlook.
Keep safe before short...

Nifty and Banknifty : Trend bearish for 19 SeptemberDue to Upcoming Parliamentary extra session and upcoming fed policy market is showing a little profit booking at the top and is expected to continue for the same.
Nifty and banknifty both have a sell on the rise pattern so follow the same as mentioned in the video

NIFTYBANK: Musch desired "IRR'A-tionalIn recent times trades faced glitches on execution, many incurred heavy losses. the new platform by the regulators, Investor Risk Reduction Access (IRRA) platform to address technical glitches and outages is a welcome move. However, this is not available to the ALGO traders. This clearly helps the novice traders as well as classical traders, to reduce this risk. It is always the case of new risks emerging and there is no reason why there will no zero risk at any point of time. While we talk on IRR, the irrationality of the markets remains. Nifty bank is in its path to ATH. The only hurdle is tomorrow being the holiday. Will that stop the bulls from piercing to the ATH. The PSU back reverts to the bullish view all over, still does not appear to be a crowded space yet. It is more like, I missed it this space. Incoming FED meet, elevated Crude prices, and rising US Yields as well as the US Dollar are some of the concerns, but they are collectively not a consideration to change the trend. The question is will it be a vertical move up for ATH or will there be a correction before the climb. This space is known for the U turns at crucial areas, despite the underlying trend being continuation. This can potentially be true this time also. However, that is an opportunity to get the bags of bulls. 45800-46500 is the new range, out of the old range just two months back. Bias to the upside, basing around 46080-45880.

Buy around 20040 & 19960 TGT 20220/20800 sl below 19800The Market gave a good rally in past three weeks making 3 white soldiers on the top of the chart indicating a fresh breakout but in upcoming Fed's policy and parliamentary session will be watched closely by the market and it can consolidate to cool of some overheated indicators and then we can see a further breakout.
Market structure remains bullish but some consolidation is indicated because of upcoming events and then again may resume the uptrend

NIFTY - Target Levels - 18.09.2023.Nifty Spot : 20169. Option Strike : 20200 CE & 20200 PE
I Am Not Sebi Registered Analysis, This Is Education Purpose Only.
Dear Followers..
Kindly Watch My Break Even Point. Every Day.
Above The Break Even Point.. Resistance Break.. UPTREND Starts.. Buy CE..
Below The Break Even Point.. Support Break.. DOWNTREND Starts.. Buy PE..
Stop Loss... Above or Below.. Break Even Point..
Don"t Enter Blindly.
We Focus On Our Daily Analysis..
Combination Theory Of Delta, Gamma & Thetta,.
Selection Of OI Analysis & Prediction Of Entry, StopLoss, & Targets,
Fibinacci Retracement Levels, Techninal View On Break Even Point.
Wait For Support or Resistance Breaking.. That Time Watch The Market Carefully.
Market Moves in UpTrend or DownTrend.
Kindly Watch Both The Nifty Target Levels & Bank Nifty Target Levels in your Trading View.
Its Most Important For Daily Tradings….
BY : newsbharathi27040.

Pin point prediction Of Bharat Forge For 18 to 22 Sep 23Hello Traders,
This is my trade plan for next week in this stock complete marking and would be followed cases marked for detail check below.

Nifty consolidation Prepration of Fall?as we have discussed in our last posts, NIFTY is consolidating in the assending trangle or Rising wedge . which is a netrual pattern. by looking at the formation of the pattern it seems the prepration of the upcoming pull back to downside.
Reasons :
Option chain PCR: 1.22 (Bullish)
Consolidating in the assending trangle or Rising wedge which is netrual pattern might break to upside and also to downside. As this consolidation is after a long Bullish moment. there is higher probablity is will take a pull. back to downside.
RSI is in the bullish range.
VWAP >> Price
Verdict :
Consolidation in the rising wedge.
Plan of action:
Sell 20200 CE and SELL 19950 PE

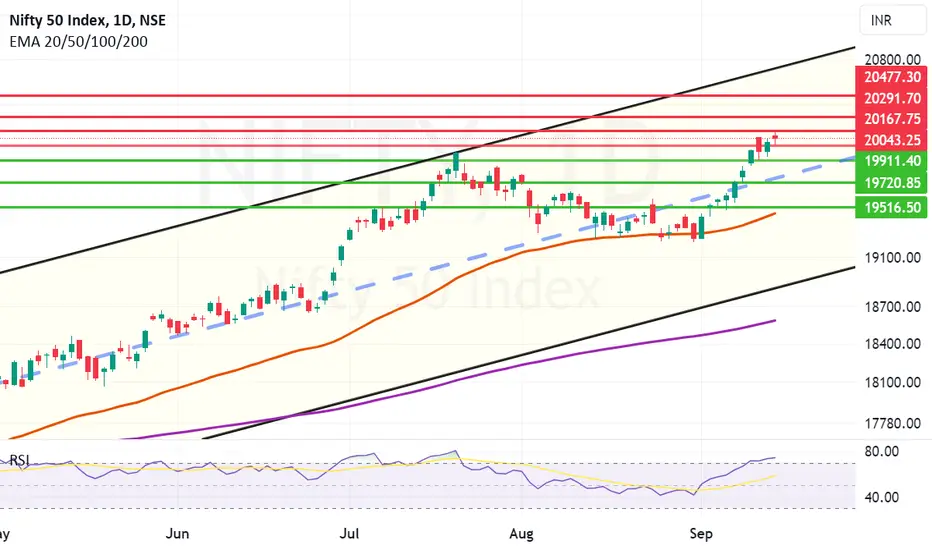
Doji of indecision starting to form. With RSI at 74.3 there is a Doji formed after yet again Nifty making new record high of 20167. Nifty closed at 20103 indicating too much heat / resistance in the range of 20167 and 20200. If we close above 20200 the next target will be 20291. Supports for Nifty at the lower side will be near 20043 and 19911. Closing below 19911 can drag the Nifty to 19720 levels. Nifty may start positively but later in the day or next week there can be profit booking pressure as RSI will inch closer to 80 and above.
NIFTY S/R LevelsI am sharing the important levels of Support and Resistance. These levels play a crucial role in trading decisions, as they act as reliable markers of price movements.
------>>Support levels are price points where an asset tends to find buying interest, preventing it from falling further.
---->Resistance levels, on the other hand, are points where selling pressure typically prevents the asset from rising higher.
Take a look at these levels and trade accordingly. Recognizing and respecting these support and resistance levels can help traders make informed decisions and manage risk effectively. They serve as key reference points for technical analysis and are vital tools in successful trading strategies.
Trade safe...Thank you guys for your support.

nifty pre market analysis14 SEP ANALYSIS:
Daily analysis:
PS-Position size
Nifty opens:
side: if it gives breakout buy(50)
gapup: see further price-action
gapdown: no trade
big gapdown: sell on breakdown
Banknifty
side: if it gives breakout buy(50)
gapup: see further price-action
gapdown: no trade
big gapdown: sell on breakdown

Nifty held ground but blood bath in Mid and Small Cap indices. There was a mayhem in the market as Small and Mid-cap indices faced heat today after flying high for last few weeks. Nifty ended 3 points in the negative but the story of the day was being written elsewhere. Heavy selling and Profit booking was seen in Small and Mid cap indices. Support for Nifty will be around 19911, 19720 and 19516. Nifty turns negative if we get a closing below 19409. Resistances for Nifty on the upper side will be at 20128 and 20291.

NIFTY--Sustain or Decline??The price has recently broken its all-time high (ATH) with strong momentum. Following a significant upward surge, it found support at the previous resistance level and continued its upward trajectory.
However, today, it failed to break the recent high. The outcome of tomorrow's trading session will be crucial for NIFTY's ability to maintain its position above the ATH. If the price fails to resume its upward movement tomorrow, it could attract selling pressure, potentially leading to a downward trend.
Therefore, tomorrow's price action holds significant importance as it will determine whether NIFTY can sustain its position above the all-time high. A failure to move higher could prompt bearish sentiment and open the possibility of a short-term decline.
Trade safe...

NIFTY--13-09-23I am sharing the important levels of Support and Resistance. These levels play a crucial role in trading decisions, as they act as reliable markers of price movements.
------>>Support levels are price points where an asset tends to find buying interest, preventing it from falling further.
---->Resistance levels, on the other hand, are points where selling pressure typically prevents the asset from rising higher.
Take a look at these levels and trade accordingly. Recognizing and respecting these support and resistance levels can help traders make informed decisions and manage risk effectively. They serve as key reference points for technical analysis and are vital tools in successful trading strategies.
Trade safe...Thank you guys for your support.

NIFTY 15 Min TImeframe Symmetrical Trangle PatternNifty forming a Symmetrical Triangle Pattern. Sooner or later it'll break out or break down.
