Nifty 50 Strategy for 29 Sep 2022Nifty 50 Strategy,
16915 above going long for 17009 17110 17243;
16875 below going short for 16774 16661 16562.
Niftyview

NIFTY PSYCHOLOGY - WHAT's COOKING?In this brief video -
1. What happened in last 2 sessions?
2. My views for coming days.

Nifty 50 Strategy for 28 Sep 2022Nifty 50 Strategy,
17000 above going long for 17079 17110 17156 17310;
16975 below going short for 16924 16774 16632 16475.

Nifty Head & Shoulder Target 16500 Break ShortADX Power
thursday expiry
Fundamentals Weak Technical Analysis
Inflation high
Russia Ukrain Global issue
Short till 16500

NIFTY TGT reached - What next?In this video -
1. Current position status.
2. Psychological level justification
3. Upcoming days/week views
Please do like, share & subscribe.
Also do comment your views for upcoming days/weeks.

Nifty 50 Strategy for 27 Sep 2022Nifty 50 Strategy,
17065 above going long for 17080 17156 17188;
17020 below going short for 16917 16774 16661.

Nifty 50 Strategy for 26 Sep 2022Nifty 50 Strategy,
17325 above going long for 17436 17593;
17310 below going short for 17243 17488 17079 16924

Nifty Analysis for this week 26.09.2022 to 30.09.2022As I posted a chart of nifty earlier performing the same way till now.
from here it might give a little back and continue the same trend
please follow me here. that encourages me to post more charts to guide you.
thank you !!

NIFTY might bounce back tomorrow from Demand zoneNIFTY might give a fight back and recover slightly if it stays within the Demand zone as shown in charts.
Second half we might see some Selling coming in by FIIs. Trade with caution.
Not a recommendation, just an observation.


NIFTY Buyers trapped - PsychologyIn this video -
1. Market move - Psychological level - Buyers trapped
2. Current trade positions - Trade Management
3. Views for upcoming week - Highly bearish as dip buyers badly trapped
Please do boost, like, share & subscribe.
Also do comment your views for upcoming days / weeks.

Nifty 50 Strategy for 23 Sep 2022Nifty 50 Strategy,
17710 above going long for 17766 17796 17889
17680 below going short for 17601 17540 17485 17414

Nifty Head & Shoulder Target 17500 Break ShortHead & Shoulder
ADX Power
Fed rates
till 200 EMA Target
Fundamentals Weak Technical Analysis
Inflation high
Russia Ukrain Global issue
RECENT USA UKRAIN multi billion help to army
Short till 17000

FRESH SHORT IN NIFTY ADDED 17712 levelsFirst video in Hindi
Please give a like if you want me to make more videos in HINDI.
Also do comment for HINDI in future.
In this video -
1. Fresh chart update & new TGTs
2. Fresh short position and plan around the levels
Please do like, share & subscribe.
Also do comment your views and levels for upcoming days & weeks.

NIFTY update after gap up and sustainIn this video -
1. Chart update.
2. Key resistance & support area for trade.
3. Remaining 50% short position update with SL condition.
Please do like, share & subscribe!
Also do comment your views & levels for upcoming days & weeks.

Booked 440 points in NIFTY!Market was kind!
Booked 50% short position near 17627 levels today!
Around 440+ points booked and also holding few more for full TGTs!
New support trend line in video!
Watch level area 17627 for Monday for resistance or support!
Please do like, share, subscribe!
Also do comment your view and levels for upcoming days & weeks!
Further overall plan is to keep shorting in higher levels!

Tomorrow nifty levels In nifty also our view was bearish. Our analysis says that it touch 17659 17550
Sell nifty below 17860
Target 17827 17777 17726 17627(major support zone)
Sl 17969
Buy nifty above 17970
Target 18027 18093 (major resistance) 18115
Sl 17943
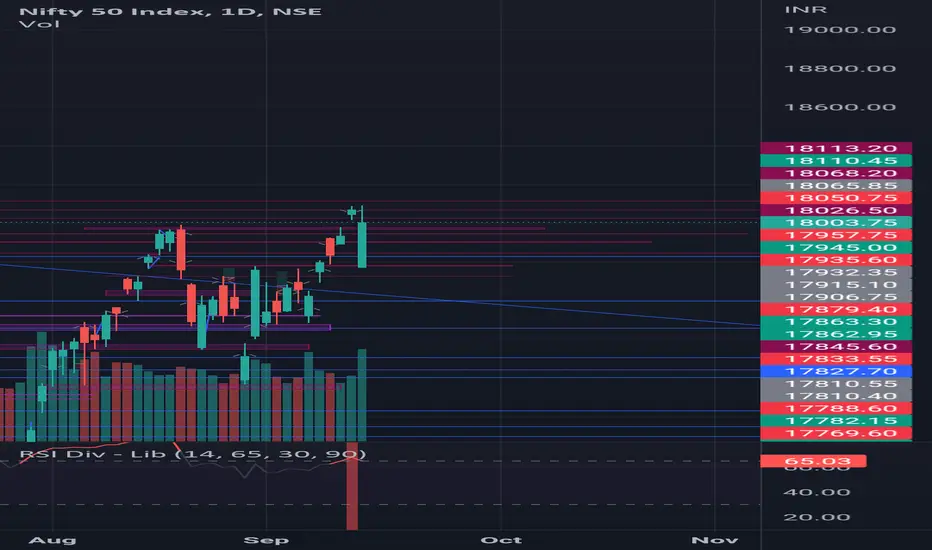
NIFTY gave easy short levels again today!NIFTY shorted around 18090 levels!
Total fresh short average (18050 + 18090)/2 = 18070.
Important levels to watch 18064 / 17924 / 17628 / 17264 price areas.
In this video, discussed resistance area faced since last 2 days & today as well.
Also, channel trend line support tested in today's session.
Crucial level to watch tomorrow 17924 area!
Please do like, share & subscribe!
Also do comment your view for upcoming days & weeks!

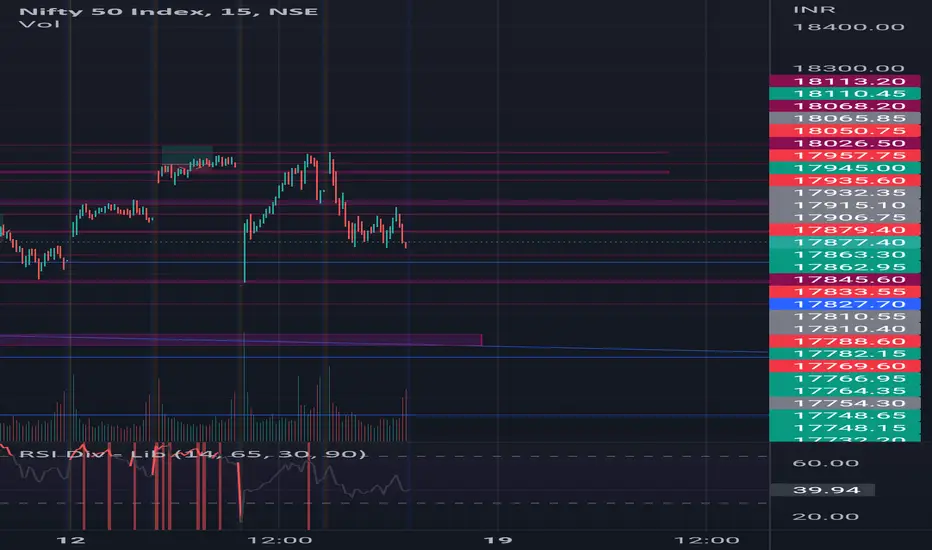
Tomorrow nifty levels Sell nifty below 17965
Target 17945 17902 17845 17777
Sl 18090
Buy nifty above 18019
Target 18069 18091 18113
Sl 18965
our analysis says that now the reverse gear of nifty start
our Target 17728 17752.
Nifty daily analysis for 14/09/22Nifty has closed just near the 18000 level and after the gap down tried to touch the level of 18100.
In the last hour nifty lost and around 90 points.
The market has taken a nice support from hourly 20 ema and closed just above the level.
On the 15 minute time frame, the market has closed between the 20 and 200 ema.
The market opened gap down due to the CPI inflation hike. Even dow closed around 3% lower.\
Support :-17965-990, 17923, 17832
Resistance :- 18020,18060, 18140
The markets are quite volatile and can remain in the same mood. Tomorrow is the weekly expiry, a trending market can be there in the second half of the trading session.
Wait for the price action near the levels before entering the markets.

Nifty Trade Setup idea for 12-September-2022Nifty, similar to Banknifty was volatile on Friday, though there was a gapup, it closed lower.
- Today, if there is a gapup above 17850 or gives a 5 minute candle close above 17850, then I would go long with half quantity. Since there is another resistance around 17900 levels.
- If the price breaks 17800 levels, then I would short with a stop of 50 points and first target around 17700 levels.

update on nifty 50 analysisi had previously posted the same analysis of nifty 50, and here i have brought you an update.
markets are in bull rally, and i guess a sort of bull rally is gonna over after going up by 50-100 points.
after that if the markets rise further(which has a good chance because fii are entering), so that will not carry the bull rally, it will just be a bullish nature, i believe such because the market had got its impulse movement from this rally. and on top of that, nifty chart has covered all the international news as such. plus, fii have sold there stakes and made there profits, now they are re- entering the markets.
and if the markets falls, then it will say, people have yet to make out the profits, and they will realise there profits by selling.

Nifty in a bull run.wave are too mentioned, with its currentions. plus its gonna reach its target, and completing its bull run somewhere around 10th-15th sept. analysis done till that only. let see what happens next...
