Nifty Intraday Analysis: 05-Feb-24Nifty near @Support Zone ..Wait for rejections or breakout of S/R Zones.
Bullish>21900
Bearish< 21750
All views for Educational Purpose do your own analysis before initiate trades.
Niftyview

Flat correction in niftyNifty may have/ completed wave b of the Flat correction.. it can still go for 22300-400 levels but w=y equals at exact high..
So we can fall 1000 points again in the coming week..
Risk reward look excellent if todays closing is below 22124.

NIFTY--Double Top??Nifty index is created a demand zone at bottom levels...
strong consolidation is observed today on top at Supply zone, liquidity grab is also done above the same supply zone...
if it forms a double top here it is likely to test the demand zones lies below 20800 levels
if it failed to make it, then a long continuation may again happens from 21300 levels....
keep safe from this zones.
------------------------------------------------------------------------------------------------------------------
I am sharing the important levels of Support and Resistance. These levels plays a crucial role in trading decisions, as they act as reliable markers of price movements.
------>>Support levels are price points where an asset tends to find buying interest, preventing it from falling further.
---->Resistance levels, on the other hand, are points where selling pressure typically prevents the asset from rising higher.

NIFTY50_01FEB2024Prediction Next three months:
Level: Alert
Action: Accumulate funds for long term investment
Nifty50 seems at cautious levels. It seems like market was expecting a boost from interim budget with various schemes , specially for infra boost. Budget has a sufficient amount of fund allocation with continuation to growth and GDP figures achievement plans.
But this isnt enough for nifty to cross 22000 levels. Execution from companies need to be fast tracked. New players need to involve in market. Retail, Private and Public partnership could lead to further growth. Next boost is expected with three main expectations:
1) JPM's inclusion of Indian bond market (JUNE 2024)
2) FED and RBI cut in interest rates
3) Main budget after election.
Formation of current government again after election is already absorbed by market. Now if current government is not re-elected or elected with less majority compared to previous election, than it may lead to failure in market prospectus and a bigger correction upto 18800 levels may be seen.
For time being, expect a level of 20050 soon. Period of 1 FEB to 1 May is crucial.

Analysis for a Swing Position in Nifty.
Price has reacted to the Sourcre Daily Demand and has headed towards its Destination of Daily Supply.
This is the Demand and Supply Equilibrium Curve showing us the levels
As Traders we gotta Buy low and sell high
This is a Buy Trade with a substantial Reward to Risk Ratio.

NIFTY--Gapup or Gapdown??
Price is exactly closed at trendline resistance... which is also a strong resistance...
I am sharing the important levels of Support and Resistance. These levels plays a crucial role in trading decisions, as they act as reliable markers of price movements.
------>>Support levels are price points where an asset tends to find buying interest, preventing it from falling further.
---->Resistance levels, on the other hand, are points where selling pressure typically prevents the asset from rising higher.
Take a look at these levels and trade accordingly. Recognizing and respecting these support and resistance levels can help traders make informed decisions and manage risk effectively. They serve as key reference points for technical analysis and are vital tools in successful trading strategies.
Trade safe...Thank you guys for your support

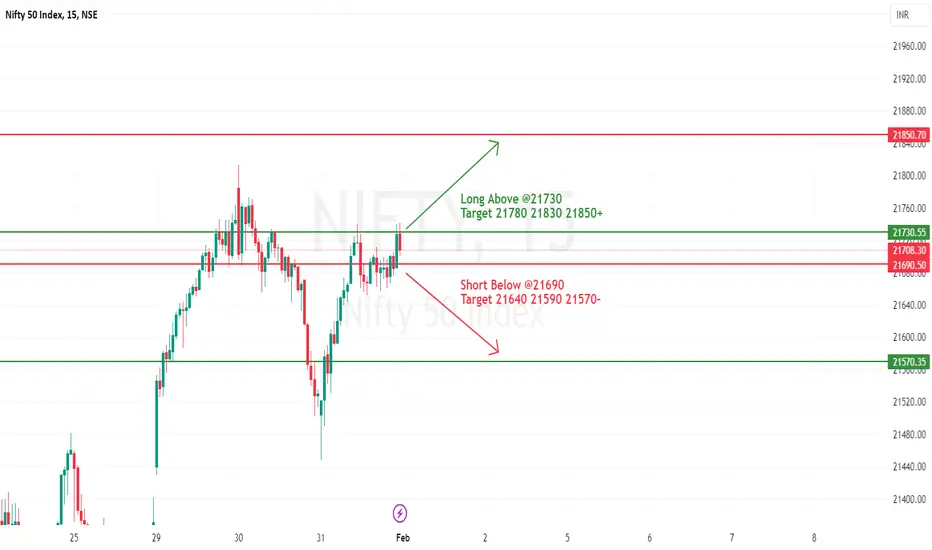
#NIFTY Intraday Support and Resistance Levels -01/02/2024Nifty will be gap up opening in today's session. After opening nifty sustain above 21730 level and then possible upside rally up to 21850 level in today's session. in case nifty trades below 21690 level then the downside target can go up to the 21570 level.
NIFTY--22000 0r 20800 ??I am sharing the important levels of Support and Resistance. These levels plays a crucial role in trading decisions, as they act as reliable markers of price movements.
------>>Support levels are price points where an asset tends to find buying interest, preventing it from falling further.
---->Resistance levels, on the other hand, are points where selling pressure typically prevents the asset from rising higher.
Take a look at these levels and trade accordingly. Recognizing and respecting these support and resistance levels can help traders make informed decisions and manage risk effectively. They serve as key reference points for technical analysis and are vital tools in successful trading strategies.
Trade safe...Thank you guys for your support

NIFTY 50 Intraday sellNifty 50 - HH to come to correction .
Expected Level - 21600
Strong support - 21500
15 min Support Break .Next stop 21600 ..

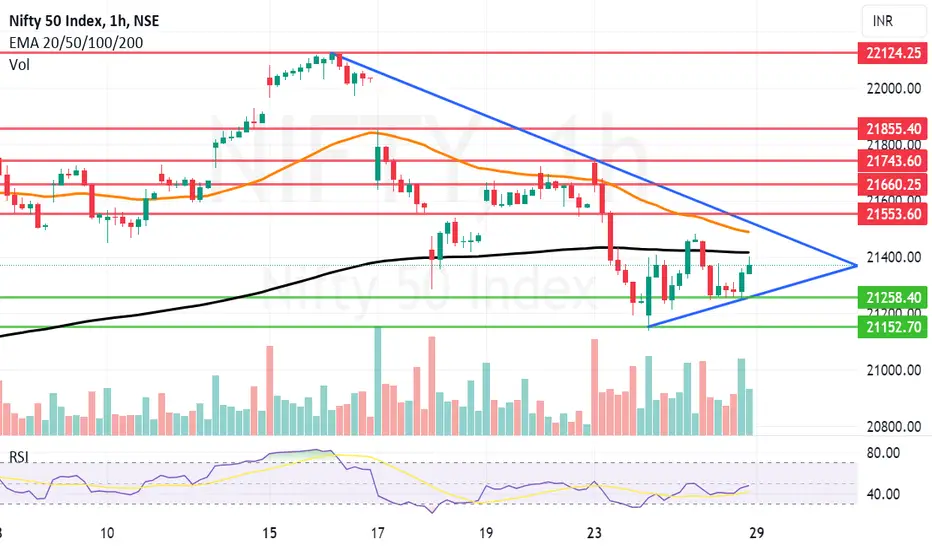
Trendline resistance 21800 works again to pull Nifty downTrendline resistance 21800 works again to pull Nifty down. This only shows that the strength of rally decreasing with extreme increase in volatility. There was a news of situation escalating in Middle East and US striving to take some action against the mess created by some disruptive forces in the Red sea. With this news there was selling and profit booking seen specially from the FIIs and Retail investors however DII remain net buyers and gave support to the market near 21500. How much support they can provide going deeper into the week is the question.
Nifty Supports will be at: 21500, 21448 (Major Support 200 hours EMA), 21258 and finally 21152. Below 21152 bears will start licking their fingers.
Nifty Resistances are ate: 21562 (Major resistance 50 hours EMA), 21660, 21723 (Major trendline resistance) and 21800-21820 range.

Nifty--Consolidation or Bullish??After a strong Bearishness from the supply zone @21700 levels price gives us some retracement to enter again shortside...
If tomorrow price opens up try to be on short side from 21550-21500 levels for targets of 21000 levels.
Liquidity lies above these levels.
If consolidation happens at bottom levels then we have a chance of fallback to the bottom support at 21000 and 20800 levels be tested soon.keep in long from this levels. we have a chance of continuation down side possibility is more,trade with less quantity.

Nifty Intraday Levels : 30- Jan-24Currently Nifty Near at Resistance Zone...so wait for Rejections at zones
Bullish >21810
Bearish <21680
All views for Educational Purpose do your own analysis before initiate any trade.

#NIFTY Intraday Support and Resistance Levels -29/01/2024Nifty will be gap up opening in today's session. After opening nifty sustain above 21400 level and then possible upside rally up to 21520 level in today's session. in case nifty trades below 21340 level then the downside target can go up to the 21220 level.

Nifty Trapped between good support and strong resistance. Nifty again finds itself trapped between strong resistance zone which present between 22415 and 22488. Above 22488 Nifty can fly towards 21522, 21660 or even 21743 within this week. But crossing the 50 and 200 hours EMA at 22415 and 22448 (Mother and Father line will not be easy). On the lower side there is a strong support zone between 21258 to 21152. Below 21152 closing bears can take control of the market and thrash it further down. Nifty is interestingly poised. Nifty Shadow is positive but there was a news of Three US Marines killed in a Houthi attack on US Navy vessel. The possibility of US retaliation and escalating tension with Iran is a clear and present possibility so investors have to keep a keen eye on that development.
Nifty Intraday Levels for 29-Jan-24Currently Nifty Near Resistance zone
Bullish > 21500
Bearish < 21350
Wait for rejections at Major S/R zones.
All views for Educational purpose do your own research for any trade.

Nifty 15 Min tf Trade for thursday Nifty expiry This will help you to analyse Nifty Sentiments better and trade cautiously NSE:NIFTY

NiftyNifty Daily Chart with Fib Retracement my view is Bullish because of Retracement might be will go 20870 point one it will bullish again so buy on dip only stocks for swing not nifty or banknifty..

#NIFTY Intraday Support and Resistance Levels -24/01/2024Nifty will be gap up opening in today's session. After opening nifty sustain above 21260 level and then possible upside rally up to 21380 level in today's session. in case nifty trades below 21220 level then the downside target can go up to the 21100 level.

HDFC BANK LOOKS GOOD @ ...After A Fall of 8% Hello everyone. So in this video of Hdfc Bank, we have talked about The overall history of Hfc Bank, from the point where we have seen the split in this talk in 2019. And then after we have seen a fall, and then after we have taken a slide insight about the top it made in 2021. Then after we have seen the levels where market have been sluggish and been passing it time from last two years. So we have marked few levels with Lines, as you can see in the charts of video. And then after we have talked about the levels where we should be looking for the buy entry in coming fall, if it falls further But we are not bearish on this talk. We have buy entry possible if you can take We don't want you to take a full entry. You can try with a smaller positions, ok? And if it falls further, then we can go for a better chunk of quantity So this is all on the hdfc bank Thank you.

NIFTY--@Trendline Retest??Nifty broken the major trendline
In the previous sessions price is retested the same trendline and showing Bearishness from the supply zone.On bottom side strong demand zones lies at 20800 levels.
If this trendline acts as resistance we will observe a continuous Bearishness in nifty upto 20800 levels.
If we observe consolidation between 21700-21300, will expect a fall below 21300 and then have a rise again towards ATH.
Note:
If trendline failed to push down side, liquidity grab above the trendline will observe and a fall happens again.

NIFTY50Looking at a structure,i see this as a pull back rally to fall of 900 points in nifty recently, trend change only above 21800 till then my stance is sell on rise

NIFTY--Supply zone@21700 ??After a strong fall, expecting some retracement in nifty.
on topside supply zone is identified at 21650-21700 levels.
so liquidity is lies above and below this levels,
after testing these levels again have a chance of fallback to test the demand zones at 21300 levels and at 20800 levels.
If 21300 level fails to push it upside, quick drop and rise will see in coming sessions.
so this week mostly in this range 21700-21300 levels.
Be careful, long after 21700 short below 21300.

#NIFTY Intraday Support and Resistance Levels -20/01/2024Nifty will be gap up opening in today's session. After opening nifty sustain above 21500 level and then possible upside rally up to 21650 level in today's session. in case nifty trades below 21770 level then the downside target can go up to the 21620 level.
