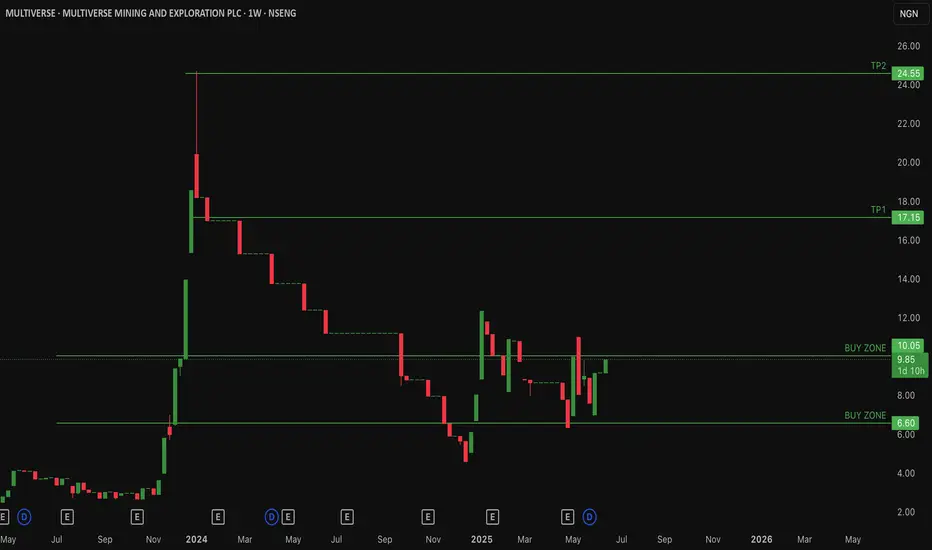
$MULTIVERSE Multiverse over 60% retracement from All time HighNSENG:MULTIVERSE Multiverse Mining & Exploration Plc focuses on quarrying solid minerals (granite, zinc, tin, tantalite, barite, columbite, gold, etc.) in Nigeria, with operations in Ogun and Nasarawa State.
Currently NSENG:MULTIVERSE has lost over 60% of its value from an all time high of 24.50/share and is in consolidation.
Current price: 9.85naira/share
Low risk Buy zone levels is between 6.8naira - 10naira/share
Expecting #Multiverse to retest previous resistances at 17naira/share and 24naira/share if price attempts a recovery.
📈 Key Levels
Breakout above ₦10.20 Breakout zone – key resistance turning into support if broken
₦17.1 TP1 – next major resistance (target)
₦24.5 TP2 – higher resistance / bull target
Invalidation of this idea is a weekly close under 6.8naira/share
Nigeriastockmarket
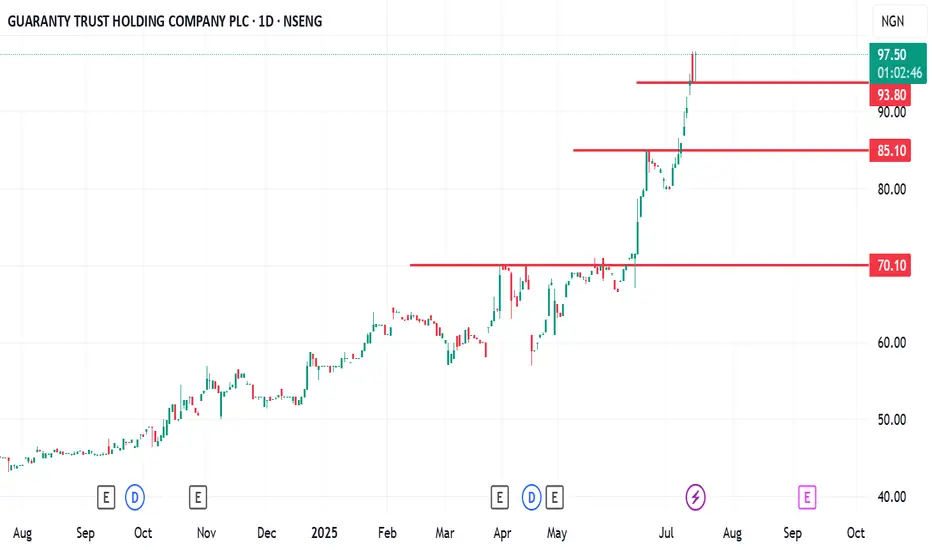
GTCO: has the sell off started.GTCO: Has the sell-off started?
Yesterday closed with a big sell day candle.
Be careful with this stock as the volatility will likely get worse between now and the end of this month.
I will be happy to accumulate this asset from N80 - N85 nzone
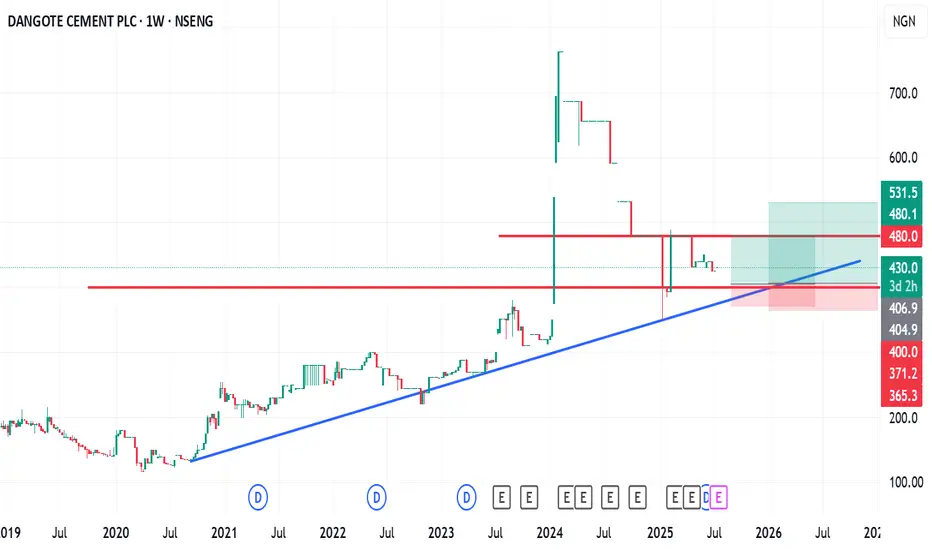
How I view Dangote CementHow I view Dangote Cement.
Technically:
N480 & N400 have been a strong psychological resistance zone for some time now.
Fundamentally:
The news that Dangote is planning to build a deep-sea port is a positive catalyst if it comes to fruition.
My entry:
I am looking at a buy entry from N400 using DCA.
I will continue to add if it falls below my N400 entry.
Trade with care
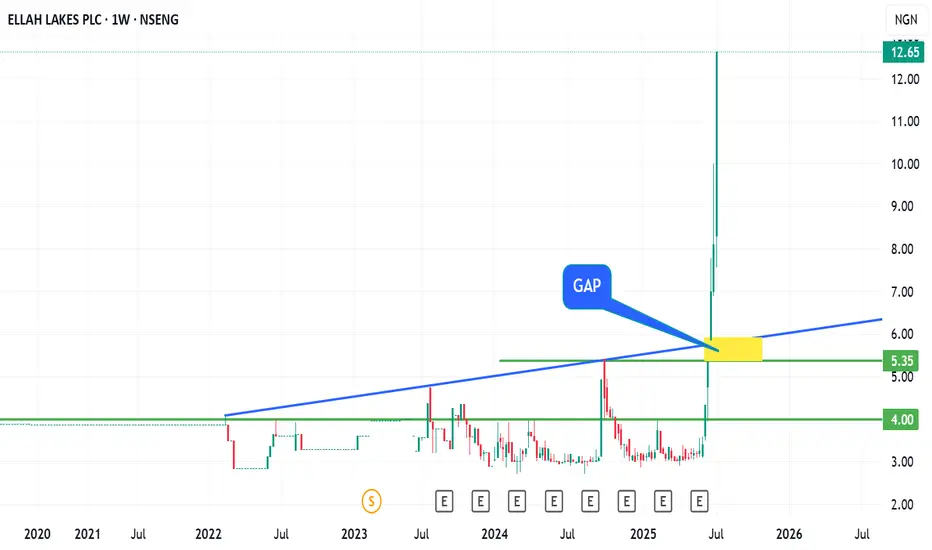
From Fish Farming to Agribusiness Giant: Ellah Lakes’ 304% Rise Ellah Lakes Plc is a Nigeria‑based agribusiness firm, once focused on fish farming but now primarily engaged in oil palm, cassava, maize, soya, and rice production and processing, operating plantations across Edo, Ondo, Enugu, Ekiti (Nigeria) and Ghana.
This asset has made roughly 304% gain since 2nd of June of this year.
The questions are:
1. Is this vertical growth sustainable?
2. Will price action be respected technically as shown on the chart?
3. Will Ellah Lake drop back to close the yellow gap? (N5.3 - N6 zone)
My final view:
After a 304% gain since June, I am now questioning the sustainability of this vertical move, key technical zones, and whether a price correction to the ₦5.3–₦6 gap is on the horizon
Trade with care
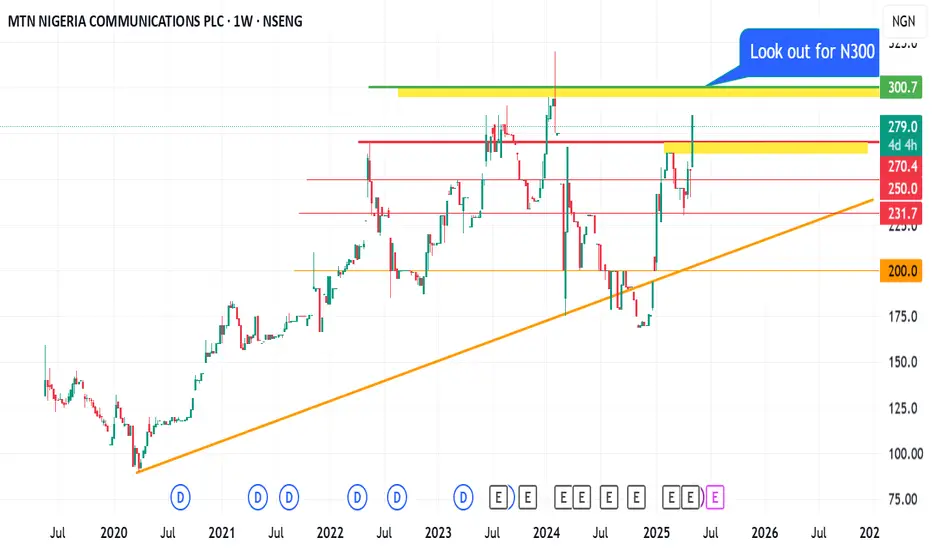
MTN Nigeria Stock: A Strong Rally smashing the roofMTN Nigeria Stock: A Strong Rally smashing the roof
MTN Nigeria stock has demonstrated remarkable growth since trading around the 170 naira zone in December 2024.
As of December 9th, the stock was priced at 170 naira but has steadily rallied over the months to surpass several resistance levels (N320, N357 & N386).
Based on this momentum, the nearest most significant support zone is N386. This is a zone with confluence between an ascending resistance trendline and a support level.
The question is.
1. Can the buy continue with this vertical push-up up
2. Will the N386 confluence zone continue to hold this stock from falling?
Trade with care.
Please like, follow, and share your thoughts.

My buy view for UBA stock on NGXMy buy view for UBA stock on NGX
This stock experienced a rapid decline following the Central Bank of Nigeria's directive to suspend dividend payouts.
I believe this stock pullback presents a buying opportunity.
My thoughts are displayed on the chart.
Trade with care

MTN Nigeria Stock Analysis and OutlookMTN Nigeria Stock Analysis and Outlook
MTN Nigeria has shown a strong recovery, breaking out of its prolonged downtrend in early December 2024. Since then, the stock has delivered an impressive rally, gaining nearly 70% in value.
As of the latest trading session, MTN Nigeria closed at ₦279. From a technical analysis standpoint, there is a possibility of a short-term pullback toward a key support zone (indicated in yellow on the chart). Should this level hold, the stock may continue its upward momentum with a potential push toward the ₦300 psychological resistance level.
While the medium-term trend remains bullish, it is important to approach this with caution—particularly for short-term traders. Implementing a well-placed stop loss remains crucial to manage downside risks effectively in volatile market conditions.
Disclaimer:
This analysis is for informational purposes only and should not be construed as financial advice. Always conduct your own due diligence before making investment decisions.
Please:
Follow me, like, and share my analysis. Also let me know your viee
MY BUY OUTLOOK FOR FIDELITY BANK NIGERIA stockMY BUY OUTLOOK FOR FIDELITY BANK NIGERIA stock.
This week has been a bleeding week for Fidelity stock despite a 64.2% year-on-year increase in gross earnings to N315.4 billion in Q1 2025.
I will patiently wait for entry at N16.5 zone and SL at N15.5 zone.
RR of 1:4
Trade with care.
Like, share,and follow me if you found this helpful

My View on Nigerian Breweries PLC (NB)My View on Nigerian Breweries PLC (NB).
This asset has made a significant ride up from its recent low, which broke the previous N45 resistance zone, and hit a new resistance zone around N56 before dropping a bit.
If the N45 support continues to hold strong, we might see this asset rally towards the ALMIGHTY resistance level around N68.
Looking at the chart, the 68 level marked yellow is a critical level for all investors.
Trade with care.
Please, if you found this helpful, kindly follow me, like, share my chart and let me know your thoughts on the comment session

My buy view for ACCESS Holding PLC. My buy view for ACCESS Holding PLC.
This asset is currently forming the right-hand of the W-pattern.
If this reversal pattern comes to play, we should expect an imminent buy for this stock.
Check out my entry, SL and TP on the chart

FBNH Stock Analysis and Technical OutlookFBNH Stock Analysis and Technical Outlook
First Bank Holding (FBNH) has experienced a consistent downtrend over the last four trading weeks, closing the most recent week at ₦38.25 per share. Based on current technical indicators and price action, there appears to be a strong likelihood that the stock may decline further, potentially reaching a key support zone around ₦26.65.
Should the price action confirm a reversal from this support area, a rebound towards the ₦33 and ₦38 levels may occur. These levels represent potential profit targets 1 and 2, respectively, for swing traders and medium-term investors.
From a fundamental perspective, FBNH appears undervalued at current levels, especially when considering its Price-to-Earnings (P/E) ratio of approximately 1.5. This suggests that the stock may be trading below its intrinsic value, which could attract long-term investors seeking undervalued opportunities in the Nigerian banking sector.
Caution is advised, however, as overall market sentiment and macroeconomic factors could influence short-term price movements. Investors and traders are encouraged to apply risk management strategies and conduct further due diligence before taking any position.
Disclaimer: This analysis is for informational purposes only and does not constitute investment advice. Always consult with a certified financial advisor before making trading decisions.

UBA on Nigeria Exchange may be heading to N35 - N34UBA on Nigeria Exchange may be heading to N35 - N34
Look at my analysis on the chart and you will see my sentiment for sell.
The TL and horizontal lines have my eyes.

My buy for Access Holding Stock on NGXMy buy for Access Holding Stock on NGX
This is my entry target with RR of 1:34 for ACCESS BANK STOCK.
I will wait for this asset to pullback to 21.95 zone as shown on the chart for buy limit.
I have a trade entered on CMP.
See you guys

CUSTODIAN stock on Nigeria Exchange to likely hit N21 soon.CUSTODIAN stock on Nigeria Exchange to likely hit N21 soon.
This stock made it to the position of 3rd best performing stock on the NGX gainers table.
The move from N19.6 to N21.5 was a rapid one.
I will be looking at N22 as a likely resistance to the upward move.

GTCO: Testing Key Support – Will It Hold?GTCO: Testing Key Support – Will It Hold?
GTCO has demonstrated remarkable price action over the years, reflecting both bullish surges and periods of retracement.
On January 22, 2018, the stock reached an all-time high (ATH) of approximately N57 before experiencing a prolonged decline.
However, the tides shifted on October 4, 2022, when GTCO rebounded from a low of N17, igniting a sustained upward trajectory.
Despite intermittent corrections, this stock has maintained a broader bullish structure, culminating in a fresh ATH of N64.5 on March 3, 2025.
Key Technical Questions:
1️⃣ Will the N57 Level Act as a Strong Support?
The previous ATH of N57, now potentially acting as a support zone, is a crucial level to watch.
If this level holds, it could serve as a strong demand zone, providing a foundation for further price appreciation.
However, a decisive breakdown below N57 with increased selling pressure may signal a deeper retracement.
2️⃣ What’s Next for GTCO?
If N57 proves resilient, a consolidation phase could set the stage for another rally toward higher price targets.
A sustained breakout above N64.5 would confirm continued bullish momentum, potentially opening doors for price discovery into uncharted territory.
Conversely, a failure to hold above N57 could see the stock revisiting lower support levels, with N57 and N49.5 being key areas to monitor.
Conclusion
GTCO remains in an overall bullish structure, but the ability of the N57 support level to hold will dictate its next major move. Traders and investors should watch for confirmation signals—such as volume trends and price action near this critical zone—before making strategic decisions.

TRANSCORP heading to N43 zone.TRANSCORP heading to N43 zone.
This is 3rd week of straight loss for this asset.
I am looking at a buy opportunity around N43 which happens to be a confluence of an ascending trendline and a horizontal support level.
If this is favoured by fundamentals, we should be targeting a RR of 1:4.5
Long term investors have no worry with SL

TRANSCORP (NGN) Breaks Out of Consolidation – Potential UpsideTRANSCORP (NGN) Breaks Out of Consolidation – Potential Upside Ahead
TRANSCORP has successfully broken out of its immediate consolidation zone and is currently trading at ₦61.
If this breakout is sustained, it presents a promising opportunity for bullish momentum.
Given the current market structure, I am looking to maintain a buy position around ₦58 - ₦61, with ₦70 and ₦80 as my key target price (TP) zones.
As with all trades, patience is essential, and I am prepared to hold my position strategically for optimal returns.
Trade wisely and manage risk accordingly.

I am optimistic about the outlook for STANBIC stockI am optimistic about the outlook for STANBIC stock.
Currently, Stanbic IBTC Holdings (STANBIC) on the NGX is trading above a rising trendline that is providing solid support.
While I am bullish on the stock, I am awaiting a pullback to the N57 level to execute my two planned entries.
To manage risk, I will set my stop loss at the N51.25 level for both entries.
My first target price (TP1) is N68.6, aligning with the FIB61.8% retracement level. For my second target (TP2), I am setting my sights on the all-time high (ATH) zone, which is N83.

Where Is TRANSCORP on NGX Heading Next?TRANSCORP recently broke its previous all-time high (ATH) of ₦53.5, setting a new ATH at ₦54.5.
However, the bullish momentum did not sustain, and the price has retraced to the ₦50 zone, which is now acting as a key support level.
Currently, there are no strong fundamental drivers indicating the possibility of a new rally. This raises the question:
Could we see the price decline further to the ₦46 zone, a level that has served as strong support multiple times in the past?
The Nigerian Exchange (NGX) has been quite volatile recently, and TRANSCORP is no exception.

MRS Oil on NGX is dropping from ATHMRS Oil on NGX is dropping from ATH
This stock hit its ATH of N218 last month. Following this, the asset has started pulling back.
The question is: how far will it pull back?

DANGOTE Sugar refinery outlookDANGOTE Sugar refinery outlook.
N30.97 my likely buy entry
SL for N26.95
TP for N37.85 and beyond.
All things being good

Unilever Stock on NGX: Technical Analysis and ForecastUnilever stock on the NGX reached its all-time low of ₦10 around March 30, 2020, during the global market downturn. From March 2020 to November 4, 2024, it traded in a range between ₦10 and ₦20, consolidating within this zone.
On November 4, 2024, the stock broke out of the ₦10-₦20 range, signalling the start of a bullish rally that has since propelled the price upward.
Currently, the stock has completed a 50% retracement from its last highest point, a significant level often observed in technical analysis. Additionally, its present price is at the FIB 50 level, a key resistance zone that could determine the continuation or reversal of the upward trend.
Traders should closely monitor ₦40, as it represents a significant psychological and technical level to watch for further price action.
Forecast:
If the price breaks above FIB 50, it may continue its rally toward the ₦40 zone.
A rejection at FIB 50 could result in a pullback to test lower support levels.

OKOMUOIL Hits a New All-Time High (ATH) on NGXOKOMUOIL Hits a New All-Time High (ATH) on NGX
OKOMUOIL on the Nigerian Exchange (NGX) has reached an impressive new All-Time High (ATH) of N440, breaking past its previous high set between August and September 2024.
A Quick Recap
After hitting its last ATH, OKOMUOIL retraced close to the Fibonacci 50% level, stabilizing around the N334 zone before regaining momentum.
This healthy pullback provided a solid foundation for the current bullish breakout.
The Key Question: What’s Fueling OKOMUOIL?
Several potential drivers could be behind this recent surge:
Strong Fundamentals: Increased earnings, strategic expansions, or operational efficiency improvements could have boosted investor confidence.
Market Sentiment: Positive sentiment around the agricultural or oil palm sector may be driving increased demand for OKOMUOIL shares.
Macroeconomic Factors: Government policies favoring local industries or rising commodity prices could be contributing to the upward momentum.
Technical Outlook
With the breakout above N440, the next step is to watch for potential consolidation or further rallying. Key areas to monitor include:
Support Levels: The N440 breakout level and the previous pullback zone at N334.
Fibonacci Extensions: These could help project potential future price targets.
Final Thoughts
OKOMUOIL’s price action reflects a strong bullish trend, but traders and investors should remain cautious. Understanding the fundamental catalysts and monitoring technical levels will be key to navigating the next move.
