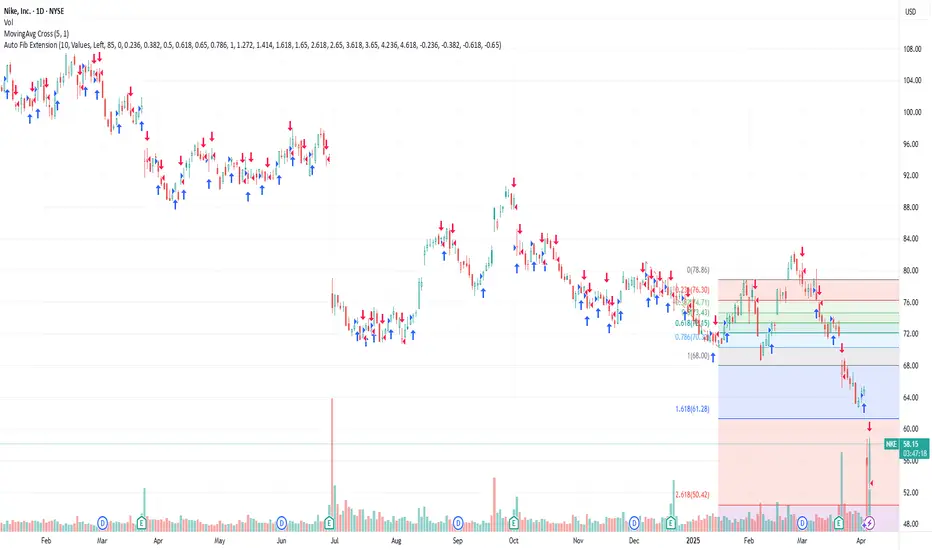
NIKE Confirms A Bullish Reversal With An Impulsive RecoveryWe talked about Nike on July 10 with our members, where we mentioned and highlighted a completed higher degree ABC correction in wave IV on the monthly and weekly charts.
Today we want to represent a closer view, as we see a five-wave impulsive recovery away from the lows on a daily chart. It actually confirms the bottom and bullish reversal, but since it can be trading in 5th wave that can stop around 80-85 area, we should be aware of a three-wave corrective setback soon. It can slow down the price back to the open GAP, so ideal buy zone is in the 70-60 area. Invalidation level is at 52.
Highlights:
Direction: Up, but watch out for a correction
Structure: Impulse, Wave 5 in final stages
Support: 70 / 60
Nike

Nike - This is the bottom!💉Nike ( NYSE:NKE ) creates the bottom now:
🔎Analysis summary:
More than four years ago, Nike created its previous all time high. We have been witnessing a downtrend ever since and a correction of about -70%. But with the recent retest of an important horizontal structure and bullish confirmation, Nike is about to create a potential bottom.
📝Levels to watch:
$65, $80
🙏🏻#LONGTERMVISION
Philip - Swing Trader

Nike Looks Ready — A Smart Time to Consider InvestingOn the monthly chart, NIKE has been in a downtrend since November 2021, but the signs are pointing toward a potential trend reversal. Here's why I believe the bottom may already be in:
✅ MACD Histogram shows a strong positive divergence, signaling weakening bearish momentum.
✅ The RSI downtrend line has been broken and successfully retested, confirming bullish strength.
✅ A clear hammer candle has formed at a historical wide support zone, showing strong demand.
Now, price is facing three consecutive resistance levels — and with each breakout, the next zone becomes the new target, (87.5 → 102 → 122).
The structure suggests a step-by-step move higher if momentum holds. Keep an eye on the breakout above the descending trendline — that’s where things could accelerate.

NKE NIKE Options Ahead of EarningsIf you haven`t sold NKE before the previous earnings:
Now analyzing the options chain and the chart patterns of NKE NIKE prior to the earnings report this week,
I would consider purchasing the 62usd strike price Calls with
an expiration date of 2025-7-3,
for a premium of approximately $2.29.
If these options prove to be profitable prior to the earnings release, I would sell at least half of them.
Disclosure: I am part of Trade Nation's Influencer program and receive a monthly fee for using their TradingView charts in my analysis.

If Nike Were Born Today: The Hypothetical Valuation of a New-AgeAbstract
Nike is one of the most recognizable brands on the planet, yet its valuation often lags behind newer, tech-driven companies with far less global influence. What if Nike were launched today — with its current revenue, market dominance, and brand power — but operated like a modern D2C startup with a tech DNA? This research explores what Nike would be worth in today’s market conditions, showing just how undervalued it may actually be when compared to new-age companies.
1. Introduction
Nike, Inc. (NYSE: NKE) is a global sportswear powerhouse with over $51 billion in annual revenue and a footprint in more than 170 countries. It has shaped athlete endorsement culture, built a generational brand, and transformed consumer behavior. Yet its current market capitalization sits around $80 billion — modest compared to newer players with less revenue but tech-first narratives.
This article dives into a simple but powerful hypothetical:
If a new company replicated Nike's current revenue and global dominance today, how would the market value it?
2. Nike Today: A Snapshot
Metric Value
FY2023 Revenue $51.2 Billion
Market Cap (Apr 17, 2025) ~$80 Billion
Net Profit Margin ~10.5%
P/E Ratio (TTM) ~17.9
Brand Value (Forbes, 2020) ~$39.1 Billion*
Global Reach 170+ Countries
*According to Forbes' Most Valuable Brands, Nike ranked #13 globally with a brand value of $39.1 billion in 2020. Other rankings (e.g., Interbrand 2023) place Nike's brand value even higher at $53.7 billion.
Despite being a category leader, Nike trades at a modest 1.6x sales multiple, compared to modern companies that command 5x, 7x, or even 30x+ valuations.
3. New-Age Valuation Framework
Today’s market rewards:
Tech-first operations
High-margin D2C models
Recurring revenue (subscriptions, memberships)
Community-driven brand growth
AI, personalization, and digital experiences
Let’s compare valuation multiples:
Company Sector Revenue Market Cap P/S Ratio
Nike Apparel $51.2B $80B ~1.6x
Lululemon Apparel SEED_TVCODER77_ETHBTCDATA:9B $50B ~5.5x
Salesforce SaaS $34B $240B ~7x
Nvidia AI/Chips $60B $2.3T ~38x
4. What Would a “Modern Nike” Be Worth Today?
If a new company today built:
$50B+ revenue
Global presence and branding like Nike
D2C-first, tech-enabled business
40–50% gross margins with scalable digital ops
Then, even at a conservative 6x revenue multiple, its valuation would be:
$50B × 6 = $300 Billion
And that's before factoring in:
AI-driven retail personalization
Creator monetization ecosystems
Loyalty programs and recurring revenue streams
Lower inventory risk with tech-driven fulfillment
5. Brand Value Through Royalty Method
Using the Royalty Relief Method:
Brand-attributable revenue (90% of $51.2B) = FWB:46B
Royalty rate = 6%
Annual royalty = $2.76B
Present Value (8% discount rate):
$2.76B ÷ 0.08 = \boxed{~$34.5B}
Nike’s brand, purely from an intellectual property lens, is worth significantly more than market pricing implies.
6. Why Nike Seems Undervalued
Categorized as a traditional apparel retailer vs. tech-first brand
Slower YoY growth relative to newer disruptors
Wholesale-heavy model impacts margins
Market overlooks its cultural dominance and brand loyalty
If Nike shifted its model to fully digital, leaned into AI and subscriptions, and emphasized platform economics, its valuation could more than double.
7. Conclusion
Nike, if built today, would not be an $80B company — it would likely be valued between $300B and $400B.
That’s the gap investors often miss.
Nike isn’t just a shoe and apparel brand — it’s global IP, media, culture, and influence. Yet in today’s market, it trades like a legacy retailer. If a startup were to achieve what Nike already has, it would be considered a generational tech unicorn.
Nike isn’t overvalued — it’s misunderstood.
About This Research
This research article was developed using AI-powered analytical tools, historical data modeling, and comparative valuation logic to explore hypothetical scenarios around Nike’s valuation. It combines financial fundamentals with modern market heuristics to offer a data-driven perspective on brand valuation in the context of today’s tech-driven economy.
Disclaimer
The information provided in this article is for informational and educational purposes only and does not constitute financial, investment, or trading advice. The analysis, opinions, and projections expressed are solely those of the author and are based on publicly available data as of the time of writing. This article is a hypothetical research exploration and should not be interpreted as a recommendation to buy, sell, or hold any securities mentioned herein.
All trademarks, brand names, and company references (including Nike Inc., Nvidia, Salesforce, etc.) are the property of their respective owners and are used for illustrative purposes only. The author is not affiliated with, endorsed by, or sponsored by any of the mentioned companies.
Investing in the stock market involves risk, including the potential loss of principal. Readers are strongly advised to do their own research and consult with a licensed financial advisor or other qualified professionals before making any investment decisions.
Past performance does not guarantee future results. The hypothetical scenarios and valuations discussed in this article are speculative in nature and are not guarantees of future company valuations or performance.

If your chase your deserve to loseNASDAQ:HTZ went $3.6 to $9.0 in 1 day because Bill Ackman bought it, yes same Bill who cried on TV and bought NYSE:NKE near $100 now at $50 area 🤦🏻♂️
People just want to chase anything

Nike (NKE) Share Price Falls to Lowest Level Since 2017Nike (NKE) Share Price Falls to Lowest Level Since 2017
The chart for Nike (NKE) shows that the share price has dropped to around $55 – levels last seen in November 2017.
Since the start of 2025, the stock has declined by approximately 27%.
Why Has Nike’s Share Price Dropped?
As noted in our analysis from September 2024, Nike shares had been trending downward for several months due to intense competition. However, President Trump’s tariffs have become the dominant bearish factor.
This is largely because Nike relies heavily on manufacturing operations in Asia – many of which have been directly affected by the newly imposed tariffs.
What’s Next?
According to the Wall Street Journal, manufacturers are taking a wait-and-see approach. They’re reluctant to shift production out of Asia, which could mean higher prices for American consumers. A full return to U.S. production is unlikely due to:
→ a shortage of skilled workers and suppliers;
→ significantly higher wages in the U.S. compared to Asia;
→ relocating production from Asia is a complex business migration, not just a factory move – a process many companies might not be prepared for.
Some firms are reducing their margins or optimising logistics, but most are hoping to weather the storm or delay major changes.
Technical Analysis of Nike (NKE) Shares
The price is forming a downward channel (highlighted in red), with the following characteristics:
→ the median line provided temporary support, but the early April rebound attempt was very weak;
→ the lower boundary of the channel now appears to be acting as support.
The RSI indicator suggests strong oversold conditions. Bulls might take comfort in the proximity of the psychological $50 mark strengthening this support level. However, it seems that only positive developments on the tariff front are likely to reverse sentiment meaningfully.
According to WSJ analysts, Trump’s recent comments hint at possible negotiations. But unless the President changes his stance, Mexico, Brazil, and India – nations well-placed to act as intermediaries between China and the U.S. – could emerge as the main beneficiaries.
This article represents the opinion of the Companies operating under the FXOpen brand only. It is not to be construed as an offer, solicitation, or recommendation with respect to products and services provided by the Companies operating under the FXOpen brand, nor is it to be considered financial advice.

Vietnam's Shadow Over Nike's Swoosh?Nike's recent stock dip illuminates the precarious balance of global supply chains in an era of trade tensions. The article reveals a direct correlation between the proposed US tariffs on Asian imports, particularly from Vietnam – Nike's primary manufacturing hub – and a significant drop in the company's stock value. This immediate market reaction underscores the financial risks associated with Nike's deep reliance on its extensive factory network in Vietnam, which produces a substantial portion of its footwear, apparel, and equipment.
Despite robust revenues, Nike operates with relatively thin profit margins, leaving limited capacity to absorb increased costs from tariffs. The competitive nature of the athletic wear industry further restricts Nike's ability to pass these costs onto consumers through significant price hikes without risking decreased demand. Analysts suggest that only a fraction of the tariff burden can likely be transferred, forcing Nike to explore alternative, potentially less appealing, mitigation strategies such as product downgrades or extended design cycles.
Ultimately, the article highlights Nike's significant challenges in navigating the current trade landscape. While historically cost-effective, the deep entrenchment of its manufacturing in Vietnam now presents a considerable vulnerability. Shifting production elsewhere, particularly back to the US, proves complex and expensive due to the specialized nature of footwear manufacturing and the lack of domestic infrastructure. The future financial health of the athleticwear giant hinges on its ability to adapt to these evolving geopolitical and economic pressures.

NKE: Macro structure [Monthly time frame]Price reached the top of the macro support: 56-27.
The correction from Nov'21 top has a picture perfect three-wave structure that has reached area of an ideal extension to finish itself (60-44 support).
Although, within the context of todays market uncertainty, recovery from this support zone, might still be a larger bounce before one more leg-down deeper into macro support
Best of trading and investing decision and thank you for you attention!

If you own a pair or NIKE! then this is your time #Shareholder Confessions from the Desk: Kim K Didn’t Move Nike, But Let’s Be Real…
So, it turns out Kim K’s magic touch didn’t send Nike stock into orbit. Shocking, I know. Apparently, even the queen of shapewear can’t single-handedly inflate a multi-billion-dollar company’s share price.
But let’s take a step back—because at this price, Nike is looking very interesting.
Forget the short-term noise. Nike is still the #1 IT gear for young adults and Generation Chic. You know, the people actually setting trends and spending money:
#Rappers – Because what’s a flex without fresh kicks?
#Tech bros – Coded an app? Great. Now go drop $200 on some sneakers.
#Creatives – The artists, designers, and influencers making sure you think about buying Nikes even when you’re not.
At the end of the day, Nike isn’t just a brand—it’s a lifestyle, a uniform, a status symbol. Stocks go up and down, but when it comes to culture, Nike runs the game.
So yeah, maybe the Kim K collab didn’t ignite a moonshot. But give it time. The streets, the startups, and the studios are still rocking the Swoosh. And that’s why I’m watching.
Nike ($NKE): Just Bought the Dip (and New Shoes)!Nike stock is at its lowest price in 5 YEARS. This could be the best sale since the clearance rack at the Nike outlet!
Nike NYSE:NKE stock is now at a 5 year low, and I don't see it going much lower from here. Here are some important facts about Nike:
Stock is at a 5-year low despite sales increasing from $37 billion to $51 billion and income doubled.
Down 63% from all-time high, despite good fundamentals.
P/E ratio is at 22. The lowest since 2018.
Forward P/E is at 33, which = growth expectations.
Price to sales is at 2.2
The price to book is at 7.6, the lowest since 2017.
EV/Sales is at 2. The lowest since 2017.
Technical indicators are signaling oversold and the price is at a support level.
All in all, it tells me that Nike is now the cheapest it has been in almost 8 years.
Nike risks and issues:
Inventory is high worldwide, and inventory movement has been slowing down.
Although high, inventory is lower than in 2022 and 2023.
Consumption might still suffer this year in the US due to austerity.
It seems that many analysts don't like the stock because sales (although growing) are growing less than expected, the business in China is slower than expected, and there is a high inventory.
Despite the issues above, what I see is an iconic brand selling at a 50% discount. Sales are up, income is up, ratios are looking good, and the company continues to be a great business, but the stock is selling at a discount. Nike will definitely not go out of business.
This is a good example of buying value at a good price!
Nike is already part of my portfolio (it has been since the Covid crash), but I'm now adding more.
If I were to start investing now, I would start with a little DCA.
Similarly to all my stock investments, I see Nike as a long term holding.
But honestly, I see Nike as an iconic brand on a 50% OFF clearance sale—too good to resist.
I went straight to the Nike store and bought two pairs of sneakers to help flush out that excess inventory. As a proud shareholder, I'm confident I'll see at least $0.01 back in dividends from my shopping spree! 😅👟
Quick reminder: This is my investing journey, not financial advice! 😊

SHORT | NKENYSE:NKE
The weekly chart of Nike (NKE) at $67.67 displays a bearish bias within a descending channel, with the price testing the lower trendline. The analyst targets a breakdown, aiming for 60$ (Target Price 1) and $49.65 (Target Price 2), supported by consistent lower highs and lows, with RSI at 41.67 indicating potential for further downside.

NikePoor results mean Nike has broken out of a triangle pattern which started forming in March 2022.
Clean break down with large sell side volume.

NKE NIKE Options Ahead of EarningsIf you haven`t sold NKE before the previous earnings:
Now analyzing the options chain and the chart patterns of NKE NIKE prior to the earnings report this week,
I would consider purchasing the 73usd strike price Puts with
an expiration date of 2025-3-21,
for a premium of approximately $3.35.
If these options prove to be profitable prior to the earnings release, I would sell at least half of them.

Nike (NKE) Shares Surge 5%Nike (NKE) Shares Surge 5%
The sportswear giant was among the top performers in the US stock market yesterday after Jefferies analysts raised their outlook:
→ Upgraded NKE stock from “Hold” to “Buy”
→ Increased the price target from $75 to $115
Amid fierce competition, NKE shares had been in a downtrend throughout 2023-2024, but a leadership change (which we covered in September 2024) may have acted as a catalyst for a turnaround.
Technical Analysis of Nike (NKE) Stock
Jefferies’ upgrade triggered a bullish breakout of the downtrend line (marked in red).
The $71 level has proven to be a key support, particularly in February, when NKE hit its yearly low. Bears attempted to resume the downtrend, but failed—since then, the stock has surged approximately 17%, forming a sharp reversal (marked by an arrow), which is a bullish signal.
In Wyckoff Method terminology, this move could indicate a Terminal Shakeout, marking a transition from the Accumulation phase to the Mark-Up phase.
Nike (NKE) Stock Forecast
Jefferies analysts hold the most optimistic outlook among their peers. According to TipRanks:
→ 15 out of 28 analysts recommend buying NKE shares
→ The average 12-month price target for NKE is $86
Trade on TradingView with FXOpen. Consider opening an account and access over 700 markets with tight spreads from 0.0 pips and low commissions from $1.50 per lot.
This article represents the opinion of the Companies operating under the FXOpen brand only. It is not to be construed as an offer, solicitation, or recommendation with respect to products and services provided by the Companies operating under the FXOpen brand, nor is it to be considered financial advice.

Nike (NKE) at a Pivotal Point: Reversal or Further Decline?The weekly chart of Nike (NKE) displays a prolonged downtrend, with price action respecting a descending trendline. A harmonic Bat pattern has formed, with key Fibonacci retracement levels indicating potential reversal zones. The price has recently tested the AB=CD completion zone around $77.17 and $69.90, aligning with historical support.
Technical indicators suggest oversold conditions, as both momentum oscillators (stochastic and RSI) show signs of bullish divergence. A breakout above the trendline and sustained buying pressure could trigger a move towards T1 ($107.99) and T2 ($132.31). However, failure to hold support may lead to further downside continuation.

$NKE! I am on the KIM pump to $125 (YES we can) Confessions from the Desk: Can Kim K Save Nike, or Did Nike Just Buy SKIMS?
Fresh off two weeks of solid busts (both in the market and in my morale), I’ve decided to pivot—because clearly, my current trading strategy has all the accuracy of a broken Magic 8-Ball. This week, I’ve dipped my toes into consumer goods and sportswear, because if there’s one thing Americans will never stop buying, it’s overpriced gym clothes they never actually work out in.
And right on cue, Nike is making headlines. Did Nike just buy SKIMS, or did they just recruit Kim K to save their soul? Hard to say. Either way, the company is betting big on a Made in USA push—because nothing screams patriotism like a $120 athleisure set stitched together with the finest American thread.
This marks the first global advertising campaign under the new CEO, and let’s be real—the stakes are high.
The real question is: Is Kim Kardashian the savior Nike needs?

NIKE - Have they finally bottomed?NYSE:NKE
This company has been in a steady downtrend for the last two years as they've fell behind and lost track of what got them to be NIKE!
I believe this is a solid turnaround play for 2025 and beyond.
It does not align as a buy on the trading standpoint yet until we break the diagonal trend line from July 2024. Then we could push towards a double bottom breakout!
Not financial advice

It is about time for NIKE to shine! Technical Analysis:
1️⃣ Support Level Strength:
Nike is currently trading around a strong support zone near $70, a level where the stock has historically shown significant rebounds.
In a previous instance, Nike rallied 27% in under two months after bouncing from this support—suggesting a similar move is possible.
2️⃣ Reversal Signals in Play:
The RSI is showing bullish divergence from oversold levels, further supporting the potential for a recovery.
Fundamental Strengths:
1️⃣ Brand Power:
Nike remains a global leader in the sportswear industry, with unparalleled brand equity and customer loyalty.
2️⃣ Financial Resilience:
Despite recent revenue declines, Nike has shown improved gross margins and strong free cash flow growth, highlighting its ability to manage challenges effectively.
3️⃣ Strategic Initiatives:
Under new leadership, Nike is doubling down on direct-to-consumer sales, innovation, and sustainability—three areas expected to drive future growth and profitability.
4️⃣ Global Expansion:
Nike’s market share, combined with its global reach and innovation in product lines, creates a strong foundation for sustained revenue growth.
Analyst Sentiment and Forecasts:
Analysts maintain a "Buy" rating on Nike, with price targets ranging from $85.92 to $92.47, representing a 14.68% to 30.53% potential upside from the current price of $70.84.
While short-term revenue challenges exist, forecasts suggest Nike’s strategic adjustments will drive a recovery, leading to appreciation in its stock price.
Why This Matters:
✅ Historical tendency to rebound from the $70 support level with significant gains.
✅ Strong global brand equity and market presence.
✅ Strategic focus on innovation, direct-to-consumer sales, and sustainability.
✅ Positive analyst sentiment and attractive upside potential.
Take Profit Levels:
🎯 TP1: $77 – Short-term target based on immediate resistance.
🎯 TP2: $88 – Just below the previous increase from support for a safe exit.
🎯 TP3: $95 – Aligns with the 0.236 Fibonacci retracement level.
🎯 TP4: $110 – Corresponds to the 0.382 Fibonacci retracement level.
🎯 TP5: $124 – Matches the 0.5 Fibonacci retracement level.

Nike's Technical rating "Indicator" since day one is flashing!The only other time we have had such a low readings we had (-76%) drawdown, we are setting on (-60%) this week therefore the risk down is another 16% correction. I have copied the following from Tradingview website to give u an insight on this indicator !
" Definition
Technical Ratings is a technical analysis tool that combines the ratings of several technical indicators to make it easier for traders and investors to find profitable trades.
Calculations
These are the criteria used to determine the rating of the individual indicators used. Note that changes from the last bar are used to determine falling or rising states:
All Moving Averages
Buy — MA value < price
Sell — MA value > price
Neutral — MA value = price
Ichimoku Cloud
Buy — lead line 1 > lead line 2 and base line > lead line 1 and conversion line > base line and price > conversion line
Sell — lead line 1 < lead line 2 and base line < lead line 1 and conversion line < base line and price < conversion line
Neutral — neither Buy nor Sell
Relative Strength Index
Buy — indicator < 30 and rising
Sell — indicator > 70 and falling
Neutral — neither Buy nor Sell
Stochastic
Buy — main and signal lines < 20 and main line > signal line
Sell — main and signal lines > 80 and main line < signal line
Neutral — neither Buy nor Sell
Commodity Channel Index
Buy — indicator < -100 and rising
Sell — indicator > 100 and falling
Neutral — neither Buy nor Sell
Average Directional Index
Buy — +DI line > -DI line and indicator > 20 and rising
Sell — +DI line < -DI line and indicator > 20 and rising
Neutral — neither Buy nor Sell
Awesome Oscillator
Buy — saucer and values are greater than 0, or cross over the zero line
Sell — saucer and values are lower than 0, or cross under the zero line
Neutral — neither Buy nor Sell
Momentum
Buy — indicator values are rising
Sell — indicator values are falling
Neutral — neither Buy nor Sell
MACD
Buy — main line values > signal line values
Sell — main line values < signal line values
Neutral — neither Buy nor Sell
Stochastic RSI
Buy — downtrend and K and D lines < 20 and K line > D line
Sell — uptrend and K and D lines > 80 and K line < D line
Neutral — neither Buy nor Sell
Williams Percent Range
Buy — indicator < lower band and rising
Sell — indicator > upper band and falling
Neutral — neither Buy nor Sell
Bulls and Bears Power
Buy — uptrend and BearPower < zero and BearPower is rising
Sell — downtrend and BullPower > zero and BullPower is falling
Neutral — neither Buy nor Sell
Ultimate Oscillator
Buy — UO > 70
Sell — UO < 30
Neutral — neither Buy nor Sell
The numerical value of the Sell rating is -1, Neutral is 0 and Buy is 1. The group and overall ratings are calculated as the average of the ratings of the individual indicators.
Recommendations for the group or overall ratings are based on this numerical rating value and determined according to the following criteria:
— Strong Sell
— Sell
— Neutral
— Buy
— Strong Buy
The basics
The recommendations given by the indicator are based on the ratings calculated for the various indicators included in it.
The overall rating of the indicator includes two large groups of indicators. The first consists of SMAs and EMAs with different lengths (MA lengths are 10, 20, 30, 50, 100 and 200), the Ichimoku Cloud (9, 26, 52), VWMA (20) and HullMA (9). The second one is calculated on the following oscillators: RSI (14), Stochastic (14, 3, 3), CCI (20), ADX (14, 14), AO, Momentum (10), MACD (12, 26, 9), Stochastic RSI (3, 3, 14, 14), Williams %R (14), Bulls and Bears Power and UO (7,14,28). Each group's rating is calculated separately, so you can select the group in the indicator settings and its respective rating calculation will be displayed on the chart.
What to look for
The Technical Ratings tool is designed to have values that fluctuate above and below a zero line. Its values are plotted as a histogram of red, blue and gray bars, and depend on your selection in the Rating is based on field of the script's inputs, where you can choose to view the value of the MAs rating, the oscillators rating, or the average of both.
Columns are gray when the value of the indicator is between 0.1 and -0.1. Progressively more saturated blue columns indicate rising values above 0.1, and more saturated red columns indicate progressively falling values below -0.1.
The label at the end of the histogram displays the state of the MAs, oscillators, and the overall rating. Its color is determined by the value of the rating selected in the Rating is based on field: gray for neutral, blue for Buy or Strong Buy, red for Sell or Strong Sell.
Summary
Technical Ratings can be a valuable technical analysis tool for many analysts or traders. Many traders use a selection of complementary indicators to make better decisions. Technical Ratings simplifies this task by combining the most popular indicators and their signals.
Note: TradingView does not recommend that anyone buy or sell any financial instrument based solely on the recommendations of the Technical Ratings indicator. Recommendations merely indicate the fulfillment of certain conditions of a set of individual indicators that may help the user to spot potentially favorable conditions for a transaction, if this is consistent with his/her strategy. "
end of copy !

Nike Price Earnings Ratio is similar to 2017 or not ?
Quoting P/E Ratio meaning:
Investopedia
" What Is the Price-to-Earnings (P/E) Ratio?
The price-to-earnings (P/E) ratio measures a company's share price relative to its earnings per share (EPS). Often called the price or earnings multiple, the P/E ratio helps assess the relative value of a company's stock. It's handy for comparing a company's valuation against its historical performance, against other firms within its industry, or the overall market."
end of quote

Nike's 1984 Vs 2000 Major Trend lines The 1984 Major and historical Trend line is already broken with 3 candles below, technially
this is a valid and confirmed breakdown.
The 2000 Major and historical Trend line is hanging by $5 give or take $66 -+ is the support for the TL.

Nike by April 2025 we should have break out or breakdown !101 Trend lines analysis. By April we should could/might reach the Red line in which we will have a break out to a new ATH in the next years or so or a break down to the 40ish/50ish region.!
