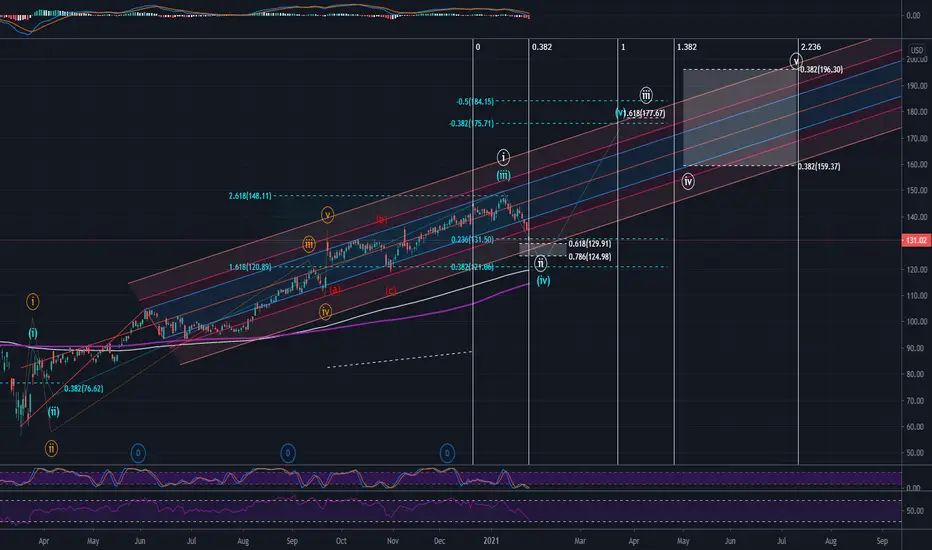
Elliott Wave View: Nike Impulsive Rally Favors More UpsideShort Term Elliott Wave View in Nike (NKE) suggests the pullback to $128.91 ended wave ((4)). Internal of wave ((4)) unfolded as a Flat where wave (A) ended at 138.32, wave (B) ended at $147.90, and wave (C) ended at $128.91. The stock has resumed higher in wave ((5)), but it still needs to break above wave ((3)) at 147.95 on December 21, 2020 high to avoid a double correction.
Up from wave ((4)) low at $128.91, wave ((i)) ended at $136.37, and pullback in wave ((ii)) ended at $132.15. Stock then resumes higher in wave ((iii)) towards $140.06, and pullback in wave ((iv)) ended at $138.01. Expect the stock to end wave ((v)) of 1 soon, then it should pullback in wave 2 to correct cycle from January 28 low before the rally resumes. Internal of wave 2 pullback is proposed to be unfolding as a zigzag in 3 waves before the rally resumes. As far as pivot at $128.91 low on January 28 stays intact, expect dips to find support in 3, 7, or 11 swing for further upside. Potential target higher for wave ((5)) is 1.236 – 1.618 external retracement of wave ((4)) which comes at 152.3 – 159.5
Nike

Nike: Just Do It! 💪Nike has been a strong player on the capital markets for a long time. Accordingly, we will see the stock price rise further in the future, too! There is little doubt on our side that this stock is staying a long-term Bull – Michael Jordan would be proud! Now, we are primarily expecting the price to continue to rise above $147.93. However, there is a 45% chance that we see a minor dip below $131.23 down until $120.90. Again, we think this stock is going up in the long run, which means that even from the price of $120.90 we will see the price increase after that correction.
Stay sporty, stay trading!

Nike to $175 by end of MarchI have 2 possible counts for Nike.
The first count in blue indicates is an extended W3 to the 2.618 level with a current W4 in progress. We are right around the 23.6 retracement for W4. A shallow W4 retracement makes sense due to our extended W3, and the RSI and Stoch RSI on the daily chart are both oversold. This setup looks primed for a reversal to finish a W5 which, if extended to 38.2% above the W3 high, would result in a final projection of around $175 by March 23.
The second cound in white models the beginning of a new cycle (follwing on from the completion of the first cycle in orange). This count indicates a wave 2 retracement which has nearly reached the 61.8% pull back, and is ready for a reversal for wave 3 which would take $NKE to $177 by march 23.
Both counts indicate a reversal, and the RSI/Stoch RSI support this thesis. The pitchfork created by connecting the March lows to the June highs and the June lows gives a channel with multiple reactions off the median, the 1 and the 1.618 lines. The current price is right at the 1.618 line where it has bouin ed previously on Sept 22/23 and Oct 30. The price is also at the 4Hr 200 EMA and 200 MA support currently.
This gives us 2 wave counts (blue W4 and white W2), the RSI/Stoch RSI indicator, the Pitchfork support and the 4Hr 200 MA/EMA support all indicating a trend reversal.
This projection is invalidated if the price falls below $120. The price target in the mid term is $175 by end of march.
Wedge on NikeA wedge pattern was formed on the 1 hour timeframe. If the price manages to break through the support level of 85.97-87.32$, I expect a further fall.

Nike earnings have serious potential to set a course.As seen in this 4 hr chart, Nike has been in an ascending channel since the corona sell off/rebound. The price action has moved in accordance with the upward parallel channel it is seemingly advancing in. It has recently slowed down and failed to rise back above the midline of the channel recently. Heres the tricky part, Nikes recent sell off leaves this one in the middle of a grey area territory. The chart setup is perfect for a BIG move around earnings, which way is very much so up in the air. As previously stated this one falls right in the middle of the current gray area, RSI is nearing oversold, but if there is no RSI support around the 40/50 area, and an increase in selling volume, this one could have lost steam, change course, and fall into a bearish channel downwards back towards 105. Nike earnings and the investors reaction to said earnings, have the possibility to set this one on a path that it could possibly take into the end of the year.
(*personal advice: always play earning safely with a neutral strategy*)
Bullish (possible by end of year) price target:$140
Bearish (possible by end of year) price target:$105
Earnings could set the future course for Nike.

NIKE LONG SWING POSITION BUY ! JORDANS KEEP JUMPING OFF SHELVESNIKE IS EXPECTED TO REACH $170-$180 by the end of 2021 or sooner
Earnings report coming in on Friday
I’m swing buying Nike long !
TP’s
170
180
225
My entry price is around $136!

Elliott Wave View: Nike (NKE) Extending to New All-Time HighShort term Elliott Wave View view in Nike (ticker symbol: NKE) suggests the rally from October 30 low is unfolding as a 5 waves impulse Elliott Wave structure. Up from October 30 low, wave (1) ended at 139.09 and pullback in wave (2) ended at 125.63. The stock has resumed higher in wave (3) which is unfolding in another 5 waves in lesser degree.
Up from wave (2) low at 125.61, wave ((i)) ended at 133.98 and dips in wave ((ii)) ended at 128.43. The stock then resumed higher in wave ((iii)) towards 139 and pullback in wave ((iv)) ended at 132.69. Expect wave ((v)) to end soon and this should complete wave 1 of (3) in larger degree. Afterwards, stock should pullback in wave 2 to correct cycle from November 13 low before the rally resumes.
As far as wave (2) low pivot at 125.61 low stays intact, expect pullback to find support in the sequence of 3, 7, or 11 swing for further upside. Minimum potential target higher is 100% – 123.6% fibonacci extension from October 30 low towards 145.76 – 150.48. A 161.8% extension in wave (3) is possible which should bring the stock to 158.14.

MTRXAbsolutely incredible run!
Loop has delivered some fabulous news to the public which helped the pump but could not sustain it. Looking to retrace to .76-.66 and then to re-enter my position. Great team, great product, cant get to attached to a stock but this company is moving.
VANCOUVER, BC, November 18, 2020, Loop Insights Inc. (MTRX:TSXV) (RACMF:OTCQB) (the “Company” or “Loop”), a provider of contactless solutions and artificial intelligence (“AI”) to drive real-time insights, enhanced customer engagement and automated venue tracing to the brick and mortar space, is pleased to announce the Company has been selected to join the Impact Radius Marketplace (“Impact”), providing Loop with the opportunity to connect with and leverage marketing opportunities with Impact global brand partners such as Fanatics, Uber (UBER:NYSE), Nike (NKE:NYSE), Adidas (ADS:ETR), Airbnb, Levi’s (LEVI:NYSE) and many more.
IMPACT RADIUS IS THE GLOBAL LEADER IN PARTNERSHIP AUTOMATION MANAGING OVER $50 BILLION IN E-COMMERCE SALES
Source: Investorsupdate

How To Trade Stocks with Volume Profile (NIKE Analysis) 👟In today’s analysis, I will give you a quick guide on analyzing and trading stocks with Volume Profile.
I am going to focus on long-term investments, not day trading.
NIKE – Volume Profile analysis
What i really like about Volume Profile is it’s versatility. You can use it for almost any trading instrument and the best thing is that you always do it the same way. The strategy and setups are the same regardless of what you trade.
In this case I did my analysis on Daily chart (you can also do this on Weekly).
From July to August the price of Nike was in a rotation. The price created a flag and the rotation was becoming tighter and tighter.
The tighter the rotation becomes, the higher chances it will shoot aggressively up or down from there.
And this exactly this happened in the beginning of August. The tight price channel broke, and the price shot upwards, starting a new trend.
NIKE – Point Of Control (POC)
I used my Flexible Volume Profile to look inside the rotation area to see how the volumes were distributed there.
It showed that there were massive volumes traded in that rotation, and that the Point Of Control (place with the heaviest volumes traded) was at 98.00. This is an important information because this is the place where most of the trading took place.
I expect that the big trading institutions (banks, hedge funds, pension funds,…) were building up their massive Long positions there.
When they finished doing so, they started to push the price aggressively upwards into a new uptrend.
When the price makes it back and tests the POC at 98.00 I think that those big institutions will become active again and that they will drive the price upwards again.
POC is very important level for them because they have placed most of their positions there. They will defend it, and for this reason it should work as a strong Support.
So what now? Now we wait until the price comes back to 98.00. You can set a pending order there, so you don’t miss the trade entry when the price makes it to 98.00.
I hope you guys liked the article. Let me know what you think and if you are into trading stocks or if you prefer currencies, futures, or something else.
Happy trading!
-Dale

NKE to break higher on technicals and earningsNike had a good earnings report this past quarter beating over 100% of the analysts' expectations on some strong volume too. We can see the potential of the break of the top on these higher lows as well.
The current resistance is at $130-$131 where we have see the level get tested time and time again on strong bullish momentum and candles, meaning whoever is stopping form price moving through that level has a lot of stops hidden above. That buy stop run could open up price aggressively to the first target at $145.00 or so.
There is the possibility we pullback to close the gap or into the $123 support too before rocketing higher. The higher probability move is the breakout though. With the potential Santa Claus rally coming through and the elections resolving some of the uncertainty in the market, it would see that retail especially online retail may get a nice push this year due to quarantine as well.
This idea is for educational purposes only, should not be taken as investment advice or trading advice.

nike expection move 80%the macd and bull pattern
the fibo expection 0.618
like share and follow if it was usefull

NKE/Nike has BUY positionAs you can see after breaking those purple areas, Its a good entry point, but price might have some struggles after reaching the second purple cluster. So after breaking it, it would be another good entry point.

Nike... Just "Trade" It ?Nike NYSE:NKE is trading close to its 21 day EMA. There could be potential for a bullish pullback near the 21 day EMA since its rally from the last pullback on September 22nd was quite successful. Of course, past performance does not indicate future results... We will continue to monitor NKE to see which way it goes.


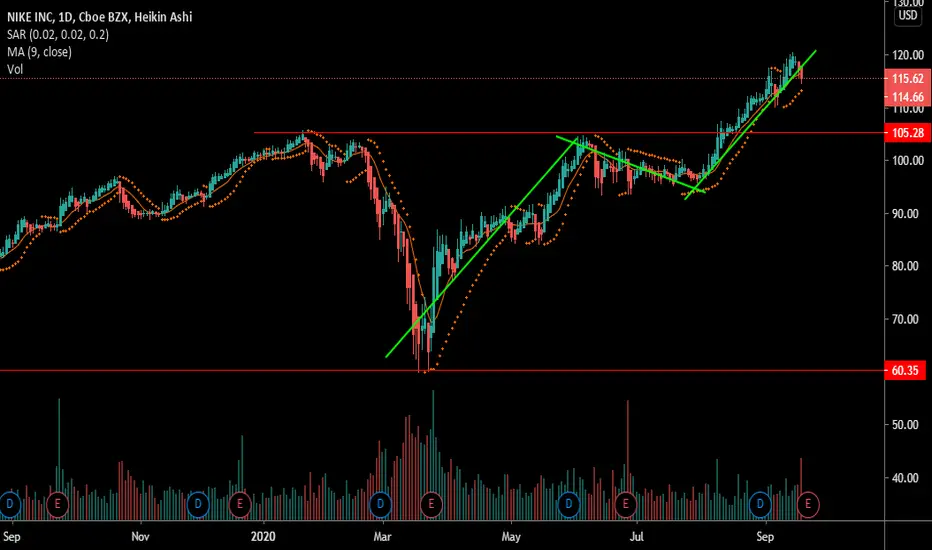
Nike Up Over 10%Since the last Nike post, price has moved up 10.4% and continues to demonstrate strength in the market.
Nike had its earnings release on September 22nd which had a positive effect on price as we saw a jump
from $116 to $130 overnight, adding increased profits to its shareholders.
That gap up in price was followed by a decline/pullback and price now appears to have found support
because we are seeing a continuation of the bullish momentum.
Price broke out of consolidation in early August and has trended well so far, using the 20 simple
moving average as support. When price uses the 20sma, it helps to confirm if we are seeing a linear
trend in play.
As the current pullback is showing strength, we are now anticipating a breakout above the recent high
at $130. A break and close above this level will confirm a continuation to the upside and offer us some
high probability long opportunities.
See below for more information on our trading techniques.
As always, keep it simple, keep it Sublime.

NIKE Breaking out strong!!Nike brand digital sales jump 82% in Q1
Nike shares were immediately higher in after-hours trading after reporting earnings that blew past estimates. The athletic retailer reported $10.6 billion in revenue, far surpassing Wall Street expectations of $9.1 billion. Yahoo Finance’s Myles Udland joins The Final Round to break down the numbers.
Our goal is to create a safe and engaging place for users to connect over interests and passions. In order to improve our community experience, we are temporarily suspending article commenting.
Nike expected to return to profit as online sales, demand from China pick up.

Short Buy position on NikeDespite the good earning on Nike, We have 2 dynamic resistances, after the breakout and pullback which is along with a testing, We have good buying position with considering of SL and TP

nike after perfect earnings nike after bullflag the price action and patterns is talking bullish and crossing claster

Just going to do itI love this company but:
1. Technicals look bearish short term despite having results tomorrow
2. People visiting gyms is decreasing ( athletic clothes sales as a fashion is going to decrease)
3. All the kidos are going to keep their last year shoes since they stayed home and did not teared them apart
4. Neymar signed with PUMA
5. Arenas are closed
*They moved to their own online shop which will improve margins 100% but sales will be bad in the upcoming year and going forward 21 In my opinion...
Do not take my graphs seriously!!!


Nike Climbs While The Rest Of The Market Dips.Nike has been off the radar for some time, especially since it started consolidating from December
2015 to May 2018. The trend following its breakout of consolidation has lacked the energy and
momentum of the prior trend when Nike shares saw a growth of 612% from March 2009 to December 2015.
The trend experienced its first pullback and made contact with the resistance turned support at $68
in December 2018 before slowly rising again.
Then due to the recent global pandemic, Nike shares plummeted towards the support at $68 once again.
We then saw a sharp increase in price, seeing a rise back above the 200 simple moving average and since
then we have seen a linear trend in play.
The market as a whole are experiencing pullbacks and Nike looks set to end the week pulling back itself.
Despite this, Nike is outperforming the rest of the market at the moment.
Nike has the daily 20 simple moving average below it at the moment which may provide support,
then we have the 50 simple moving average as a second option for support.
Nike remains at the top of our watchlist for the simple fact that it has started to trend well and may
continue to do so for some time going forward.
See below for more information on our trading techniques.
As always, keep it simple, keep it Sublime.
