Nikkei to find sellers at previous support?NIK225 - 24h expiry - We look to Sell at 27310 (stop at 27425)
Previous support level of 27266 broken.
Although the bears are in control, the stalling negative momentum indicates a turnaround is possible.
We are trading at oversold extremes.
Short term bias has turned negative.
A higher correction is expected.
We therefore, prefer to fade into the rally with a tight stop in anticipation of a move back lower.
Our profit targets will be 26980 and 26700
Resistance: 27390 / 27815 / 28500
Support: 27040 / 26700 / 26270
Risk Disclaimer
The trade ideas beyond this page are for informational purposes only and do not constitute investment advice or a solicitation to trade. This information is provided by Signal Centre, a third-party unaffiliated with OANDA, and is intended for general circulation only. OANDA does not guarantee the accuracy of this information and assumes no responsibilities for the information provided by the third party. The information does not take into account the specific investment objectives, financial situation, or particular needs of any particular person. You should take into account your specific investment objectives, financial situation, and particular needs before making a commitment to trade, including seeking advice from an independent financial adviser regarding the suitability of the investment, under a separate engagement, as you deem fit.
You accept that you assume all risks in independently viewing the contents and selecting a chosen strategy.
Where the research is distributed in Singapore to a person who is not an Accredited Investor, Expert Investor or an Institutional Investor, Oanda Asia Pacific Pte Ltd (“OAP“) accepts legal responsibility for the contents of the report to such persons only to the extent required by law. Singapore customers should contact OAP at 6579 8289 for matters arising from, or in connection with, the information/research distributed.
Nikkei225trade

Midweek analysis (EURCHF, EURNZD, EURGBP, Nikkei225, BTC, SP500)My analysis for EURO pairs and JPN255, BTC and SP500 . Let me know what do you think?

JPN225 I think we are in distribution and a drop is comingtypical wyckoff distribution and I will be expecting a drop to daily FVG

Selling Nikkei into current swing highs.K225 - 21h expiry - We look to Sell at 26635 (stop at 26855)
Buying pressure from 25931 resulted in prices rejecting the dip.
The current move higher is expected to continue.
With the Ichimoku cloud resistance above we expect gains to be limited.
We therefore, prefer to fade into the rally with a tight stop in anticipation of a move back lower.
Our profit targets will be 26015 and 25795
Resistance: 26435 / 26830 / 27150
Support: 25795 / 25060 / 24120
Please be advised that the information presented on TradingView is provided to Vantage (‘Vantage Global Limited’, ‘we’) by a third-party provider (‘Signal Centre’). Please be reminded that you are solely responsible for the trading decisions on your account. There is a very high degree of risk involved in trading. Any information and/or content is intended entirely for research, educational and informational purposes only and does not constitute investment or consultation advice or investment strategy. The information is not tailored to the investment needs of any specific person and therefore does not involve a consideration of any of the investment objectives, financial situation or needs of any viewer that may receive it. Kindly also note that past performance is not a reliable indicator of future results. Actual results may differ materially from those anticipated in forward-looking or past performance statements. We assume no liability as to the accuracy or completeness of any of the information and/or content provided herein and the Company cannot be held responsible for any omission, mistake nor for any loss or damage including without limitation to any loss of profit which may arise from reliance on any information supplied by Signal Centre.

NIKKEI 225 CFD BEARISH PATTERNJapan is currently facing an inflation high not seen in 40 years. The weak yen and the increased cost of foreign supply for industrial commodities and manufacturing parts are slowing down the economy of the country.
On the technical front the index has broken the support of the triangle pattern and a bearish move might be expected. RSI indicator is heading below 50 neutral line and MACD histogram is below 0.
If the pattern continues the price might test the support levels of 27831. In the opposite scenario, the price might try to reach its previous resistance at 27929.50
Risk Disclosure: Trading Foreign Exchange (Forex) and Contracts of Difference (CFD's) carries a high level of risk. By registering and signing up, any client affirms their understanding of their own personal accountability for all transactions performed within their account and recognizes the risks associated with trading on such markets and on such sites. Furthermore, one understands that the company carries zero influence over transactions, markets, and trading signals, therefore, cannot be held liable nor guarantee any profits or losses.

NIKKEI 225 Monthly Forecast Movements 1-30 November 2022 NIKKEI 225 Monthly Forecast Movements 1-30 November 2022
We can see that for this month, the implied volatility is around 4.56%, rising 3.68% of last month.
This is currently placing us in the 25th percentile according to ATR and 83th according to JNIV
Based on this percentile calculation, on average the monthly movement for the candle(from open of the candle to the close of the candle) is:
BEARISH Candle : 4.7%
BULLISH Candle : 3.1%
With this in mind we can expect with a close to 23.4% probability that our close of the monthly candle is going to close either above or below the next channel:
BOT: 26600
TOP: 28630
Lastly, based on the calculations that we had for touching the previous candle high and low values, we can estimate that there is a :
80% chance that we are going to touch the previous monthly high of 27600 (already happened yesterday)
25% chance that we are going to touch the previous monthly low of 25600

Range bound Nikkei, Bullish mean revThe range bound Nikkei is rebounding off support at 25,750 and heading back to the mean at 27,875 and possibly to the resistance at 30,000. The last pivot low has created bullish hidden divergence which could mean the Nikkei breaks out of its range and rallies higher.

Nikkei225 Rinse & Repeat SetupIn this update we review recent price action in the Nikkei225 futures contract and identify the next high probability trading pattern and price objectives to target

Why markets will fall this week (JPN225 analysis) Last week we saw a rally in all the stocks.
Looking at the indexes, we are seeing all of them being overbought on H4, h1, m30 and m15.
We are seeing the weakness in H1 and M30 and M15 on Nikkei.
We will sell with 500 pip stop loss and target close to 2000.

Nikkei 225 Potential Bullish ContinuationOn the H4, with price moving above the ichimoku cloud and within the ascending trend channel, we have a bullish bias that price will continue to rise from our entry at 27760 in line with the overlap swing high to our take profit at 28410 in line with the 127.20% fibonacci expansion at the swing high. Alternatively, price may reverse and break the support level at our entry and drop to our stop loss at 27130 in line with the 61.8% fibonacci projection .
Any opinions, news, research, analyses, prices, other information, or links to third-party sites contained on this website are provided on an "as-is" basis, as general market commentary, and do not constitute investment advice. The market commentary has not been prepared in accordance with legal requirements designed to promote the independence of investment research, and it is therefore not subject to any prohibition on dealing ahead of dissemination. Although this commentary is not produced by an independent source, FXCM takes all sufficient steps to eliminate or prevent any conflicts of interest arising out of the production and dissemination of this communication. The employees of FXCM commit to acting in the clients' best interests and represent their views without misleading, deceiving, or otherwise impairing the clients' ability to make informed investment decisions. For more information about the FXCM's internal organizational and administrative arrangements for the prevention of conflicts, please refer to the Firms' Managing Conflicts Policy. Please ensure that you read and understand our Full Disclaimer and Liability provision concerning the foregoing Information, which can be accessed on the website.

JP225 (Nikkei 225) Index Intraday Technical Analysis:Today was a public holiday in Japan. The JP225 index which is aligned with international markets stayed sideways during the active Japanese session. Market once again took rejection from 27444. Effects of less hawkish US fed policy were seen in the Japanese market as well. My idea is that the JP225 will take rejection from 27444. My targets for intraday are entry at resistance of 27444. My goal is support of 27250 and retracement level of 27100.
If you like this or if you think the opposite of this or if there is any other opinion, mention it in the comments. I am open to all kind of suggestions and critics

Great buy opportunity for nikkeiHi
In my elliott analysis, we are in second wave and the third (and very profitable wave) will be started soon.
Two target is shown in chart by fibo and resistance line.
Please like my idea if you agree with it.
Have good trade
Yours

NIKKEI 225 INDEX Bullish Bias! NIKKEI 225 INDEX traded in a tight wedge and it was broken
We are witnessing a bullish breach of the wedge,
and it is expected to retest the horizontal support at 26175.00 before moving up
It seems that NIKKEI 225 is destined to rise and retest the 29200.00 level

Bearish Signal on Nikkei 225 4hI have a Bearish bais on the nikkei with a stoploss @ 29,000 and a take profit @ 28,000.

NIKKEI 225 Index Target Price 29974.90Nikkei 225 Index
Trend: Up
Level: EMA 10, EMA 20, Diagonal, Horizontal

NiKKEI 225 (NI225) Potentially nearing '2B' reversal pattern.NiKKEI 225 (NI225) Potentially nearing '2B' reversal pattern.
Once prices breaks down below red line, potential confirmation of '2B' top reversal pattern completion.

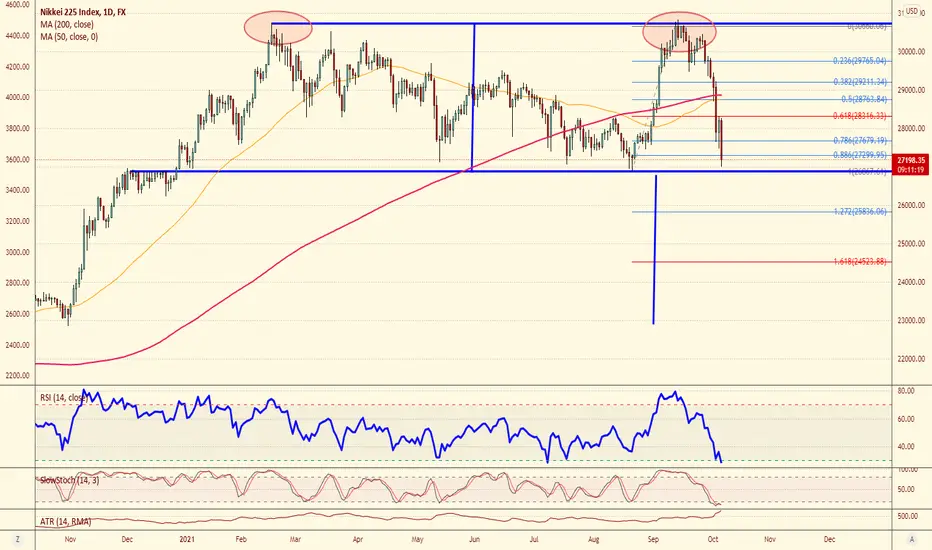
Nikkei double top projecting 15% drop in the coming months This double top in the Nikkei would suggest about a -15% drop from current levels if it plays out. Break of the neckline and being long JPY (short XXXJPY) would be a way to play this like short EURJPY or NZDJPY
JP225 wiill be a bearish trend.This is a JP225 monthly chart.
It is forming “Black Swan”
So,It’ll be a bearish trend.
I think it's a good idea to set up “Short”,
and make profit at 24,000 JPY.
Good luck.

Bearish on NikkeiNI 225 looking to consolidated. Like IXI, we are more or less at the beginning of the downtrend. Some goals are provided in purple as well. RSI show dropping momentum.
None of the above is financial advice, please do your own research - your trades are your trades.


A combination of Elliott Wave and Price action analysis $NIKKEIIn this video, you will see the importance of the Elliott Wave and Price action trading analysis on the $Nikkei example and what trade to place


