Nikkei (25/1/18) *This baby is getting weak!Now Nikkei has broken a hidden serious of 23,900 level.
We now need to watch out 23,600 level strong and it can swing back down lower.
Be careful though, WE ARE STILL IN OVERALL BULL TREND.
23,000 level will be a strong support.
Trade Safe
s0nic
Disclaimer:
The information contained in this presentation is solely for educational purposes and does not constitute investment advice.
The risk of trading in securities markets can be substantial. You should carefully consider if engaging in such activity is suitable to your own financial situation.
Sonicr Mastery dot com is not responsible for any liabilities arising on the result of your market involvement or individual trade activities.
Nikkei225trade

short at 23600 for target 23000 old support so is 580 pipsshort the nikkei at 23600 as all stock ,in oberboght + euphoria,maybe the mast rally before a big correction,but for now i will wait the real signal and play just sup and res
But true that is very crazy in stock market like just in feb 2016 you put just 10 000$ on nikkei who was around 14500 and now 2 years after at 23500//humm you get a big jacpot and same for all other stock just they down a little you buy again...totally a buble and for my view when it will corect strong will be a crach
short at 23600
target 23000
gain 600 pips

NIKKEI 1h Supply - Weekly Reversal Pattern: SHOOTING STAR!All Trade Parameters shown on the chart. Short setup on 1h Supply. Level on top of level scenario. I personally would combine both since we have a high Risk:Reward ratio on that trade anyways. Weekly Reversal Pattern with a shooting star! Looks like we reached the High of the Year. If we don't come back up to the 1h supply zones highlighted we MUST BE SHORT below the shooting star low and manage our risk accordingly!


Sayonara YEN, Hello US$ - USDJPYThere are 4 attempts that the price action tried to breakout from the 618 FIB level but without much success. The 4th one (July 2017) hit the upper channel line and collapsed to 107.48 from the high of 114.44. Wow, that is a nice 6% profit or 700 plus pips.
Now, pay attention the 5th attempt that it tries to break out from the 618 FIB level. 2 things to take note : 1) The price has breakout nicely from the upper channel, i.e. 112.73 level. 2) Weekly charts show the decrease in selling and buying has taken over (see the candles). It also shows a nice ABC pattern with the C pattern forming in process. It should hit 125.78 to align with the peak in June 2015. Of course, this is a tall order and may take many months to fulfil.
The yen has to be weaken further to benefit the exporters of Japan and this is in line with what Mr Abe wants as well. Take a look at Nikkei 225, it has recently break out the psychological high of 21,000 (50% FIB level on the monthly chart)and now sits at 22681.40. There is a positive co-relation between this index and USDJPY if you do a comparison. I expect some profit taking on Nikkei 225 in the short term which means USDJPY is likely to be sold off in the short term. Watch 112.95 to 113.12 and monitor if it will rebound from this price zone.
If it breaks 112.95 (support level or the cup and handle pattern), then it will goes further south towards 112.77 (50% FIB level).
It is a buy for USDJPY but not now, watch the price action on lower time frame and let it tells you what action to take. Patience pays.

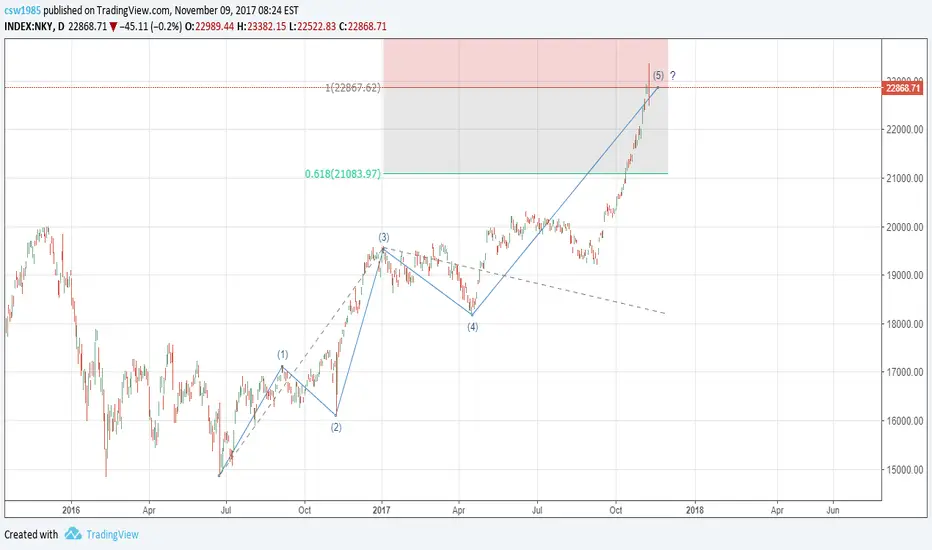
NiKKei topping An outside bar formed right on a possible target of wave 5 today (wave 5= wave 1+wave 3)
other markets to follow soon?!!


Short at 21470 target 21000 ahead of japan EclectionI short eh Nikkei who is in a very uprigh (vertical) wedge ahead of japan election buy the tumoir sell the news.
also the 21500 not seen since years and was monthy resistance
Overbougth sale as the dowkone and sp500 i think we are in a capitlisazion market or bubble is when the market price only the good news and nevermind of any bad news like he is waterproff to any bad news on geopolitical and also economy topic.
and have 2gap to be filled around 21000 and 20850
short at 21470
target 21000 in 2 step
with 2 opening position ,and will close the first position at my first target 21250
Stop loss 21660
RR 1/2.5


Nikkei Stock Index (30/9/17) *Retest Of 20,600Nikkei Index is on it way to retest 20,600 level.
Do not short, if you short you are simply taking too much unnecssary risk for now. The momentum of recent run up is just too strong/
Please make sure to us Price Action as your proper timing tool.
I'm rather cautious bullish for now.
I will update again, if there is any changes.
Trade Safe,
s0nic
Disclaimer :
This analysis not include personal feeling/opinion, and pure base on technical analysis
Trading foreign currencies can be a challenging and potentially profitable opportunity for investors. However, before deciding to participate in the Forex market, you should carefully consider your investment objectives, level of experience, and risk appetite. Most importantly, do not invest money you cannot afford to lose.
please inform me with post a comment if it reach some critical point/break pattern, reach target/reach stop level.
or if there is any question about this analysis/need new update.
Because im not monitoring this chart all time.


Long Nikkei 225 @ 19,300; TP 19,683, SL your choiceLong Nikkei 225 @ 19,300; TP 19,683, SL your choice

Nikkei 225 End Game is NearWhat we are seeing is the 5th impulsive wave up from 2013 bull market.
This 5th impulsive wave is further subdivided into another 5 wave. as labelled above.
The last of the impulsive 5th wave is taking shape to be an ending diagonal.
From the overall picture, wave 5 of the entire bull market from 2013, has failed to reach a higher point than the end of wave 3. (Which is around 20,950). In elliot wave principle, we call this a truncated 5th wave, whereby the forces to start a new trend is so strong, that wave 5 cannot reach the previous peak of wave 3.
Expect things to turn very ugly when 19,900 handle breaks. Watch for it. It may be the start of a new bear market.
I've taken a short position at 20,150, with SL above 20,400. (Please use forwards to short)
There's no take profit target for now, as I'll wait to see if the bear market plays out. If so, we can probably ride this down for a couple of months.
Below is the 5 wave Bull market EW chart (From 2013)

Nikkei 225 LongGood short term retracement trade. Not a super strong resistance, but should work. Weakening of JPY will lead to upward move, after settling of political issues in US.

JAPAN225 POTENTIAL SHORT OPPORTUNITY Japenese index Nikkei225 - Price under major daily and weekly resistance. Good short trade with great risk to reward. This correlates with jpy currency strength.


Japan225 - Bearish Trend Scenario Japan225 - Bearish Trend Scenario
Japenese index Nikkei225 recently broke and retested an ascending triangle pattern on the daily chart suggesting more downside for this index and also big strength for jpy pairs according to their correlation. If you look at the weekly chart of japan225, you can see the trump rally has lost its momentum with multiple dojis/shooting stars indicating that the pending correction is coming very soon. Potential targets for retracements is the fib 50% and 61.8% level which is also in confluence with a structured weekly support. if this analysis play out we can see big strength in jpy pairs, I can see gbp/jpy hitting 130 and usd/jpy hitting 106 in the coming days/weeks.

NIKKEI 225 BUYA double bottom is a charting pattern used in technical analysis. It describes the drop of a stock or index, a rebound, another drop to the same or similar level as the original drop, and finally another rebound. The double bottom looks like the letter "W". The twice-touched low is considered a support level.

Nikkei 225 potential long and short oppotunityif the market test the 21000 area and break the uptrend, it will opotentiall go all the way baack to 15000 area. Alterantively, a very bulish break of the resisitance could potentialy go to the 25000 area

long NI225 @ daily @ trading capability for this 1st week `17This is only a trading capability - no recommendation !!!
Next week i`ll confirm or change my opinion about this SetUp :)
Buying/Selling or even only watching is always your own responsibility ...
Best regards
Aaron

NI225 @ 1h @ will bulls defend 19000 (this 2nd week`17) again ?Take care
& analyzed it again
- it`s always your decision ...
(for a bigger picture zoom the chart)
Best regards
Aaron
