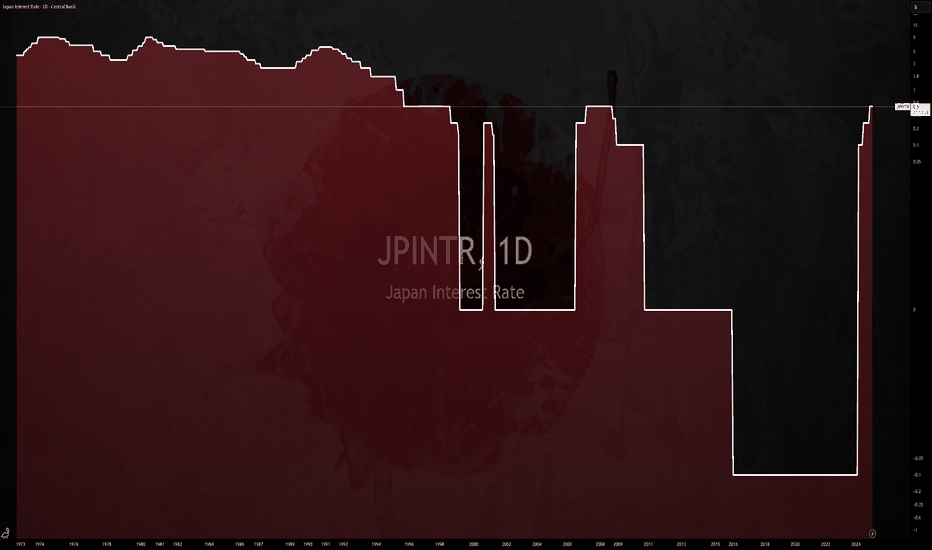
$JPINTR -Japan's Interest Rates (March/2025)ECONOMICS:JPINTR
March/2025
source: Bank of Japan
-The Bank of Japan (BoJ) kept its key short-term interest rate at around 0.5% during its March meeting, maintaining it at its highest level since 2008 and in line with market expectations.
The unanimous decision followed the central bank’s third rate hike in January and came before the U.S. Federal Reserve’s rate announcement.
The board took a cautious stance, focusing on assessing the impact of rising global economic risks on Japan’s fragile recovery.
The BoJ pointed to ongoing uncertainties in the domestic economic outlook amid higher U.S. tariffs and headwinds from overseas conditions.
While the Japanese economy had recovered moderately, some weaknesses remained.
Private consumption continued to grow, helped by wage hikes, even as cost pressures persisted.
However, exports and industrial output were mostly flat.
Inflation ranged between 3.0% and 3.5% yearly, driven by higher service prices.
Inflation expectations increased moderately, with underlying CPI projected to rise gradually.
Nikkei25
The Nikkei considers a bounce ahead of the FOMC meetingThe Nikkei 225 has fallen sharpy towards (yet held above) the September low. A small bullish hammer formed on Thursday to show a loss of bearish momentum, alongside a false break of trend support. A bullish engulfing candle formed on Friday and closed above the 100 and 200-day EMA's. Its low also respected a 50% retracement level and closed back above trend support for a second consecutive day.
We therefore suspect a bounce is on the cards, although as markets are wary of the upcoming FOMC meeting we are also aware that any such bounce may limited, so traders would be wise to keep a close eye on price action and not expect oversized moves, unless a new catalyst arrives.
Low volatility retracements within Friday's candle could help to improve the potential reward to risk ratio for bulls.
A potential bullish outcome for equities in general is if the Fed surprise with a less-hawkish-than expected hike. We know 75bp is mostly priced in, so if they hint at a slower rate of hikes going forward, equities might be able to cobble together a relief rally. Whilst a hawkish hike would likely present indices with swing highs and another leg lower.
Nikkei 225: 7th June AnalysisMONTHLY CHART
Price clearly uptrending, strong support at 21k, clearly rejected at 24k. Needs to create a solid area of resistance there, so expecting price to go up there and test if this level is really a relevant resistance level.
21k also a fib respectation, so decent support to range between those levels for a while (potentially)
Conclusion: View is definitely bullish, but rejections mean a potential drawdown on its way.
WEEKLY CHART
Nice support and channel lines lining up to an area of potential support. View on this is neutral/bearish, needs to test that 21k level for further upside move.
Conclusion: View is slightly bearish because of this sell off, looks like it already found bottom. Besides that, stay neutral.
DAILY CHART
Falling wedge broke out, structure is bearish on this one, expecting a move down. Maybe test the highs one more time.
Conclusion: Bearish on this timeframe. Clear downtrend starting, looking for a test of the lows now, which is 22k.
4 HOUR CHART
Steap move up, too steap to hold so it'll probably slow down in momentum and change direction here.


