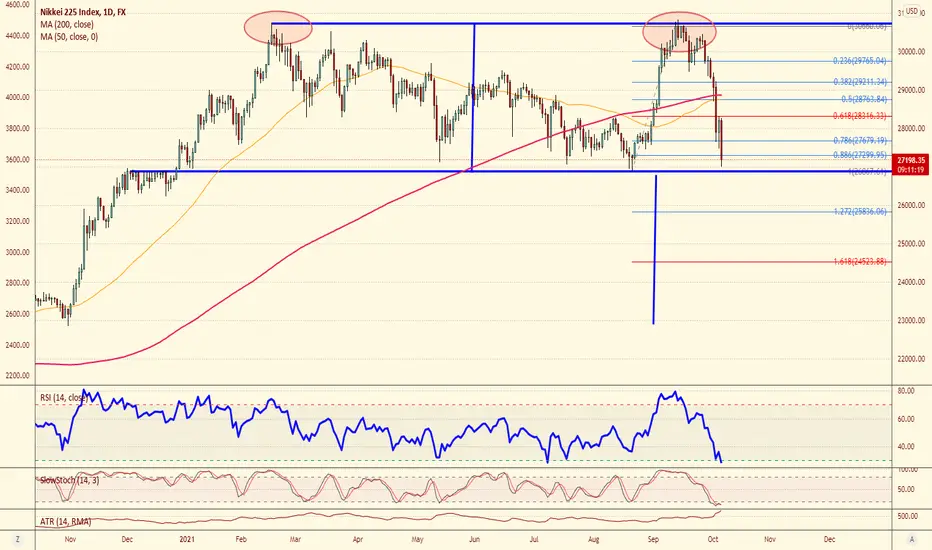
short opportunity This is a very bearish chart. I missed to opened a short position so now I have to wait for the second chance.
I will open a short position if and when:
1. the price comes back up to fill the gap in the daily chart.
2. The price is going to roll back down at major fib level such as 0.618 and 0.5.
3. Momentum indicators in daily chart stay in the bear zone and roll down to the downside.
Nikkeishort

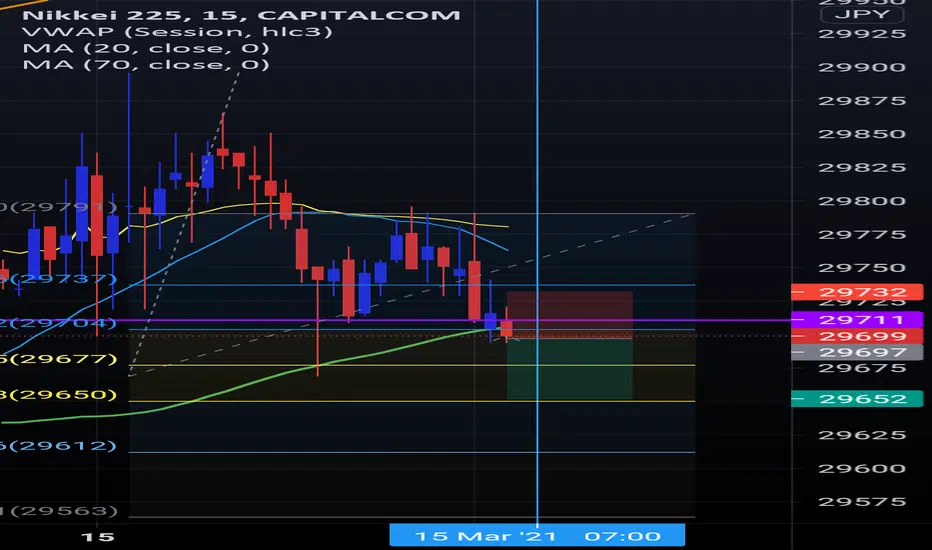
Selling NIKKEI at 37500Happy new week everyone,
We are looking to sell NIKKEI at 37500 based on the action we see this morning.
1) It created a high last week at 37,622
2) There is lot of divergence on H1, M30, M15
3) There is a shark pattern which is not quite valid, but shows a good sign to sell.
This could be a big move downwards.

JP225/NIKKEI "JAPAN 225" Indices CFD Market Heist Plan🌟Hi! Hola! Ola! Bonjour! Hallo! Marhaba!🌟
Dear Money Makers & Robbers, 🤑💰✈️
Based on 🔥Thief Trading style technical and fundamental analysis🔥, here is our master plan to heist the JP225/NIKKEI "JAPAN 225" Indices CFD market. Please adhere to the strategy I've outlined in the chart, which emphasizes short entry. Our aim is the high-risk Green Zone. Risky level, oversold market, consolidation, trend reversal, trap at the level where traders and bullish robbers are stronger. 🏆💸Book Profits Be wealthy and safe trade.💪🏆🎉
Entry 📈 : "The vault is wide open! Swipe the Bearish loot at any price - the heist is on!
however I advise to Place buy limit orders within a 15 or 30 minute timeframe most recent or swing, low or high level. I Highly recommended you to put alert in your chart.
Stop Loss 🛑:
Thief SL placed at the recent / swing low level Using the 4H timeframe (38300) swing trade basis.
SL is based on your risk of the trade, lot size and how many multiple orders you have to take.
Target 🎯: 34000 (or) Escape Before the Target
🧲Scalpers, take note 👀 : only scalp on the Short side. If you have a lot of money, you can go straight away; if not, you can join swing traders and carry out the robbery plan. Use trailing SL to safeguard your money 💰.
📰🗞️Read the Fundamental, Macro, COT Report, Quantitative Analysis, Intermarket Analysis, Sentimental Outlook before start the plan.
The JP225 (Nikkei 225 Index) is trending downwards due to a combination of economic, market, and geopolitical factors that are creating a bearish environment for Japanese equities. Below is a detailed explanation of the key reasons behind this downward movement.
⭐⚡🌟Weak Corporate Earnings
Many companies within the Nikkei 225, such as major players in the technology and automotive sectors (e.g., Toyota and Sony), have reported disappointing earnings. Growth has slowed to just 2% year-over-year, far below the expected 5%. This weakness in corporate performance is reducing investor confidence and dragging the index lower.
⭐⚡🌟Rising Inflation and Slowing GDP Growth
Japan’s inflation rate has climbed to 2.5%, surpassing the Bank of Japan’s (BoJ) 2% target. This higher inflation is eroding consumer purchasing power, which hurts domestic spending and, in turn, corporate profits. At the same time, Japan’s GDP growth has decelerated to just 0.8% in the latest quarter, signaling a sluggish economy. A slowing economy is a strong bearish signal for the stock market.
⭐⚡🌟Stronger Yen Hurting Exporters
The yen has strengthened to 142.00 against the U.S. dollar. Since the Nikkei 225 is heavily weighted toward export-driven companies, a stronger yen makes Japanese goods more expensive abroad, reducing competitiveness and cutting into profits. This currency movement is a significant factor pushing the index down.
⭐⚡🌟Global Economic Pressures
U.S. Monetary Policy: The U.S. Federal Reserve’s hawkish stance, with interest rates steady at 3.5%, has strengthened the U.S. dollar. This makes Japanese exports less attractive and reduces the yen-denominated earnings of multinational firms in the Nikkei 225.
China’s Slowdown: China, a key trading partner for Japan, is experiencing economic contraction, with its PMI at 49.2. Weak demand from China is hurting Japanese exporters, adding further downward pressure on the index.
⭐⚡🌟Technical Weakness
The Nikkei 225 is trading below its 50-day simple moving average (36,800) and nearing its 200-day simple moving average (35,500). It’s also struggling to hold support at 36,500. These technical indicators suggest a bearish trend, with the potential for further declines if key support levels break.
⭐⚡🌟Negative Market Sentiment
Speculative Traders: Data shows speculative traders have cut their net long positions to 10,000 contracts from 20,000, signaling reduced bullishness. Meanwhile, commercial hedgers have increased net short positions to 30,000 contracts, indicating expectations of lower prices.
Retail Investors and Analysts: Retail investor bullishness has dropped to 40% from 60%, and major analysts (e.g., Nomura) have lowered their year-end targets for the Nikkei 225 to 36,000 from 38,000. This shift reflects growing pessimism.
⭐⚡🌟Geopolitical and Policy Risks
Regional Tensions: Recent missile tests by North Korea (March 5, 2025) have raised security concerns in the region, dampening investor sentiment in Japan.
Bank of Japan Policy: The BoJ has hinted at potential rate hikes in late 2025. Tighter monetary policy could increase borrowing costs and weigh on stock valuations, contributing to the bearish outlook.
⭐⚡🌟Global Risk-Off Sentiment
The S&P 500 has fallen to 5,800, reflecting a broader global shift away from risky assets. At the same time, gold prices have risen to $3,000, signaling increased demand for safe-haven assets. This risk-off mood is spilling over into the Japanese market, pushing the Nikkei 225 lower.
⭐⚡🌟Commitments of Traders (COT) Data
COT data provides insights into futures market positioning for the Nikkei 225.
Speculative Traders:
Net long positions stand at approximately 20,000 contracts, up from 15,000 the previous month. This increase in bullish bets reflects growing confidence among speculators—a strong bullish indicator.
Commercial Hedgers:
Net short positions are at around 25,000 contracts, consistent with typical hedging activity. This stability suggests hedgers see current levels as sustainable—neutral.
Open Interest:
Total contracts reach approximately 50,000, an 8% increase month-over-month. Rising participation indicates growing market momentum—bullish.
Summary: COT data strongly supports a bullish outlook. Speculative long positions and rising open interest signal upward momentum, while hedgers’ steady shorts indicate no imminent sell-off pressure.
⭐⚡🌟Future Trend Prediction
Price projections for the Nikkei 225 across different timeframes.
Short-Term:
Range: 36,800 - 37,500
A breakout above 37,000 toward 37,500 is plausible if trade talk momentum persists. A pullback to 36,800 could occur on profit-taking.
Medium-Term:
Range: 36,500 - 38,000
Breaking resistance at 37,500 could propel the index to 38,000, driven by BOJ policy and trade developments. A drop below 36,500 might test 36,000 if global risks escalate.
Long-Term:
Bullish Target: 39,000 - 40,000
Achievable if the BOJ maintains easing, the yen weakens further, and global growth accelerates—60% probability.
Bearish Target: 34,000 - 35,000
Possible if the BOJ tightens policy, the yen strengthens, or a global recession emerges—40% probability.
📌Keep in mind that these factors can change rapidly, and it's essential to stay up-to-date with market developments and adjust your analysis accordingly.
⚠️Trading Alert : News Releases and Position Management 📰 🗞️ 🚫🚏
As a reminder, news releases can have a significant impact on market prices and volatility. To minimize potential losses and protect your running positions,
we recommend the following:
Avoid taking new trades during news releases
Use trailing stop-loss orders to protect your running positions and lock in profits
💖Supporting our robbery plan 💥Hit the Boost Button💥 will enable us to effortlessly make and steal money 💰💵. Boost the strength of our robbery team. Every day in this market make money with ease by using the Thief Trading Style.🏆💪🤝❤️🎉🚀
I'll see you soon with another heist plan, so stay tuned 🤑🐱👤🤗🤩

Good risk to reward sell on NikkeiWe are entering a sell on Nikkei based on the following:
1) Daily Trend is down
2) H4 is down
3) There is a sell pattern on M15 at yesterday's high
4) Good risk to reward

NIKKEI 225 Falls Hard! Short Trade Hits All TargetsThe Nikkei 225 has displayed strong bearish momentum after the short entry at 39921.50, with the price moving through multiple profit targets.
Key Levels
Entry: 39921.50 – The short position was initiated as the price broke below this level, confirming bearish pressure.
Stop-Loss (SL): 40104.00 – Positioned above recent resistance to safeguard against potential reversals.
Take Profit 1 (TP1): 39695.93 – The first target was reached, confirming the initial strength of the downtrend.
Take Profit 2 (TP2): 39330.93 – Further selling pressure led to this level being hit.
Take Profit 3 (TP3): 38965.93 – The downward trend continued, achieving this target.
Take Profit 4 (TP4): 38740.36 – The ultimate target, indicating a significant bearish move.
Trend Analysis
The price is firmly below the Risological Dotted trendline, affirming the strength of the bearish trend. The continuous downward movement highlights strong selling momentum, suggesting that bears remain in control.
The short trade on the Nikkei 225 has progressed well, with all targets reached. The final target at 38740.36 underscores a strong decline, supported by the Risological Dotted trendline and consistent selling pressure.

Nikkei index analysis. Swing trade signal!!!Hello everyone. i want share my idea about Nikkei index.
First i want introduce what is that index. Nikkei (Nikkei 225 stock average) is a price-weighted index which composed of Japan top 225 companies which traded on the Tokyo stock exchange.
This index was long time almost 2 years in bullish trend but Japan government decide to take care for yen and they are going to cut rates which will have effect at the index, i think hedge funds will take their profits soon and if it will not change trend we will get big correction which i think is perfect at the moment for catch it.
if i have fundamental reason for that i will try to short it from my marked point which is at 40174, here i have resistance and at resistance we see fair value gap, if we will use Fibonacci addition it shows perfect entry point exact at resistance and 4h fair value gap.
I am going to open here swing trade, my entry point will be 40174, stop loss at 40749 and take profit who knows? i will follow price action if i will be right. if trend will not change i am waiting only short signal from that index i think it will be correction an the correction need to be huge.
Always make your own research!!! manage your risk!!!

Selling NIKKEI on a Double TopStock have been bullish for the past 10 days and many folks are expect the bull rally to continue. We follow the charts and this is what it says:
1) NIKKEI is overbought on H4 and have created a double top with divergence.
2) There is a big pattern to sell which is being retested.
3) A smaller shark pattern has appeared
4) We will sell with the stop loss above 32800.
The target is a big drop which means stocks will need to go down at the end of this week or early next week.

Nikkei rallies to be limited by a swing high?NIK225 - 24h expiry - We look to Sell at 28330 (stop at 28530)
We are trading at overbought extremes.
Prices spiked higher and stalled at resistance in early trade.
Further selling pressure led to a reversal in price action.
The current move lower is expected to continue.
Preferred trade is to sell into rallies.
The hourly chart technicals suggests further upside before the downtrend returns.
Although the anticipated move lower is corrective, it does offer ample risk/reward today.
Our profit targets will be 27760 and 27395
Resistance: 28505 / 29295 / 29710
Support: 27880 / 27395 / 27050
Please be advised that the information presented on TradingView is provided to Vantage (‘Vantage Global Limited’, ‘we’) by a third-party provider (‘Signal Centre’). Please be reminded that you are solely responsible for the trading decisions on your account. There is a very high degree of risk involved in trading. Any information and/or content is intended entirely for research, educational and informational purposes only and does not constitute investment or consultation advice or investment strategy. The information is not tailored to the investment needs of any specific person and therefore does not involve a consideration of any of the investment objectives, financial situation or needs of any viewer that may receive it. Kindly also note that past performance is not a reliable indicator of future results. Actual results may differ materially from those anticipated in forward-looking or past performance statements. We assume no liability as to the accuracy or completeness of any of the information and/or content provided herein and the Company cannot be held responsible for any omission, mistake nor for any loss or damage including without limitation to any loss of profit which may arise from reliance on any information supplied by Signal Centre.

Nikkei to stall at previous support?NIK225 - 24h expiry - We look to Sell at 28135 (stop at 28340)
Buying pressure from 27458 resulted in prices rejecting the dip.
We are trading at overbought extremes.
This is negative for short term sentiment and we look to set shorts at good risk/reward levels for a further correction lower.
The hourly chart technicals suggests further upside before the downtrend returns.
We look to sell rallies.
Our profit targets will be 27550 and 27395
Resistance: 27880 / 28505 / 29295
Support: 27395 / 27050 / 26710
Please be advised that the information presented on TradingView is provided to Vantage (‘Vantage Global Limited’, ‘we’) by a third-party provider (‘Signal Centre’). Please be reminded that you are solely responsible for the trading decisions on your account. There is a very high degree of risk involved in trading. Any information and/or content is intended entirely for research, educational and informational purposes only and does not constitute investment or consultation advice or investment strategy. The information is not tailored to the investment needs of any specific person and therefore does not involve a consideration of any of the investment objectives, financial situation or needs of any viewer that may receive it. Kindly also note that past performance is not a reliable indicator of future results. Actual results may differ materially from those anticipated in forward-looking or past performance statements. We assume no liability as to the accuracy or completeness of any of the information and/or content provided herein and the Company cannot be held responsible for any omission, mistake nor for any loss or damage including without limitation to any loss of profit which may arise from reliance on any information supplied by Signal Centre.

Selling Nikkei into a rally.NIK225 - 24h expiry - We look to Sell at 28280 (stop at 28505)
Buying pressure from 27629 resulted in prices rejecting the dip.
Although the bulls are in control, the stalling positive momentum indicates a turnaround is possible.
This is negative for short term sentiment and we look to set shorts at good risk/reward levels for a further correction lower.
Preferred trade is to sell into rallies.
Although the anticipated move lower is corrective, it does offer ample risk/reward today.
Our profit targets will be 27705 and 27605
Resistance: 28505 / 29295 / 29710
Support: 27395 / 27050 / 26710
Please be advised that the information presented on TradingView is provided to Vantage (‘Vantage Global Limited’, ‘we’) by a third-party provider (‘Signal Centre’). Please be reminded that you are solely responsible for the trading decisions on your account. There is a very high degree of risk involved in trading. Any information and/or content is intended entirely for research, educational and informational purposes only and does not constitute investment or consultation advice or investment strategy. The information is not tailored to the investment needs of any specific person and therefore does not involve a consideration of any of the investment objectives, financial situation or needs of any viewer that may receive it. Kindly also note that past performance is not a reliable indicator of future results. Actual results may differ materially from those anticipated in forward-looking or past performance statements. We assume no liability as to the accuracy or completeness of any of the information and/or content provided herein and the Company cannot be held responsible for any omission, mistake nor for any loss or damage including without limitation to any loss of profit which may arise from reliance on any information supplied by Signal Centre.

Has Nikkei found a swing low?NIK225 - 24h expiry - We look to Buy at 27430 (stop at 27235)
Although the bears are in control, the stalling negative momentum indicates a turnaround is possible.
A Doji style candle has been posted from the base.
We are trading at oversold extremes.
Price action looks to be forming a bottom.
This is positive for sentiment and the uptrend has potential to return.
Preferred trade is to buy on dips.
Our profit targets will be 27990 and 28505
Resistance: 27880 / 28505 / 29295
Support: 27395 / 27050 / 26710
Please be advised that the information presented on TradingView is provided to Vantage (‘Vantage Global Limited’, ‘we’) by a third-party provider (‘Signal Centre’). Please be reminded that you are solely responsible for the trading decisions on your account. There is a very high degree of risk involved in trading. Any information and/or content is intended entirely for research, educational and informational purposes only and does not constitute investment or consultation advice or investment strategy. The information is not tailored to the investment needs of any specific person and therefore does not involve a consideration of any of the investment objectives, financial situation or needs of any viewer that may receive it. Kindly also note that past performance is not a reliable indicator of future results. Actual results may differ materially from those anticipated in forward-looking or past performance statements. We assume no liability as to the accuracy or completeness of any of the information and/or content provided herein and the Company cannot be held responsible for any omission, mistake nor for any loss or damage including without limitation to any loss of profit which may arise from reliance on any information supplied by Signal Centre.

Nikkei to find sellers at previous support?NIK225 - 24h expiry - We look to Sell at 27310 (stop at 27425)
Previous support level of 27266 broken.
Although the bears are in control, the stalling negative momentum indicates a turnaround is possible.
We are trading at oversold extremes.
Short term bias has turned negative.
A higher correction is expected.
We therefore, prefer to fade into the rally with a tight stop in anticipation of a move back lower.
Our profit targets will be 26980 and 26700
Resistance: 27390 / 27815 / 28500
Support: 27040 / 26700 / 26270
Risk Disclaimer
The trade ideas beyond this page are for informational purposes only and do not constitute investment advice or a solicitation to trade. This information is provided by Signal Centre, a third-party unaffiliated with OANDA, and is intended for general circulation only. OANDA does not guarantee the accuracy of this information and assumes no responsibilities for the information provided by the third party. The information does not take into account the specific investment objectives, financial situation, or particular needs of any particular person. You should take into account your specific investment objectives, financial situation, and particular needs before making a commitment to trade, including seeking advice from an independent financial adviser regarding the suitability of the investment, under a separate engagement, as you deem fit.
You accept that you assume all risks in independently viewing the contents and selecting a chosen strategy.
Where the research is distributed in Singapore to a person who is not an Accredited Investor, Expert Investor or an Institutional Investor, Oanda Asia Pacific Pte Ltd (“OAP“) accepts legal responsibility for the contents of the report to such persons only to the extent required by law. Singapore customers should contact OAP at 6579 8289 for matters arising from, or in connection with, the information/research distributed.

JPN225 I think we are in distribution and a drop is comingtypical wyckoff distribution and I will be expecting a drop to daily FVG

NIKKEI 225 CFD BEARISH PATTERNJapan Economy Watchers Current Index was announced yesterday, below its forecast and also below its neutral line of 50, at 43.8, which can be used as a marker for downturn of the country's economy.
On a technical level Japan 225 CFD broke the support of the rising wedge pattern, also signaling a potential bearish move on the instrument. Both MACD and RSI indicators confirm the pattern, and in both the fast moving average is increasing the gap with the slow moving average, indicated best by the MACD histogram. This might be read as an indicator for big movement.
If the pattern gets confirmed the price might test its previous low at 27840. If the opposite scenario occurs, the instrument might test the previous support of the rising wedge at 28270.
Risk Disclosure: Trading Foreign Exchange (Forex) and Contracts of Difference (CFD's) carries a high level of risk. By registering and signing up, any client affirms their understanding of their own personal accountability for all transactions performed within their account and recognizes the risks associated with trading on such markets and on such sites. Furthermore, one understands that the company carries zero influence over transactions, markets, and trading signals, therefore, cannot be held liable nor guarantee any profits or losses.

NIkkei 4H chart.Jp225 is in downtrend and as you can see it is corrected the price(correction in 1H chart as well). And going to strong impulse asap.

JP225 (Nikkei 225) Index Intraday Technical Analysis:Today was a public holiday in Japan. The JP225 index which is aligned with international markets stayed sideways during the active Japanese session. Market once again took rejection from 27444. Effects of less hawkish US fed policy were seen in the Japanese market as well. My idea is that the JP225 will take rejection from 27444. My targets for intraday are entry at resistance of 27444. My goal is support of 27250 and retracement level of 27100.
If you like this or if you think the opposite of this or if there is any other opinion, mention it in the comments. I am open to all kind of suggestions and critics

NIKKEI 225 INDEX Bullish Bias! NIKKEI 225 INDEX traded in a tight wedge and it was broken
We are witnessing a bullish breach of the wedge,
and it is expected to retest the horizontal support at 26175.00 before moving up
It seems that NIKKEI 225 is destined to rise and retest the 29200.00 level

NIKKEI 225 : PRICE ACTION ANALYSIS | NEW SWING SHORT SCENARIO ⭐️TOKYO (Kyodo) -- Tokyo stocks opened lower Tuesday, with the Nikkei index briefly falling below the 25,000 line for the first time since November 2020, on growing concern over the economic impact of rising crude oil prices amid Russia's military action in Ukraine.
In the first 15 minutes of trading, the 225-issue Nikkei Stock Average fell 230.00 points, or 0.91 percent, from Monday to 24,991.41. The broader Topix index of all First Section issues on the Tokyo Stock Exchange was down 16.67 points, or 0.93 percent, at 1,777.36.
Decliners were led by air transportation, oil and coal product, and iron and steel issues.
At 9 a.m., the dollar fetched 115.36-39 yen compared with 115.25-35 yen in New York and 115.01-03 yen in Tokyo at 5 p.m. Monday.
The euro was quoted at $1.0864-0868 and 125.33-41 yen against $1.0848-0858 and 125.12-22 yen in New York and $1.0870-0872 and 125.02-06 yen in Tokyo late Monday afternoon.

Nikkei double top projecting 15% drop in the coming months This double top in the Nikkei would suggest about a -15% drop from current levels if it plays out. Break of the neckline and being long JPY (short XXXJPY) would be a way to play this like short EURJPY or NZDJPY

Nk sell ideaCandles are closing below support, price has trended downwards. I think it can fall a bit further
NI225 for Sell from a big resistanceNikkei 225 is following an uptrend but approaching a big resistance. (end on correction)
We wait for price to break the trend-line and retest before considering a Short position.

NIKKEI where will it bounce? #tradingHave a look at this chart and let me know your thoughts - two minds better than one.
