Elliott Wave View: Nikkei Looking for More DownsideShort Term Elliott Wave View in Nikkei suggests the decline to 19900 on August 6 ended wave (3). The Index is currently in wave (4) bounce and the internal subdivision is unfolding as a double three Elliott Wave structure. Up from 19900, wave W ended at 20795 as a zigzag. Wave ((a)) of W ended at 20650 and wave ((b)) of W ended at 20220. Then the move higher to 20795 completed wave ((c)) of W.
The Index then pullback to 20075 which ended wave X with internal subdivision as a zigzag. Wave ((a)) of X ended at 20300, wave ((b)) of X ended at 20765, and wave ((c)) of X ended at 20075. Wave Y is in progress with the internal subdivision of a double three in lesser degree. Up from 20075, wave ((w)) ended at 20685 and wave ((x)) ended at 20450. Near term, while above 20075, Index has scope to extend higher towards 20974 – 21530 area to end wave Y of (4). Expect sellers to appear from the above area and Index to either resume lower or pullback in 3 waves at least. We don’t like buying the Index.
Nikkeitrade

Nikkei Potential Head and Shoulders?The Nikkei is showing a potential head and shoulders pattern on the 2 hour chart. If we do break below the support at 21620,
then we would await for a lower high which would be a retest of the break.
However, ideally, would like to see a bounce and then a lower high which would make the head and shoulders pattern.
Price is turning at a resistance zone (21800) zone which adds further confluence.
This is a trade that can possibly play out next week. Keep it on your radar!

Short $NIKKEI For July - August Seasonal TradeNIKKEI is leading lower fast with a suspected $USDJPY tank. $SPY $IWM $QQQ $USDJPY
NIKKEI Seaonality starts today or tomorrow for the short: www.mrci.com

Global Financial Engineering Swing Trading Strategy for Nikkei We have decided to take a bullish trade at 21309 with a Global Stop Loss(GSL) at 21100 and a Global Profit Target at 22498
The Primary Trend (PT) given by the Monthly TIME BAR (MTB) is currently Bearish
The Secondary Trend (ST), given by the Weekly TIME BAR (WTB) is currently Bullish
The Medium Term Trend (MTT), given by the Daily TIME BAR (DTB) is currently Bullish
The Short Term Trend (STT), given by the Four Hour TIME BAR (FHTB) is currently Bullish
This is a high risk trade since the Primary and Secondary Trend are still bearish. We are taking this trade in the direction of the Medium Term Trend which is given by the Global Daily Time Bars(GDTB).
In light of the above trend analysis we will start a bullish trade using Global Trading Strategy #4 on the Global Automated Trading System #4 which trade in the direction of the Global Daily TIME BARS (GDTB).
Global Entry Signal: Buy @21309
Global Stop Loss: 21100
Global Target Profit: 22498
Global Trade Management Strategy: We will applied the Global Trailing Stop System for Global Trading Strategy #4
--------------------------
The analysis in this material is provided for information only and is not and should not be construed as an offer to sell or the solicitation of an offer to buy any security.
To the extent that this material discusses general market activity, industry or sector trends or other broad-based economic or political conditions, it should not be construed as research or investment advice.
To the extent that it includes references to specific securities, commodities, currencies, or other instruments, those references do not constitute a recommendation by Global Financial Engineering,Inc. to buy, sell or hold such investments.
This material does not and is not intended to take into account the particular financial conditions, investment objectives or requirements of individual customers.
Before acting on this material, you should consider whether it is suitable for your particular circumstances and, as necessary, seek professional advice.

Nikkei Wave count and speculative buy zoneThat's all it is at this stage. I am not looking to buy the Nikkei index, but a number of interesting individual stocks mirror this wider theme. Sort of a lower swing high being set and "one more drop" to set a higher low then off we go sort of thing. Let's see.
Short to short-mid bearish, medium term to long term bullish.

"Top and Bottom Analysis" NIKKEI 225 by ThinkingAntsOk4H CHART EXPLANATION:
Main Items we Observe on the Chart:
-Price has broken the ascending trendline
-Currently, price is on a support zone
-We will wait for a corrective structure on the support zone before taking any trade
Based on this if the price breaks down with a close candlestick below 20718.0 we expect a continuation of the downward movement towards 19964.0
MULTI TIMEFRAME VISION:
-Weekly :
-Daily:

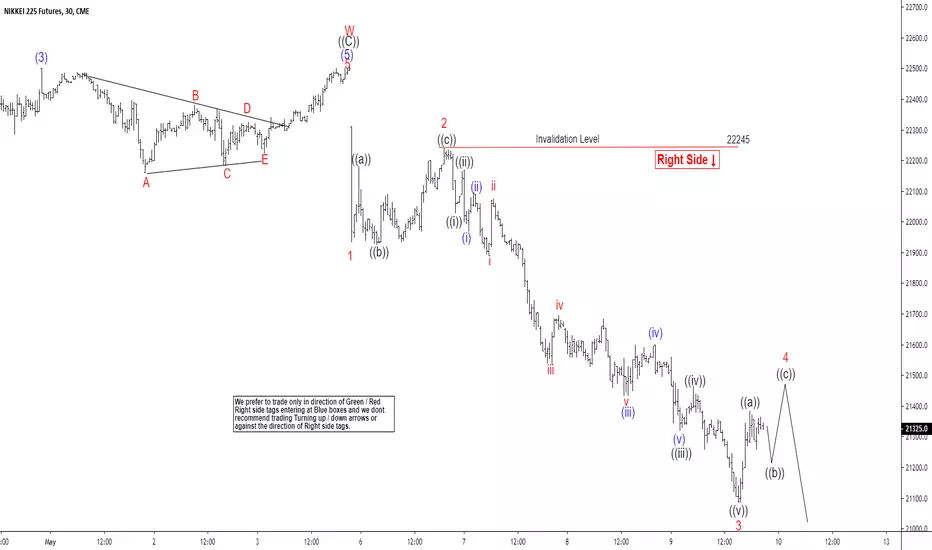
Elliott Wave View: Impulsive Decline in NikkeiOur Elliott Wave view on Nikkei suggests the rally to May 4, 2019 high (22505) ended wave w. This ended cycle from December 26, 2018 low and the Index is in the process of at least doing a larger 3 waves pullback. Short Term, decline in Nikkei from May 4, 2019 high is unfolding as an Elliott Wave impulse structure. Down from 22505, wave 1 ended at 21935 and wave 2 ended at 22245. Wave 3 ended at 21080 low.
Expect wave 4 bounce to fail in 3, 7, or 11 swing as far as wave 2 pivot at 22245 stays intact. Possible target for wave 4 is 23.6 – 38.2 retracement of wave 3 at 21539 – 21672. Alternatively, Index can end the entire 5 waves from May 4, 2019 high already. In this case, it should do a larger 3 waves bounce to correct the cycle from May 4 high before the decline resumes. We don’t like buying the Index and expect further downside in the Index to complete a 5 waves down.
NI225 (Nikkei) - Market Crash Cycles | Indices | Macro Trends*Please support this idea with a LIKE if it helps you. Thanks!
More details about me in my signature.
NI225 has been labeled within a Grand Super-Cycle degree wave B (pink), which has been unfolding ever since the Tokyo Stock Bubble back in 1990.
Structure - Flat Formation
1990 bubble peak and down until Apr 2003 bottoms - Super-Cycle (w) (purple)
2003 bottoms up until 2007 tops - Cycle wave a (turquoise)
2007 tops and down until 2008 lows - Cycle wave b (turquoise)
2008 lows and up until present times - Cycle wave C (turquoise), the final leg of Super-Cycle (X) (purple)
Cycle wave C (turquoise)
Pattern - Ending Diagonal
Sequence - 5-Wave Sequence, with Primary Waves 1 2 3 4 5 (green) decomposed as Intermediate (A)(B)(C) (blue)
Current Position
Primary Wave 5 (green)
Next expected swing
Bearish sequence in Intermediate (B) (blue)
Market Crash Forecast
Support granted at or around the 21000.00 mark and then a bull run towards the 27000.00 levels, where Super-Cycle (X) (purple) is expected to complete
Super-Cycle Waves (a)(b)(c) (red) would reflect the next Larger Degree Recession or even a Depression
Structure change:
Breach of the lower trend-line of the Ending Diagonal could reflect the fact that the Market Crash already started.

Elliott Wave View: Nikkei Rally Likely Fails for DownsideElliott Wave view is calling an end to Nikkei’s rally from December 26, 2018 low with wave X at 21884. The Index should resume the move lower and should eventually break below wave December 26, 2018 low. Or at minimum, the Index should do a larger 3 waves pullback to correct the cycle from 19055 low. Down from wave X at 21884, the decline is unfolding as a zigzag Elliott Wave structure where wave ((a)) ended at 20680. Internal of wave ((a)) subdivides as a 5 waves impulse.
Wave ((b)) bounce is currently in progress as a Flat Elliott Wave structure. Up from 20680, wave (a) ended at 21520 and wave (b) ended at 20705. Internal of wave (a) unfolded as a double three Elliott Wave structure. Up from 21520 low, wave w ended at 21410, wave x ended at 21015, and wave y of (a) ended at 21520. Internal of wave (b) ended as a zigzag at 20705. Wave a of (b) ended at 21160, wave b of (b) ended at 21505, and wave c of (b) ended at 20705. Wave (c) of ((b)) is in progress as a 5 waves impulse. The rally should fail below March 4 high at 21884 for further downside. We don’t like buying the Index and expect rally to fail for further downside as far as pivot at 21884 high stays intact.

A bit unsure stillNikkei 225 is a bit tricky. Good fundamental data out of Japan such as dovish monetary policy, but weak export figures which is why its down today. Technically, we are well above most exponential moving averages, but stochastic reads overbought while momentum suggests we are still headed in an uptrend. Overall, not enough signals for one way or the other.

Nikkei Stock Index (We are now at strong resistant)View On Nikkei Stock Index(5 Mar 2019)
It has been going up recently and now we are at a strong resistant level of 21,765 regions.
That region may cause the market to pause and may even pull back down first.
If you want to long, I suggest you should rather wait at lower and strong support level such as 21,000 or even 21,200.
If there is any changes, I will update again.
DYODD, all the best and read the disclaimer too.
Feel Free to "Follow", press "LIKE" "Comment".
Thank You!
Legal Risk Disclosure:
Trading foreign exchange or CFD on margin carries a high level of risk, and may not be suitable for all investors.
The high degree of leverage can work against you as well as for you. Before deciding to trade foreign exchange you should carefully consider your investment objectives, level of experience and risk appetite.
The possibility exists that you could sustain a loss of some or all of your initial investment and therefore you should not invest money that you cannot afford to lose.
You should be aware of all the risks associated with foreign exchange trading, and seek advice from an independent financial advisor.
DISCLAIMER:
Any opinions, news, research, analyses, prices or other information discussed in this presentation or linked to from this presentation are provided as general market commentary and do not constitute investment advice.
Sonicr Mastery Team does not accept liability for any loss or damage, including without limitation to, any loss of profit, which may arise directly or indirectly from use of or reliance on such information.

SHORT Nikkei 225 approaching resistance, potential drop!Nikkei 225 is approaching our first resistance at 21868.6(horizontal swing high resistance, 100% Fibonacci extension , 78.6%Fibonacci retracement) where a strong drop might occur below this level pushing price down to our major support at 21159.1(23.6% Fibonacci retracement , Horizontal swing low support)
Stochastic (89,5,3) is also approaching resistance where we might see a corresponding drop in price.
Trading CFDs on margin carries high risk. Losses can exceed the initial investment so please ensure you fully understand the risks.

Nikkei could be in troubleI outline why on this 2H time frame the greater probability for the Nikkei is for the south. How far south is another issue. No predictions - as usual.

Elliott Wave View: Further Rally in Nikkei FavoredShort-term Elliott wave view in Nikkei suggests that the Index has ended correction at 20169 as wave ((X)) and starts a new leg higher. Decline to 20169 on 8 February took the form of an Elliott Wave Expanded Flat. An Elliott Wave Flat structure has an ABC label with subdivision of 3-3-5. We can see from the 1 hour chart wave (B) of this FLAT ended at 20970 and wave (C) ended at 20169. Subdivision of wave (C) unfolded as a 5 waves Impulse Elliott Wave structure. Down from 20970, wave 1 ended at 20815, and wave 2 ended at 20895. Wave 3 ended at 20270, wave 4 ended at 20370, and wave 5 ended at 20169.
The Index has since rallied and broke above the previous high on February 5th, suggesting the next leg higher has started. Rally from Feb 9th low (20169) is unfolding as a 5 waves Impulse structure. Up from 20169, wave 1 ended at 20480 and wave 2 ended at 20390, wave 3 at 21198 and wave 4 at 21060 low. Expect ideally 1 more leg higher in the Index to end the 5 waves up. Afterwards, it should pullback to correct the cycle from Feb 9 low within wave (B) in 3, 7, or 11 swing. As far as pullback stays above 20390 low, expect the Index to extend higher. We don’t like selling the Index.

Risk on catching market off guard,high conviction Long Nikkei225Weekly Insidebar pushing higher towards 22500 level.
Risk on continues, JGB yields bottomed. Path higher is clear


NIKKEI approaching resistance, potential drop! Nikkei is approaching our first resistance at 20899 (100% fibonacci extension, 50% fibonacci retracement, horizontal pullback resistance) and a strong drop might occur below this level pushing price down to our major support at 18995 (61.8% fibonacci extension, horizontal swing low support).
Stochastic (21,5,3) is also approaching resistance and we might see a corresponding drop in price should it react off this level.
Trading CFDs on margin carries high risk.
Losses can exceed the initial investment so please ensure you fully understand the risks

NIKKEI 225 Index Strugles to break above 20200The correction of Deep dive from 21600 to 19000 seems to be blocked by 20200 resistance.
An ascending triangle pattern is being printed on H4 Chart. - Potential bearish continuation pattern. -
Short at the potential breakout.
Bullish breakout would be validated at 20225.

Can Aggressive Elliott Wave View In Nikkei Will Play Out?Nikkei short-term Elliott wave view suggests that the cycle from 10/01/2018 peak is showing 5 swings bearish sequence. This favor more downside to 19073-16773 100%-123.6% Fibonacci extension area to be reached in 7 swings before support for bigger 3 wave bounce is seen at least. The decline from 10/01 peak is showing overlapping price action thus suggests that decline is unfolding in a corrective sequence i.e could be unfolding as double three structure.
Currently, the decline to 21075 low blue wave (W) lower. Above from there, a bounce in blue wave (X) took place as a Flat correction where red wave A ended at 21735 high. Wave B ended at 20950 low and red wave C ended at 21923 high which also completed blue wave (X). Down from there, blue wave (Y) can be completed at 19278 low. Above from there the index is expected to do a bounce in 3, 7 or 11 swings within blue (X)(X) of a possible triple correction lower. We expect short-term sellers to appear in 3, 7 or 11 swings on a bounce in blue wave (X)(X).


Nikkei: The Why's & How's I'm SHORT Now - Lesson In Wave TradingThere is NEVER a SURE 100% trade. And I'm not giving you one. Let's be clear about that. But as you can see on my chart, I'm sure enough about what is about to happen to the Nikkei that I am already SHORT on it TWICE OVER. And if prices do go the way I am projecting and they do pull back up and cover those HUGE gaps that were left behind, I'll be looking to sell again! But let me explain why I think this.
What I see happening is that the recent high that was just established could very well have been the top of a wave (X) correction. This following the completion of a wave (W). That wave (W) was a sharp downward correction off the possible completion of that HUGE LONG impulse wave that lasted years! That wave (W) crash signaled the end of that MAJOR impulse wave. I had been calling that long impulse wave up as a wave (iii) and that crash down ended it. So why didn't I label that wave (W) drop as a completed wave (iv)? Well, it could be but highly unlikely given that it was so sharp and brief. Wave 4's don't tend to be that way. Wave 4-type corrections usually unfold in an long drawn out fashion. And if you have been counting waves as long as I have, you would've have seen this kind of price action take place hundreds if not thousands of times in the 26+ years that I have been trading. And I also seen just as many times what follows, too.
So for arguments sake, let's just say that my wave count is correct and that was indeed a completed wave (iii) and what followed was a wave (W). After a wave (W), you would expect that the next wave will be a corrective wave (X). And what did follow was a very clear 3-wave corrective wave (X). But only one problem....that correction ended ABOVE the top of what I labeled as the wave (iii) end. So, that opened up 2 possibilities...1) that the new high was actually the end of that MAJOR wave (iii) or 2) as I see it, this overall correction following where I labeled the end of the wave (iii) is unfolding as an extended flat where the corrective wave (X) does exceed the high of the previous complete impulse wave. If that is the case, then we can already project what is to happen next and also project possible targets based on the rules that we have for extended flats and how they tend to unfold.
Regardless, I trust my wave count because as you can see, I've hit 4 out of 4 trades pulling in over +8000 points over the course of this year JUST on the Nikkei alone! You don't even want to know how I did in the other major indexes as you would find it hard to believe! But that is besides the point. The point I'm trying to make here is that if you can apply a good, workable wave count combined with a good knowledge about price action, you can make trades like these. Those 4 out of 4 (100%) winning trades are just the ones that I have already closed and banked the profits on. That does not include the 2 OPEN SHORT trades that are already in profit now.
If you find it hard to believe me, here is my chart I published to my followers back on September 12th showing my projections on what was to happen in the Nikkei. As you will see, that "explosion up" that ended what I have recently labeled the wave (X) I had already predicted would happen MONTHS AGO. That is the power of wave counting in action!
There will be those that argue that my wave count is not correct and if you know me, you also know that I don't prescribe to the theory that you absolutely have the ABSOLUTE correct wave count in order to make money. No. You just have to have a workable wave count that puts you on the right side of the market.
So if you believe me about what I see, you will want to wait for prices to pullback before you look to get SHORT.
If you want to know more, PM me or see my signature box below for more info.

NIKKEI: Rising WedgeHaving broken out of resistance around the 23000 area and come back below it, the technical picture now looks muddled. For now we can say that we're in a rising wedge, and trend support is currently at the lower boundry.

NIKKEI 225 Index, Daily Chart Analysis 10/17Technical Analysis and Outlook
Most Asian markets opened positive, while the Nikkei index is heading towards Mean Resistance 23499 after a higher closure on short covering and bargain hunting as expected. The Dead-Cat-Bounce stage advancement scenario might address the pullback target to Key Support 22316 or thereabouts .
